Races in Paradise, California (CA) Detailed Stats
Ancestries, Foreign-born residents, place of birth
Settings
X


Recent posts about races in Paradise, California on our local forum with over 2,400,000 registered users:
 | FILMMAKERS ANALYZE PARADISE FIRE: Blame Residents for Town's Fire-Prone Location (48 replies) |
| Paradise Fire/Camp Creek Fire 11/08/2018 (783 replies) |
| The Paradise megafire - the future? (87 replies) |
| Fireproof houses. (43 replies) |
| Paradise Strong - Butte County Recovers - what a joke (26 replies) |
| Prop 13 (megatopic) (1358 replies) |
Latest news about races in Paradise, CA collected exclusively by city-data.com from local newspapers, TV, and radio stations
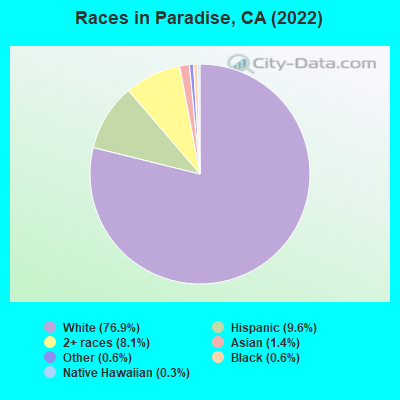
According to 2022 data, the most numerous races in Paradise, CA are Hispanic (1,815 residents), White alone (17,075 residents), and Asian alone (235 residents). 94.7% of Paradise residents speak English at home. 2.5% of Paradise, CA residents are foreign-born (0.7% born in Latin America, 0.6% born in Asia, 0.6% born in Europe, 0.4% born in North America), which is 932.6% less than the foreign-born rate of 26.0% across the entire state of California.
Race distribution in Paradise
2000
2022

- 24,08091.2%White alone
- 1,1274.3%Hispanic
- 5782.2%Two or more races
- 2621.0%Asian alone
- 2480.9%American Indian alone
- 500.2%Black alone
- 340.1%Other race alone
- 290.1%Native Hawaiian and Other
Pacific Islander alone

-
- 17,07579.3%White alone
- 1,8158.4%Hispanic
- 1,3846.4%Two or more races
- 2351.1%Asian alone
- 880.4%Black alone
- 650.3%American Indian alone
- 440.2%Other race alone
2000
2022
-
- 15,816,79046.7%White alone
- 10,966,55632.4%Hispanic
- 3,648,86010.8%Asian alone
- 2,181,9266.4%Black alone
- 903,1152.7%Two or more races
- 178,9840.5%American Indian alone
- 103,7360.3%Native Hawaiian and Other
Pacific Islander alone - 71,6810.2%Other race alone

-
- 15,732,18440.3%Hispanic
- 13,160,42633.7%White alone
- 5,957,86715.3%Asian alone
- 2,025,2185.2%Black alone
- 1,663,2224.3%Two or more races
- 251,6180.6%Other race alone
- 135,7770.3%Native Hawaiian and Other
Pacific Islander alone - 103,0300.3%American Indian alone

Income and house value in Paradise
- Median household income in 2022
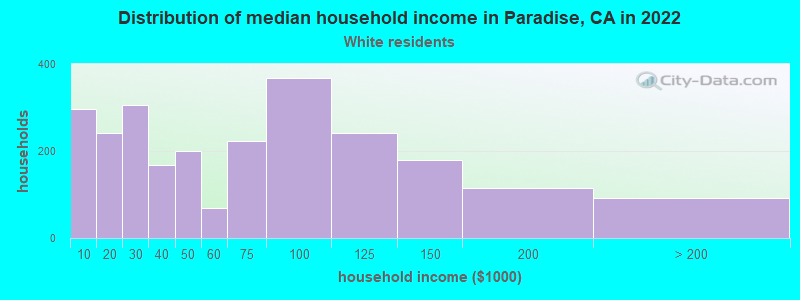
- $75,855White non-Hispanic householders
- $31,588Black householders
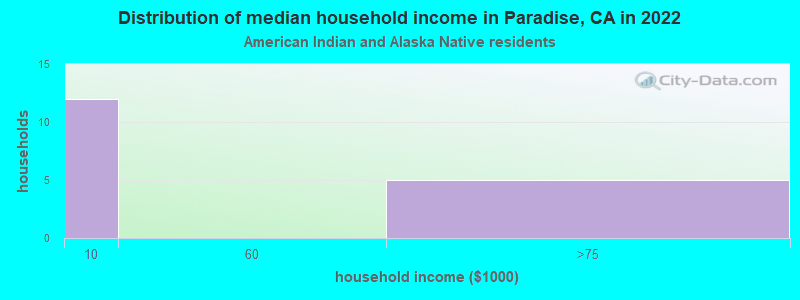
- $103,849American Indian and Alaska Native householders
- $14,443Asian householders
- $69,730Native Hawaiian and other Pacific Islander householders
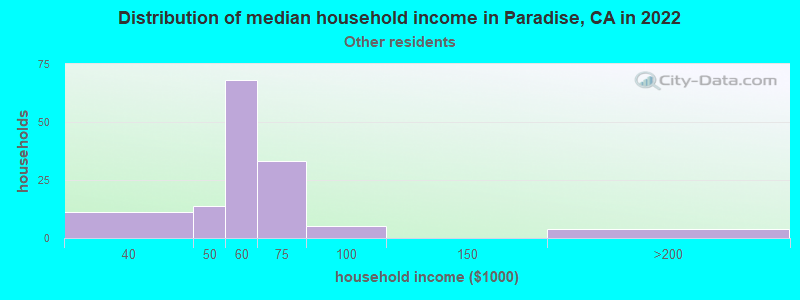
- $88,298Some other race householders
- $53,690Two or more races householders
- $79,524Hispanic or Latino race householders
- Median 2022 house value
- $466,828White Non-Hispanic householders
- $233,954Black or African American householders
- $449,912American Indian or Alaska Native householders
- $753,692Asian householders
- over $1,000,000Native Hawaiian and other Pacific Islander householders
- $375,046Some other race householders
- $317,457Two or more races householders
- $435,874Hispanic or Latino householders
Household income for White non-Hispanic householders
Household income for American Indian and Alaska Native householders
Household income for Asian householders

Household income for Some other race householders
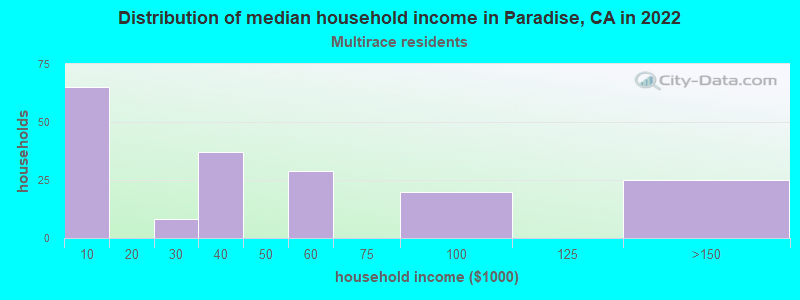
Household income for Two or more races householders
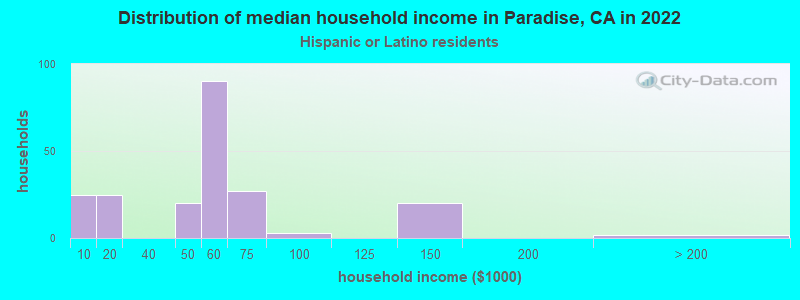
Household income for Hispanic or Latino race householders
Median age by race in Paradise
- 54.7Median age for White residents
- 52.2Males
- 55.2Females
- 46.8Median age for Black or African American residents
- 49.5Males
- 65.0Females
- 48.7Median age for American Indian / Alaska Native residents
- 37.5Males
- 49.3Females
- 53.1Median age for Asian residents
- 43.0Males
- 60.0Females
- 38.9Median age for Native Hawaiian / Pacific Islander residents
- 28.7Median age for Other race residents
- 18.4Males
- 38.8Females
- 41.6Median age for Two or more races residents
- 42.4Males
- 38.9Females
- 52.4Median age for White alone residents
- 50.0Males
- 54.8Females
- 36.0Median age for Hispanic or Latino residents
- 37.5Males
- 34.4Females
Owner/renter occupied households by race in Paradise
- House owners and renters - White residents
- 4,85970.0%Owner occupied
- 2,08430.0%Renter occupied
- House owners and renters - American Indian / Alaska Native residents
- 7492.8%Owner occupied
- 67.2%Renter occupied
- House owners and renters - Asian residents
- 4076.7%Owner occupied
- 1223.3%Renter occupied
- House owners and renters - Other race residents
- 6147.1%Owner occupied
- 6952.9%Renter occupied
- House owners and renters - Two or more races residents
- 94479.2%Owner occupied
- 24920.8%Renter occupied
- House owners and renters - White alone residents
- 5,00468.9%Owner occupied
- 2,26031.1%Renter occupied
- House owners and renters - Hispanic or Latino residents
- 35458.4%Owner occupied
- 25241.6%Renter occupied
Language usage in Paradise
- English speakers - Total
- 94.7% of residents of Paradise speak English at home.
- 3.7% of residents speak Spanish at home
- 58474.5%Speak English very well
- 20025.5%Speak English less than very well
- 2.2% of residents speak other language at home
- 22248.2%Speak English very well
- 23951.8%Speak English less than very well
- English speakers - Born in the United States
- 96.3% of residents of Paradise speak English at home.
- 2.2% of residents speak Spanish at home
- 6961.6%Speak English very well
- 4338.4%Speak English less than very well
- 1.2% of residents speak other language at home
- 58100.0%Speak English very well
- English speakers - Native, born elsewhere
- 74.6% of residents of Paradise speak English at home.
- 25.1% of residents speak other language at home
- 100100.0%Speak English less than very well
- English speakers - Foreign-born
- 39.4% of residents of Paradise speak English at home.
- 26.6% of residents speak Spanish at home
- 8761.7%Speak English very well
- 5438.3%Speak English less than very well
- 37.2% of residents speak other language at home
- 7437.6%Speak English very well
- 12362.4%Speak English less than very well
White (Caucasian) - Speak only English
| Native: | 100.0% (15,490) |
| Foreign-born: | 77.3% (131) |
White (Caucasian) - Speak another language
| Native: | 2.7% (425) |
| Foreign-born: | 31.7% (54) |
American Indian / Alaska Native - Speak another language
| Native: | 33.6% (78) |
| Foreign-born: | 100.0% (25) |
Asian - Speak only English
| Native: | 100.0% (134) |
| Foreign-born: | 8.6% (8) |
Asian - Speak another language
| Native: | 16.1% (22) |
| Foreign-born: | 88.4% (83) |
Other race - Speak another language
| Native: | 65.9% (172) |
| Foreign-born: | 100.0% (175) |
White alone - Speak only English
| Native: | 98.2% (15,918) |
| Foreign-born: | 62.1% (127) |
White alone - Speak another language
| Native: | 1.6% (263) |
| Foreign-born: | 32.8% (67) |
Hispanic or Latino - Speak only English
| Native: | 66.9% (1,081) |
| Foreign-born: | 8.3% (16) |
Hispanic or Latino - Speak another language
| Native: | 33.2% (537) |
| Foreign-born: | 89.9% (169) |
Foreign-born residents in Paradise
542 residents are foreign born (0.7% Latin America, 0.6% Asia, 0.6% Europe, 0.4% North America).
| This city: | 2.5% |
| California: | 100.0% |


Marital status for residents in Paradise
Marital status - White (Caucasian) population 15 years and over
- Males
- 29.1%Never married
- 51.3%Now married
- 1.9%Separated
- 4.1%Widowed
- 13.7%Divorced
- Females
- 20.1%Never married
- 43.3%Now married
- 2.5%Separated
- 15.1%Widowed
- 19.0%Divorced
Women who gave birth in the past 12 months
| Now married: | 15.6% (22) |
| Unmarried: | 84.4% (121) |
Women who did not give birth in the past 12 months
| Now married: | 46.3% (1,116) |
| Unmarried: | 53.7% (1,296) |
Marital status - Black or African American population 15 years and over
- Males
- 17.5%Never married
- 15.9%Now married
- 54.0%Separated
- 12.7%Widowed
- 0.0%Divorced
- Females
- 26.7%Never married
- 46.7%Now married
- 0.0%Separated
- 20.0%Widowed
- 6.7%Divorced
Women who did not give birth in the past 12 months
| Now married: | 0.0% (0) |
| Unmarried: | 100.0% (5) |
Marital status - American Indian / Alaska Native population 15 years and over
- Males
- 15.4%Never married
- 17.3%Now married
- 0.0%Separated
- 0.0%Widowed
- 67.3%Divorced
- Females
- 37.0%Never married
- 16.5%Now married
- 3.9%Separated
- 26.0%Widowed
- 16.5%Divorced
Women who did not give birth in the past 12 months
| Now married: | 14.6% (9) |
| Unmarried: | 85.4% (51) |
Marital status - Asian population 15 years and over
- Males
- 69.0%Never married
- 31.0%Now married
- 0.0%Separated
- 0.0%Widowed
- 0.0%Divorced
- Females
- 12.6%Never married
- 67.8%Now married
- 0.0%Separated
- 19.5%Widowed
- 0.0%Divorced
Women who did not give birth in the past 12 months
| Now married: | 64.5% (22) |
| Unmarried: | 35.5% (12) |
Marital status - Other race population 15 years and over
- Males
- 68.4%Never married
- 31.6%Now married
- 0.0%Separated
- 0.0%Widowed
- 0.0%Divorced
- Females
- 25.6%Never married
- 74.4%Now married
- 0.0%Separated
- 0.0%Widowed
- 0.0%Divorced
Women who did not give birth in the past 12 months
| Now married: | 74.3% (95) |
| Unmarried: | 25.7% (33) |
Marital status - Two or more races population 15 years and over
- Males
- 41.7%Never married
- 30.8%Now married
- 5.6%Separated
- 0.0%Widowed
- 21.9%Divorced
- Females
- 28.0%Never married
- 52.0%Now married
- 10.8%Separated
- 4.0%Widowed
- 5.2%Divorced
Women who did not give birth in the past 12 months
| Now married: | 62.7% (577) |
| Unmarried: | 37.3% (343) |
Marital status - White alone, not Hispanic / Latino population 15 years and over
- Males
- 29.5%Never married
- 50.9%Now married
- 1.9%Separated
- 4.2%Widowed
- 13.4%Divorced
- Females
- 17.7%Never married
- 44.5%Now married
- 1.8%Separated
- 15.8%Widowed
- 20.1%Divorced
Women who gave birth in the past 12 months
| Now married: | 18.1% (27) |
| Unmarried: | 81.9% (121) |
Women who did not give birth in the past 12 months
| Now married: | 48.1% (1,212) |
| Unmarried: | 51.9% (1,309) |
Marital status - Hispanic or Latino population 15 years and over
- Males
- 42.8%Never married
- 38.9%Now married
- 3.4%Separated
- 0.5%Widowed
- 14.5%Divorced
- Females
- 50.4%Never married
- 31.2%Now married
- 8.8%Separated
- 5.7%Widowed
- 3.9%Divorced
Women who gave birth in the past 12 months
| Now married: | 0.0% (0) |
| Unmarried: | 100.0% (27) |
Women who did not give birth in the past 12 months
| Now married: | 38.0% (212) |
| Unmarried: | 62.0% (347) |
Ancestries in Paradise

- 1,82318.3%American
- 1,30813.1%European
- 7347.4%English
- 6756.8%German
- 5015.0%Irish
- 3343.3%Italian
- 2392.4%Scottish
- 1681.7%Norwegian
- 1671.7%Hungarian
- 940.9%Polish
- 890.9%Northern European
- 890.9%Swedish
- 830.8%Dutch
- 800.8%Portuguese
- 760.8%French
- 740.7%Scandinavian
- 520.5%Scotch-Irish
- 480.5%Canadian
- 480.5%Swiss
- 410.4%Finnish
- 280.3%Lithuanian
- 280.3%Welsh
- 230.2%Eastern European
- 190.2%British
- 190.2%Yugoslavian
- 180.2%Czech
- 180.2%French Canadian
- 180.2%Russian
- 180.2%Ukrainian
- 160.2%Romanian
- 150.2%Celtic
- 120.1%Greek
- 110.1%Austrian
- 110.1%Danish
- 90.09%Belgian
- 20.02%Basque

Geographical mobility in Paradise

- Same house 1 year ago
- 14,23788.0%White (Caucasian)
- 4658.2%Black or African American
- 23786.9%American Indian / Alaska Native
- 22690.5%Asian
- 1100.0%Native Hawaiian / Pacific Islander
- 38590.3%Other race
- 2,63677.6%Two or more races
- 15,88389.3%White alone, not Hispanic / Latino
- 1,23369.2%Hispanic or Latino

-
- Moved within same county
- 1,1817.3%White / Caucasian
- 2228.0%Black or African American
- 82.8%American Indian / Alaska Native
- 41.5%Asian
- 204.7%Other race
- 44013.0%Two or more races
- 1,2397.0%White alone, not Hispanic / Latino
- 30317.0%Hispanic or Latino

-
- Moved within same state
- 5183.2%White / Caucasian
- 67.7%Black or African American
- 3412.3%American Indian / Alaska Native
- 2610.4%Asian
- 102.3%Other race
- 1835.4%Two or more races
- 4092.3%White alone, not Hispanic / Latino
- 20011.2%Hispanic or Latino

-
- Moved from different state
- 2441.5%White / Caucasian
- 2781.6%White alone, not Hispanic / Latino

-
- Moved from abroad
- 10.0%White
- 10.3%Other race
- 10.0%White alone, not Hispanic / Latino
- 10.1%Hispanic or Latino

Children Nativity (place of birth) in Paradise
Place of birth for residents in Paradise
![Place of birth for the foreign-born population - Regions]()
- 255Americas
- 167Latin America
- 142Central America
- 137Asia
- 134Europe
- 99Eastern Asia
- 88Northern America
- 70Eastern Europe
- 44China
- 38South Eastern Asia
- 33Western Europe
- 30Northern Europe
- 24South America
- 15Africa
- 15Northern Africa

![Place of birth for the foreign-born population - Countries]()
- 136Mexico
- 88Canada
- 44China
- 38Philippines
- 33Japan
- 22Russia
- 21Korea
- 19Netherlands
- 19Ukraine
- 15Denmark
- 15Hungary
- 15Sudan
- 14Germany
- 14Poland
- 12Colombia
- 12Peru
- 6Honduras

Grandparents responsible for own grandchildren in Paradise
Zip codes: 95969.