Races in Port St. John, Florida (FL) Detailed Stats
Data:
Races - White alone (%)
Races - White alone (% change since 2000)
Races - Black alone (%)
Races - Black alone (% change since 2000)
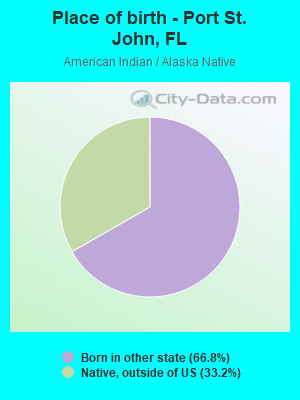
Races - American Indian alone (%)
Races - American Indian alone (% change since 2000)
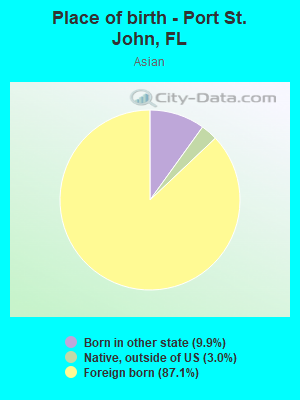
Races - Asian alone (%)
Races - Asian alone (% change since 2000)
Races - Hispanic (%)
Races - Hispanic (% change since 2000)
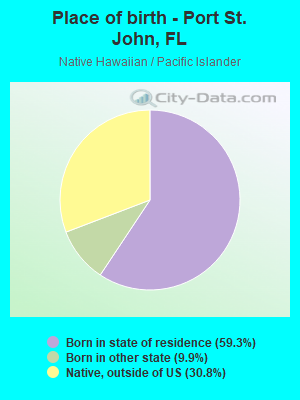
Races - Native Hawaiian and Other Pacific Islander alone (%)
Races - Native Hawaiian and Other Pacific Islander alone (% change since 2000)
Races - Two or more races(%)
Races - Two or more races(% change since 2000)
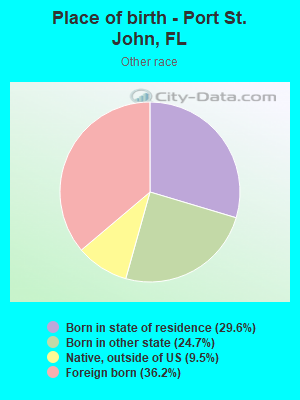
Races - Other race alone (%)
Races - Other race alone (% change since 2000)
Racial diversity
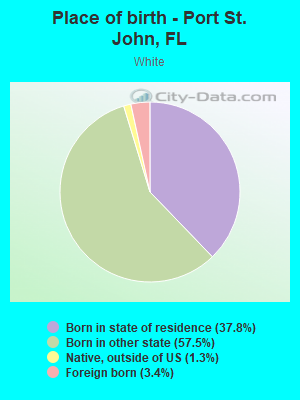
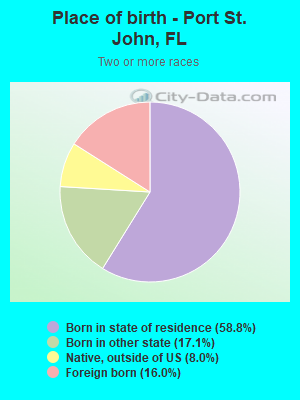
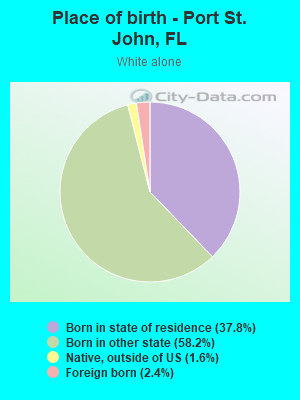
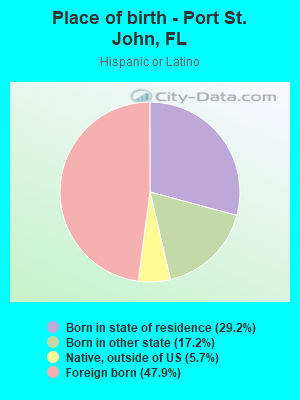
Place of birth - Born in state of residence (%)
Place of birth - Born in state of residence (%) - White
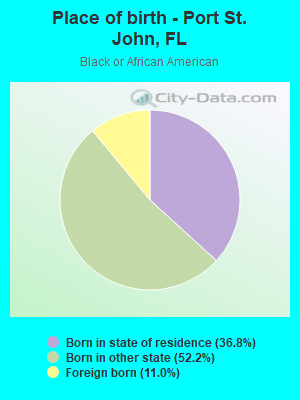
Place of birth - Born in state of residence (%) - Black or African American
Place of birth - Born in state of residence (%) - Asian
Place of birth - Born in state of residence (%) - Hispanic or Latino
Place of birth - Born in state of residence (%) - American Indian and Alaska Native
Place of birth - Born in state of residence (%) - Multirace
Place of birth - Born in state of residence (%) - Other Race
Place of birth - Born in other state (%)
Place of birth - Born in other state (%) - White
Place of birth - Born in other state (%) - Black or African American
Place of birth - Born in other state (%) - Asian
Place of birth - Born in other state (%) - Hispanic or Latino
Place of birth - Born in other state (%) - American Indian and Alaska Native
Place of birth - Born in other state (%) - Multirace
Place of birth - Born in other state (%) - Other Race
Place of birth - Native, outside of US (%)
Place of birth - Native, outside of US (%) - White
Place of birth - Native, outside of US (%) - Black or African American
Place of birth - Native, outside of US (%) - Asian
Place of birth - Native, outside of US (%) - Hispanic or Latino
Place of birth - Native, outside of US (%) - American Indian and Alaska Native
Place of birth - Native, outside of US (%) - Multirace
Place of birth - Native, outside of US (%) - Other Race
Place of birth - Foreign born (%)
Place of birth - Foreign born (%) - White
Place of birth - Foreign born (%) - Black or African American
Place of birth - Foreign born (%) - Asian
Place of birth - Foreign born (%) - Hispanic or Latino
Place of birth - Foreign born (%) - American Indian and Alaska Native
Place of birth - Foreign born (%) - Multirace
Place of birth - Foreign born (%) - Other Race
Residents speaking English at home (%)
Residents speaking English at home - Born in the United States (%)
Residents speaking English at home - Native, born elsewhere (%)
Residents speaking English at home - Foreign born (%)
Residents speaking Spanish at home (%)
Residents speaking Spanish at home - Born in the United States (%)
Residents speaking Spanish at home - Native, born elsewhere (%)
Residents speaking Spanish at home - Foreign born (%)
Residents speaking other language at home (%)
Residents speaking other language at home - Born in the United States (%)
Residents speaking other language at home - Native, born elsewhere (%)
Residents speaking other language at home - Foreign born (%)
Marital status - Never married (%)
Marital status - Now married (%)
Marital status - Separated (%)
Marital status - Widowed (%)
Marital status - Divorced (%)
Ancestries Reported - Arab (%)
Ancestries Reported - Czech (%)
Ancestries Reported - Danish (%)
Ancestries Reported - Dutch (%)
Ancestries Reported - English (%)
Ancestries Reported - French (%)
Ancestries Reported - French Canadian (%)
Ancestries Reported - German (%)
Ancestries Reported - Greek (%)
Ancestries Reported - Hungarian (%)
Ancestries Reported - Irish (%)
Ancestries Reported - Italian (%)
Ancestries Reported - Lithuanian (%)
Ancestries Reported - Norwegian (%)
Ancestries Reported - Polish (%)
Ancestries Reported - Portuguese (%)
Ancestries Reported - Russian (%)
Ancestries Reported - Scotch-Irish (%)
Ancestries Reported - Scottish (%)
Ancestries Reported - Slovak (%)
Ancestries Reported - Subsaharan African (%)
Ancestries Reported - Swedish (%)
Ancestries Reported - Swiss (%)
Ancestries Reported - Ukrainian (%)
Ancestries Reported - United States (%)
Ancestries Reported - Welsh (%)
Ancestries Reported - West Indian (%)
Ancestries Reported - Other (%)
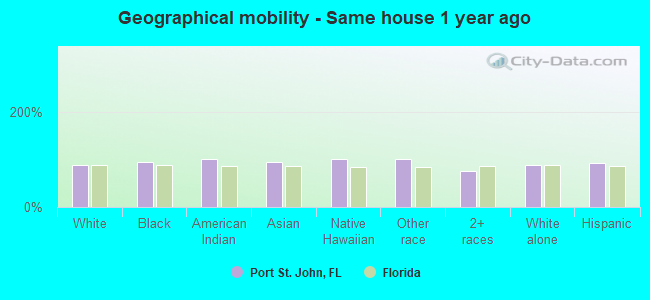
Geographical mobility - Same house 1 year ago (%)
Geographical mobility - Same house 1 year ago (%) - White
Geographical mobility - Same house 1 year ago (%) - Black or African American
Geographical mobility - Same house 1 year ago (%) - Asian
Geographical mobility - Same house 1 year ago (%) - Hispanic or Latino
Geographical mobility - Same house 1 year ago (%) - American Indian and Alaska Native
Geographical mobility - Same house 1 year ago (%) - Multirace
Geographical mobility - Same house 1 year ago (%) - Other Race
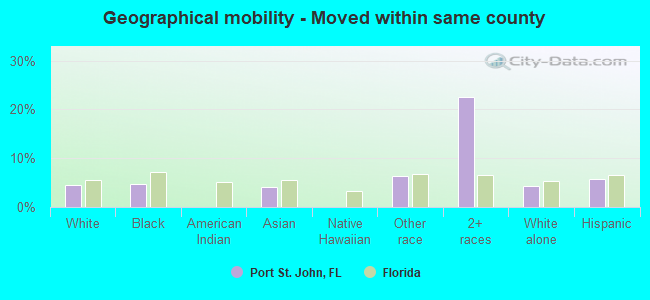
Geographical mobility - Moved within same county (%)
Geographical mobility - Moved within same county (%) - White
Geographical mobility - Moved within same county (%) - Black or African American
Geographical mobility - Moved within same county (%) - Asian
Geographical mobility - Moved within same county (%) - Hispanic or Latino
Geographical mobility - Moved within same county (%) - American Indian and Alaska Native
Geographical mobility - Moved within same county (%) - Multirace
Geographical mobility - Moved within same county (%) - Other Race
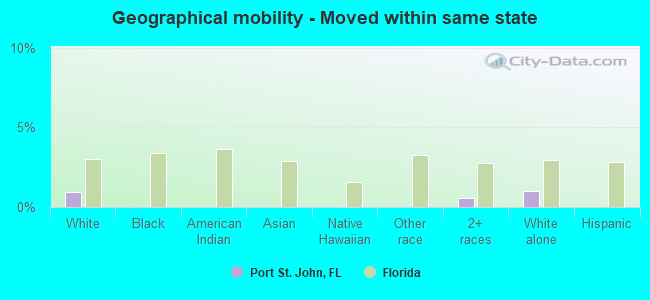
Geographical mobility - Moved from different county within same state (%)
Geographical mobility - Moved from different county within same state (%) - White
Geographical mobility - Moved from different county within same state (%) - Black or African American
Geographical mobility - Moved from different county within same state (%) - Asian
Geographical mobility - Moved from different county within same state (%) - Hispanic or Latino
Geographical mobility - Moved from different county within same state (%) - American Indian and Alaska Native
Geographical mobility - Moved from different county within same state (%) - Multirace
Geographical mobility - Moved from different county within same state (%) - Other Race
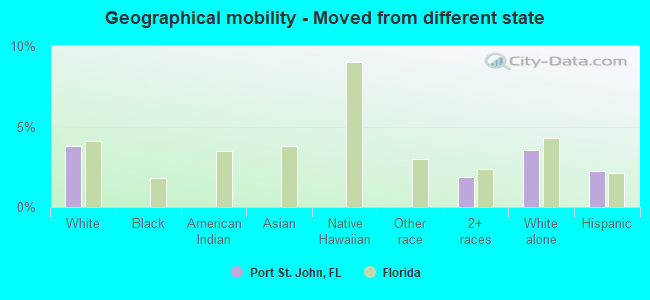
Geographical mobility - Moved from different state (%)
Geographical mobility - Moved from different state (%) - White
Geographical mobility - Moved from different state (%) - Black or African American
Geographical mobility - Moved from different state (%) - Asian
Geographical mobility - Moved from different state (%) - Hispanic or Latino
Geographical mobility - Moved from different state (%) - American Indian and Alaska Native
Geographical mobility - Moved from different state (%) - Multirace
Geographical mobility - Moved from different state (%) - Other Race
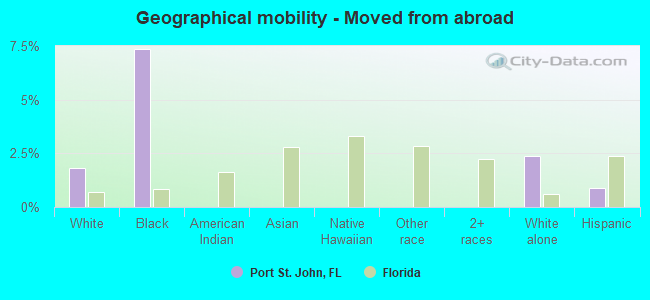
Geographical mobility - Moved from abroad (%)
Geographical mobility - Moved from abroad (%) - White
Geographical mobility - Moved from abroad (%) - Black or African American
Geographical mobility - Moved from abroad (%) - Asian
Geographical mobility - Moved from abroad (%) - Hispanic or Latino
Geographical mobility - Moved from abroad (%) - American Indian and Alaska Native
Geographical mobility - Moved from abroad (%) - Multirace
Geographical mobility - Moved from abroad (%) - Other Race
Place of birth for the foreign-born population - Ireland (%)
Place of birth for the foreign-born population - Denmark (%)
Place of birth for the foreign-born population - Norway (%)
Place of birth for the foreign-born population - Sweden (%)
Place of birth for the foreign-born population - United Kingdom (%)
Place of birth for the foreign-born population - England (%)
Place of birth for the foreign-born population - Scotland (%)
Place of birth for the foreign-born population - Other Northern Europe (%)
Place of birth for the foreign-born population - Austria (%)
Place of birth for the foreign-born population - Belgium (%)
Place of birth for the foreign-born population - France (%)
Place of birth for the foreign-born population - Germany (%)
Place of birth for the foreign-born population - Netherlands (%)
Place of birth for the foreign-born population - Switzerland (%)
Place of birth for the foreign-born population - Other Western Europe (%)
Place of birth for the foreign-born population - Greece (%)
Place of birth for the foreign-born population - Italy (%)
Place of birth for the foreign-born population - Portugal (%)
Place of birth for the foreign-born population - Spain (%)
Place of birth for the foreign-born population - Other Southern Europe (%)
Place of birth for the foreign-born population - Albania (%)
Place of birth for the foreign-born population - Belarus (%)
Place of birth for the foreign-born population - Bosnia and Herzegovina (%)
Place of birth for the foreign-born population - Bulgaria (%)
Place of birth for the foreign-born population - Croatia (%)
Place of birth for the foreign-born population - Czechoslovakia (%)
Place of birth for the foreign-born population - Hungary (%)
Place of birth for the foreign-born population - Latvia (%)
Place of birth for the foreign-born population - Lithuania (%)
Place of birth for the foreign-born population - North Macedonia (Macedonia) (%)
Place of birth for the foreign-born population - Moldova (%)
Place of birth for the foreign-born population - Poland (%)
Place of birth for the foreign-born population - Romania (%)
Place of birth for the foreign-born population - Russia (%)
Place of birth for the foreign-born population - Serbia (%)
Place of birth for the foreign-born population - Ukraine (%)
Place of birth for the foreign-born population - Other Eastern Europe (%)
Place of birth for the foreign-born population - China (%)
Place of birth for the foreign-born population - Hong Kong (%)
Place of birth for the foreign-born population - Taiwan (%)
Place of birth for the foreign-born population - Japan (%)
Place of birth for the foreign-born population - Korea (%)
Place of birth for the foreign-born population - Other Eastern Asia (%)
Place of birth for the foreign-born population - Afghanistan (%)
Place of birth for the foreign-born population - Bangladesh (%)
Place of birth for the foreign-born population - India (%)
Place of birth for the foreign-born population - Iran (%)
Place of birth for the foreign-born population - Kazakhstan (%)
Place of birth for the foreign-born population - Nepal (%)
Place of birth for the foreign-born population - Pakistan (%)
Place of birth for the foreign-born population - Sri Lanka (%)
Place of birth for the foreign-born population - Uzbekistan (%)
Place of birth for the foreign-born population - Other South Central Asia (%)
Place of birth for the foreign-born population - Burma (%)
Place of birth for the foreign-born population - Cambodia (%)
Place of birth for the foreign-born population - Indonesia (%)
Place of birth for the foreign-born population - Laos (%)
Place of birth for the foreign-born population - Malaysia (%)
Place of birth for the foreign-born population - Philippines (%)
Place of birth for the foreign-born population - Singapore (%)
Place of birth for the foreign-born population - Thailand (%)
Place of birth for the foreign-born population - Vietnam (%)
Place of birth for the foreign-born population - Other South Eastern Asia (%)
Place of birth for the foreign-born population - Armenia (%)
Place of birth for the foreign-born population - Iraq (%)
Place of birth for the foreign-born population - Israel (%)
Place of birth for the foreign-born population - Jordan (%)
Place of birth for the foreign-born population - Kuwait (%)
Place of birth for the foreign-born population - Lebanon (%)
Place of birth for the foreign-born population - Saudi Arabia (%)
Place of birth for the foreign-born population - Syria (%)
Place of birth for the foreign-born population - Turkey (%)
Place of birth for the foreign-born population - Yemen (%)
Place of birth for the foreign-born population - Other Western Asia (%)
Place of birth for the foreign-born population - Eritrea (%)
Place of birth for the foreign-born population - Ethiopia (%)
Place of birth for the foreign-born population - Kenya (%)
Place of birth for the foreign-born population - Somalia (%)
Place of birth for the foreign-born population - Uganda (%)
Place of birth for the foreign-born population - Zimbabwe (%)
Place of birth for the foreign-born population - Other Eastern Africa (%)
Place of birth for the foreign-born population - Cameroon (%)
Place of birth for the foreign-born population - Congo (%)
Place of birth for the foreign-born population - Democratic Republic of Congo (Zaire) (%)
Place of birth for the foreign-born population - Other Middle Africa (%)
Place of birth for the foreign-born population - Egypt (%)
Place of birth for the foreign-born population - Morocco (%)
Place of birth for the foreign-born population - Sudan (%)
Place of birth for the foreign-born population - Other Northern Africa (%)
Place of birth for the foreign-born population - South Africa (%)
Place of birth for the foreign-born population - Other Southern Africa (%)
Place of birth for the foreign-born population - Cabo Verde (%)
Place of birth for the foreign-born population - Ghana (%)
Place of birth for the foreign-born population - Liberia (%)
Place of birth for the foreign-born population - Nigeria (%)
Place of birth for the foreign-born population - Senegal (%)
Place of birth for the foreign-born population - Sierra Leone (%)
Place of birth for the foreign-born population - Other Western Africa (%)
Place of birth for the foreign-born population - Australia (%)
Place of birth for the foreign-born population - New Zealand (%)
Place of birth for the foreign-born population - Fiji (%)
Place of birth for the foreign-born population - Micronesia (%)
Place of birth for the foreign-born population - Bahamas (%)
Place of birth for the foreign-born population - Barbados (%)
Place of birth for the foreign-born population - Cuba (%)
Place of birth for the foreign-born population - Dominica (%)
Place of birth for the foreign-born population - Dominican Republic (%)
Place of birth for the foreign-born population - Grenada (%)
Place of birth for the foreign-born population - Haiti (%)
Place of birth for the foreign-born population - Jamaica (%)
Place of birth for the foreign-born population - St. Vincent and the Grenadines (%)
Place of birth for the foreign-born population - Trinidad and Tobago (%)
Place of birth for the foreign-born population - West Indies (%)
Place of birth for the foreign-born population - Other Caribbean (%)
Place of birth for the foreign-born population - Belize (%)
Place of birth for the foreign-born population - Costa Rica (%)
Place of birth for the foreign-born population - El Salvador (%)
Place of birth for the foreign-born population - Guatemala (%)
Place of birth for the foreign-born population - Honduras (%)
Place of birth for the foreign-born population - Mexico (%)
Place of birth for the foreign-born population - Nicaragua (%)
Place of birth for the foreign-born population - Panama (%)
Place of birth for the foreign-born population - Other Central America (%)
Place of birth for the foreign-born population - Argentina (%)
Place of birth for the foreign-born population - Bolivia (%)
Place of birth for the foreign-born population - Brazil (%)
Place of birth for the foreign-born population - Chile (%)
Place of birth for the foreign-born population - Colombia (%)
Place of birth for the foreign-born population - Ecuador (%)
Place of birth for the foreign-born population - Guyana (%)
Place of birth for the foreign-born population - Peru (%)
Place of birth for the foreign-born population - Uruguay (%)
Place of birth for the foreign-born population - Venezuela (%)
Place of birth for the foreign-born population - Other South America (%)
Place of birth for the foreign-born population - Canada (%)
Place of birth for the foreign-born population - Other Northern America (%)
Place of birth for the foreign-born population - Other (%)
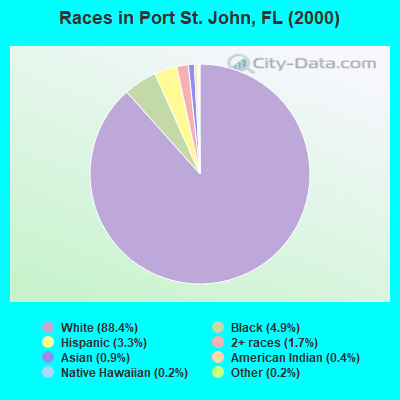
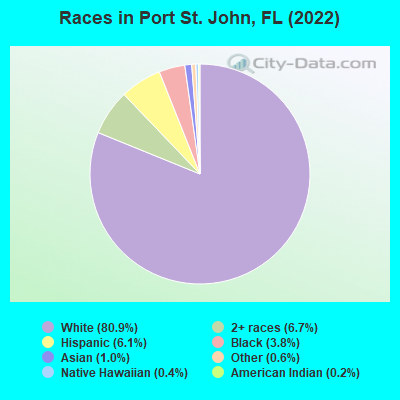
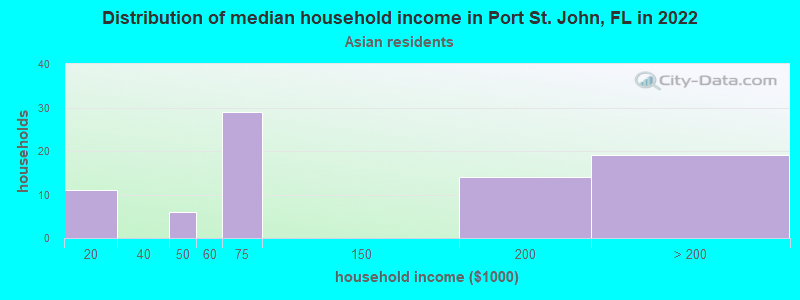
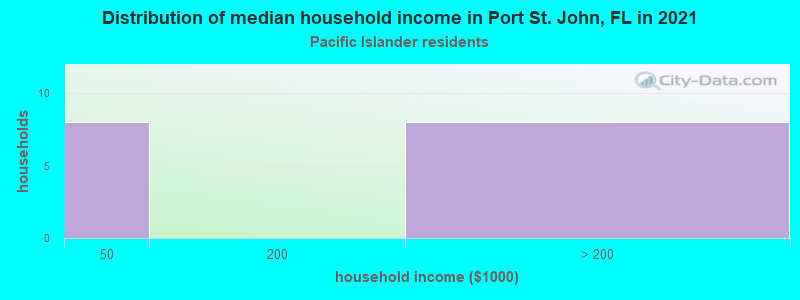
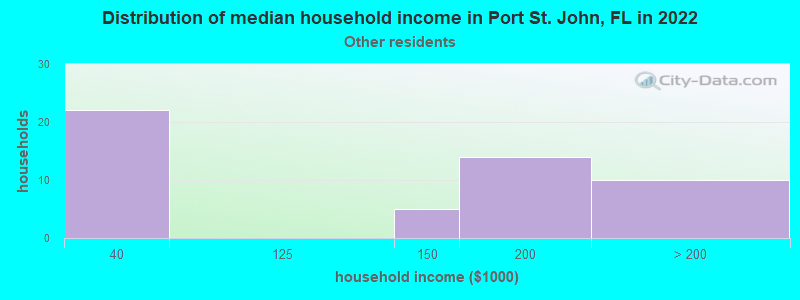
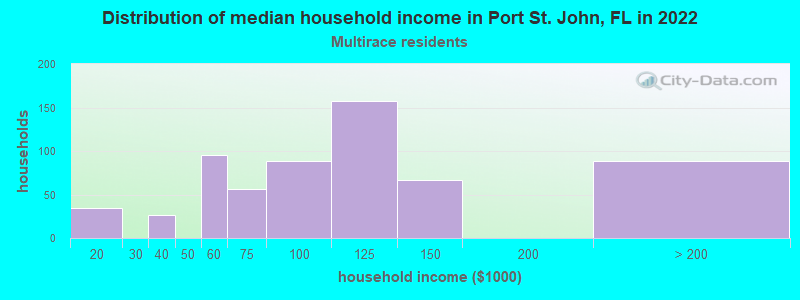
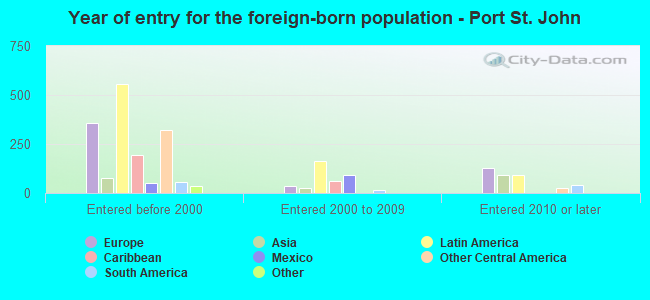
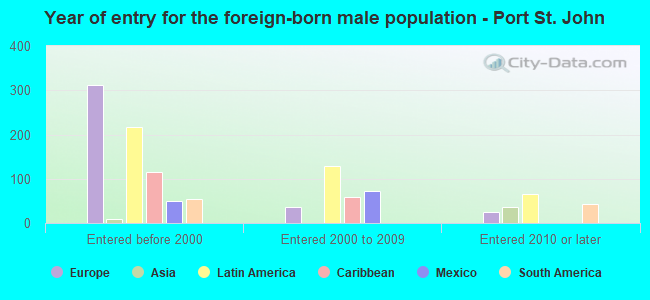
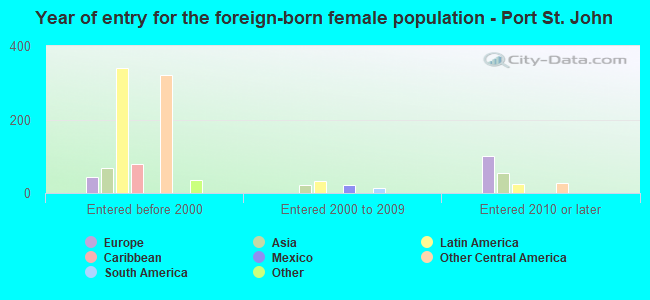
According to 2022 data, the most numerous races in Port St. John, FL are White alone (20,361 residents), Hispanic (1,539 residents), and Black alone (945 residents). 92.8% of Port St. John residents speak English at home. 6.0% of Port St. John, FL residents are foreign-born (3.3% born in Latin America, 1.7% born in Europe, 0.7% born in Asia), which is 248.3% less than the foreign-born rate of 21.0% across the entire state of Florida.
Race distribution in Port St. John
2000 2022
10,458,509 65.4% White alone 2,682,715 16.8% Hispanic 2,264,268 14.2% Black alone 261,693 1.6% Asian alone 236,954 1.5% Two or more races 42,358 0.3% American Indian alone 28,994 0.2% Other race alone 6,887 0.04% Native Hawaiian and Other
11,309,403 50.8% White alone 6,025,039 27.1% Hispanic 3,241,015 14.6% Black alone 861,630 3.9% Two or more races 623,692 2.8% Asian alone 152,054 0.7% Other race alone 22,504 0.1% American Indian alone 9,486 0.04% Native Hawaiian and Other
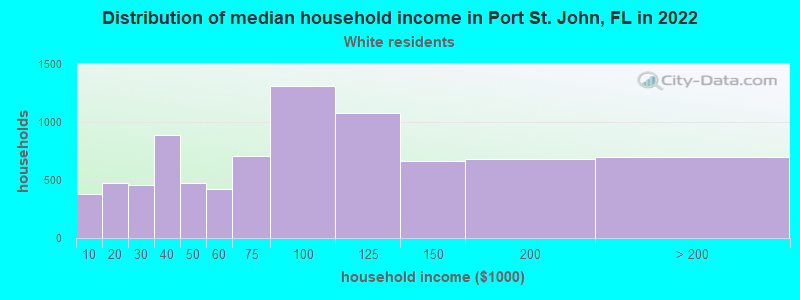
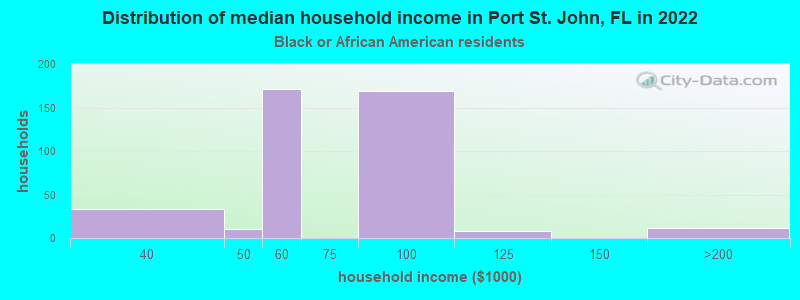
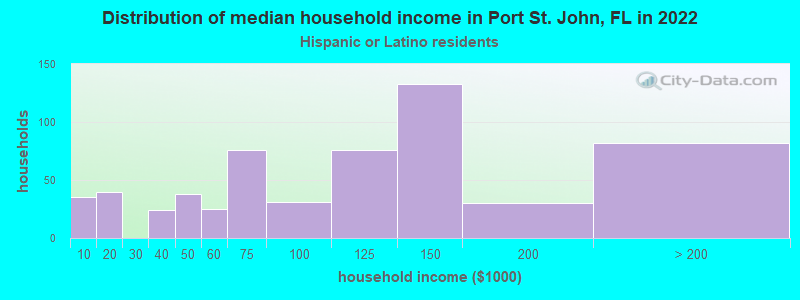
Income and house value in Port St. John Median household income in 2022 $81,256 White non-Hispanic householders$86,658 Black householders$106,587 Two or more races householders$104,398 Hispanic or Latino race householdersMedian 2022 house value $287,010 White Non-Hispanic householders$295,013 Black or African American householders$361,218 American Indian or Alaska Native householders $324,478 Asian householders$260,091 Some other race householders$275,369 Two or more races householders$296,104 Hispanic or Latino householders
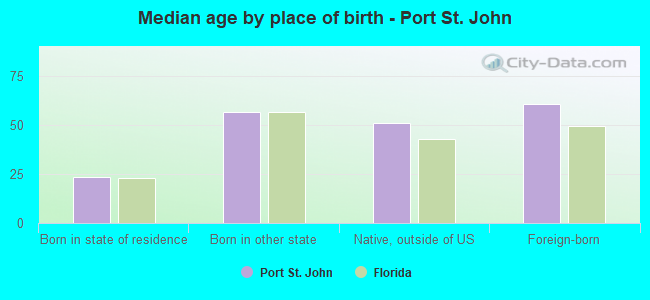
Median age by race in Port St. John
46.2 Median age for White residents45.3 48.9 44.8 Median age for Black or African American residents43.0 46.5 -598,566,307.6 Median age for American Indian / Alaska Native residents-611,418,047.3 -594,925,633.7 51.1 Median age for Asian residents45.0 51.9 43.1 Median age for Native Hawaiian / Pacific Islander residents25.0 -443,298,968.6 34.8 Median age for Other race residents39.0 33.6 21.0 Median age for Two or more races residents27.2 21.1 45.7 Median age for White alone residents45.3 46.4 54.8 Median age for Hispanic or Latino residents36.7 57.7
Owner/renter occupied households by race in Port St. John
House owners and renters - White residents 7,626 92.6% Owner occupied613 7.4% Renter occupiedHouse owners and renters - Black or African American residents 321 94.8% Owner occupied18 5.2% Renter occupiedHouse owners and renters - American Indian / Alaska Native residents 37 100.0% Owner occupiedHouse owners and renters - Asian residents 38 53.5% Owner occupied33 46.5% Renter occupiedHouse owners and renters - Native Hawaiian / Pacific Islander residents 18 100.0% Owner occupiedHouse owners and renters - Other race residents 44 75.6% Owner occupied14 24.4% Renter occupiedHouse owners and renters - Two or more races residents 452 71.4% Owner occupied181 28.6% Renter occupiedHouse owners and renters - White alone residents 7,463 92.2% Owner occupied632 7.8% Renter occupiedHouse owners and renters - Hispanic or Latino residents 494 90.1% Owner occupied54 9.9% Renter occupied
Language usage in Port St. John
English speakers - Total 92.8% of residents of Port St. John speak English at home.
3.9% of residents speak Spanish at home 535 56.0% Speak English very well421 44.0% Speak English less than very well3.2% of residents speak other language at home 565 73.0% Speak English very well209 27.0% Speak English less than very well
English speakers - Born in the United States 98.1% of residents of Port St. John speak English at home.
1.0% of residents speak Spanish at home 124 91.9% Speak English very well11 8.1% Speak English less than very well0.8% of residents speak other language at home 33 32.0% Speak English very well70 68.0% Speak English less than very well
English speakers - Native, born elsewhere 70.8% of residents of Port St. John speak English at home.
13.9% of residents speak Spanish at home 29 35.4% Speak English very well53 64.6% Speak English less than very well17.8% of residents speak other language at home 105 100.0% Speak English very well
English speakers - Foreign-born 27.9% of residents of Port St. John speak English at home.
43.4% of residents speak Spanish at home 381 54.2% Speak English very well322 45.8% Speak English less than very well31.7% of residents speak other language at home 404 78.6% Speak English very well110 21.4% Speak English less than very well
White (Caucasian) - Speak only English Native:
99.5% (19,383)Foreign-born:
18.2% (128)
White (Caucasian) - Speak another language Native:
1.3% (244)Foreign-born:
75.2% (531)
Black or African American - Speak only English Native:
99.8% (790)Foreign-born:
92.1% (97)
Asian - Speak another language Native:
100.0% (33)Foreign-born:
65.5% (160)
Other race - Speak only English Native:
46.4% (110)Foreign-born:
16.8% (24)
Other race - Speak another language Native:
50.4% (119)Foreign-born:
76.3% (108)
Two or more races - Speak only English Native:
93.4% (1,574)Foreign-born:
45.1% (179)
Two or more races - Speak another language Native:
6.3% (107)Foreign-born:
58.2% (230)
White alone - Speak only English Native:
99.0% (19,102)Foreign-born:
26.1% (128)
White alone - Speak another language Native:
1.1% (204)Foreign-born:
72.5% (354)
Hispanic or Latino - Speak only English Native:
74.7% (568)Foreign-born:
18.2% (145)
Hispanic or Latino - Speak another language Native:
26.6% (203)Foreign-born:
81.2% (645)
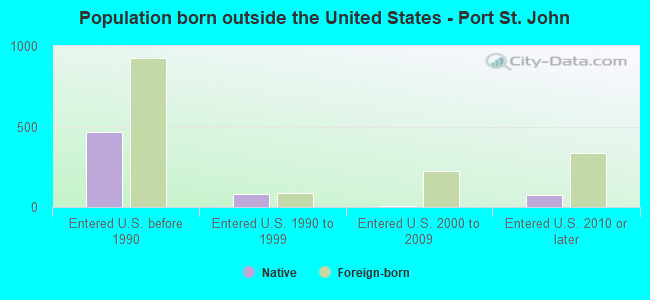
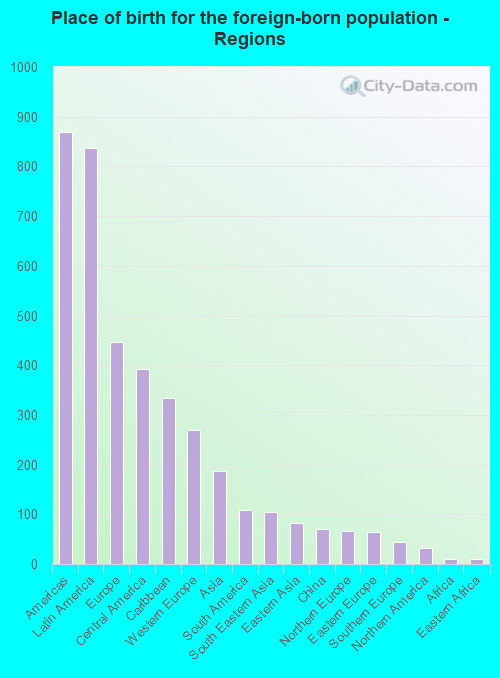
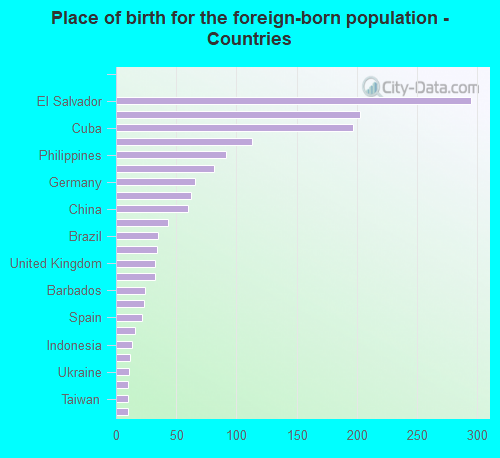
Foreign-born residents in Port St. John 1,517 residents are foreign born (3.3% Latin America , 1.7% Europe , 0.7% Asia ).
This city:
6.0%Florida:
21.1%
Marital status for residents in Port St. John Marital status - White (Caucasian) population 15 years and over
Males 30.5% Never married55.9% Now married0.4% Separated4.3% Widowed8.9% DivorcedFemales 25.7% Never married53.9% Now married0.8% Separated8.5% Widowed11.2% DivorcedWomen who gave birth in the past 12 months Now married:
55.4% (89)Unmarried:
44.6% (71)
Women who did not give birth in the past 12 months Now married:
41.6% (1,748)Unmarried:
58.4% (2,459)
Marital status - Black or African American population 15 years and over
Males 37.6% Never married53.3% Now married0.0% Separated0.0% Widowed9.1% DivorcedFemales 20.8% Never married48.9% Now married0.0% Separated0.0% Widowed30.4% DivorcedWomen who did not give birth in the past 12 months Now married:
42.3% (109)Unmarried:
57.7% (149)
Marital status - Asian population 15 years and over
Males 40.2% Never married59.8% Now married0.0% Separated0.0% Widowed0.0% DivorcedFemales 20.1% Never married34.4% Now married0.0% Separated11.0% Widowed34.4% DivorcedWomen who did not give birth in the past 12 months Now married:
26.1% (26)Unmarried:
73.9% (74)
Marital status - Native Hawaiian / Pacific Islander population 15 years and over
Males 55.9% Never married44.1% Now married0.0% Separated0.0% Widowed0.0% DivorcedFemales 0.0% Never married100.0% Now married0.0% Separated0.0% Widowed0.0% DivorcedMarital status - Other race population 15 years and over
Males 58.6% Never married27.3% Now married0.0% Separated0.0% Widowed14.1% DivorcedFemales 34.7% Never married65.3% Now married0.0% Separated0.0% Widowed0.0% DivorcedWomen who gave birth in the past 12 months Now married:
100.0% (12)Unmarried:
0.0% (0)
Women who did not give birth in the past 12 months Now married:
24.4% (14)Unmarried:
75.6% (44)
Marital status - Two or more races population 15 years and over
Males 32.5% Never married56.5% Now married5.2% Separated4.3% Widowed1.4% DivorcedFemales 63.1% Never married32.9% Now married4.0% Separated0.0% Widowed0.0% DivorcedWomen who did not give birth in the past 12 months Now married:
26.4% (182)Unmarried:
73.6% (507)
Marital status - White alone, not Hispanic / Latino population 15 years and over
Males 30.7% Never married55.7% Now married0.4% Separated4.1% Widowed9.2% DivorcedFemales 26.5% Never married52.4% Now married0.8% Separated8.9% Widowed11.3% DivorcedWomen who gave birth in the past 12 months Now married:
55.4% (92)Unmarried:
44.6% (74)
Women who did not give birth in the past 12 months Now married:
41.9% (1,786)Unmarried:
58.1% (2,474)
Marital status - Hispanic or Latino population 15 years and over
Males 22.9% Never married63.3% Now married1.9% Separated8.8% Widowed3.1% DivorcedFemales 14.6% Never married78.0% Now married1.6% Separated0.0% Widowed5.8% DivorcedWomen who gave birth in the past 12 months Now married:
100.0% (10)Unmarried:
0.0% (0)
Women who did not give birth in the past 12 months Now married:
33.1% (62)Unmarried:
66.9% (126)
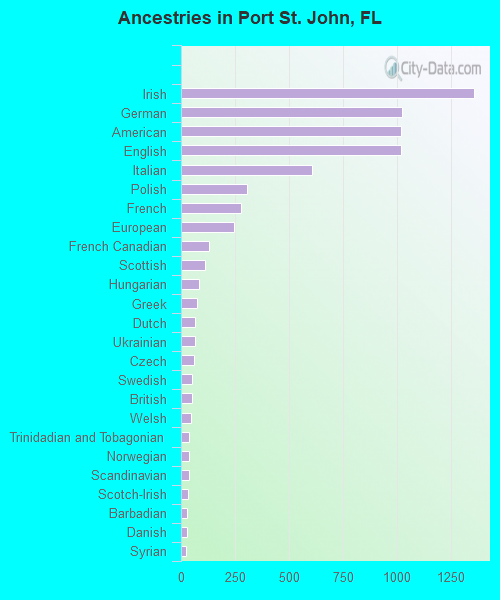
Ancestries in Port St. John
1,359 13.6% Irish1,023 10.2% German1,018 10.2% American1,017 10.2% English608 6.1% Italian304 3.0% Polish279 2.8% French245 2.5% European132 1.3% French Canadian111 1.1% Scottish83 0.8% Hungarian75 0.8% Greek67 0.7% Dutch64 0.6% Ukrainian60 0.6% Czech51 0.5% Swedish49 0.5% British47 0.5% Welsh39 0.4% Trinidadian and Tobagonian38 0.4% Norwegian35 0.4% Scandinavian33 0.3% Scotch-Irish29 0.3% Barbadian26 0.3% Danish23 0.2% Syrian20 0.2% Romanian16 0.2% Macedonian16 0.2% African12 0.1% Russian10 0.1% Belgian8 0.08% Pennsylvania German7 0.07% Finnish3 0.03% Northern European
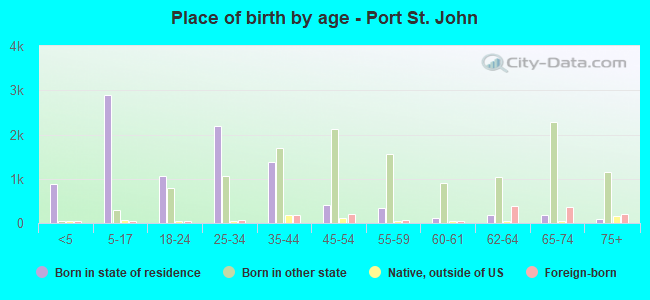
Children Nativity (place of birth) in Port St. John
Children under 6 years - Living with two parents Both parents native 1,000 100.0% NativeOne native, one foreign-born parent 110 100.0% NativeChildren under 6 years - Living with one parent Native parent 387 100.0% NativeChildren 6 to 17 years - Living with two parents Both parents native 1,715 98.7% Native22 1.3% Foreign-bornOne native, one foreign-born parent 77 100.0% NativeChildren 6 to 17 years - Living with one parent Native parent 548 100.0% NativeForeign-born parent 35 52.7% Native31 47.3% Foreign-born
Grandparents responsible for own grandchildren in Port St. John
Grandparents (30 to 59 years) White / Caucasian 57 40.4% Responsible for grandchildren84 59.6% Not responsible for grandchildrenWhite alone, not Hispanic / Latino 43 37.1% Responsible for grandchildren73 62.9% Not responsible for grandchildrenGrandparents (60 years and over) White / Caucasian 194 71.1% Responsible for grandchildren79 28.9% Not responsible for grandchildrenWhite alone, not Hispanic / Latino 173 71.9% Responsible for grandchildren68 28.1% Not responsible for grandchildren