Races in Raleigh Hills, Oregon (OR) Detailed Stats
Ancestries, Foreign-born residents, place of birth
Settings
X


Recent posts about races in Raleigh Hills, Oregon on our local forum with over 2,400,000 registered users:
 | New job in Hillsboro (19 replies) |
| Best areas for 30s couple wanting to start a family? Milwaukie, Tigard, Beaverton, SW hills, Woodstock, etc (15 replies) |
| Please recommend brewpubs (10 replies) |
| Beaverton/Hillsboro vs. Lake Oswego/West Linn (15 replies) |
| Relocating to Portland -- need input on couple areas. (20 replies) |
| Area to purchase a home (28 replies) |
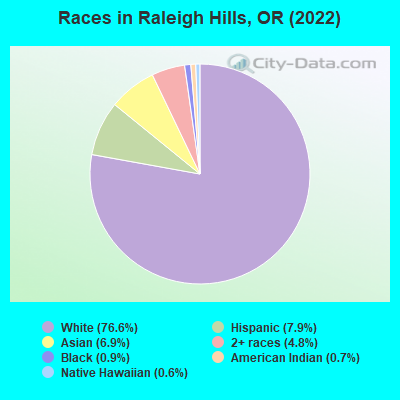
According to 2022 data, the most numerous races in Raleigh Hills, OR are White alone (5,166 residents), Hispanic (534 residents), and Two or more races (322 residents). 85.6% of Raleigh Hills residents speak English at home. 11.1% of Raleigh Hills, OR residents are foreign-born (6.9% born in Asia, 1.3% born in Europe, 1.2% born in Latin America), which is 18.6% greater than the foreign-born rate of 9.0% across the entire state of Oregon.
Race distribution in Raleigh Hills
2000
2022

- 5,16888.1%White alone
- 3375.7%Hispanic
- 1803.1%Asian alone
- 911.6%Two or more races
- 581.0%Black alone
- 130.2%American Indian alone
- 110.2%Native Hawaiian and Other
Pacific Islander alone - 70.1%Other race alone

-
- 5,16676.6%White alone
- 5347.9%Hispanic
- 4656.9%Asian alone
- 3224.8%Two or more races
- 630.9%Black alone
- 500.7%American Indian alone
- 390.6%Native Hawaiian and Other
Pacific Islander alone
2000
2022
-
- 2,857,61683.5%White alone
- 275,3148.0%Hispanic
- 100,3332.9%Asian alone
- 82,7332.4%Two or more races
- 53,3251.6%Black alone
- 40,1301.2%American Indian alone
- 7,3980.2%Native Hawaiian and Other
Pacific Islander alone - 4,5500.1%Other race alone

-
- 3,037,57171.6%White alone
- 609,53814.4%Hispanic
- 252,7446.0%Two or more races
- 191,2834.5%Asian alone
- 78,2281.8%Black alone
- 29,3990.7%American Indian alone
- 25,7310.6%Other race alone
- 15,6430.4%Native Hawaiian and Other
Pacific Islander alone

Income and house value in Raleigh Hills
- Median household income in 2022
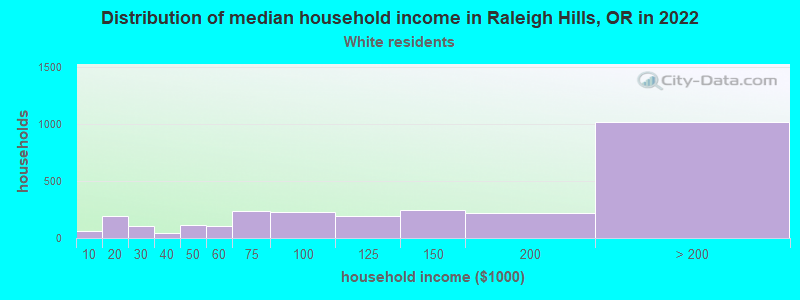
- $133,628White non-Hispanic householders
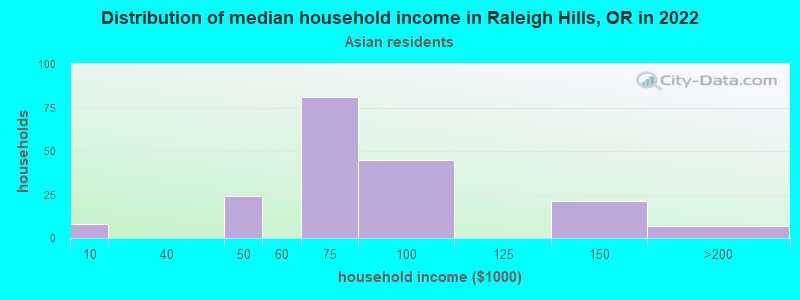
- $72,358Asian householders
- $63,598Two or more races householders
- Median 2022 house value
- $962,510White Non-Hispanic householders
- over $1,000,000Black or African American householders
- over $1,000,000Asian householders
- $676,198Two or more races householders
- $907,095Hispanic or Latino householders
Household income for White non-Hispanic householders
Household income for Asian householders
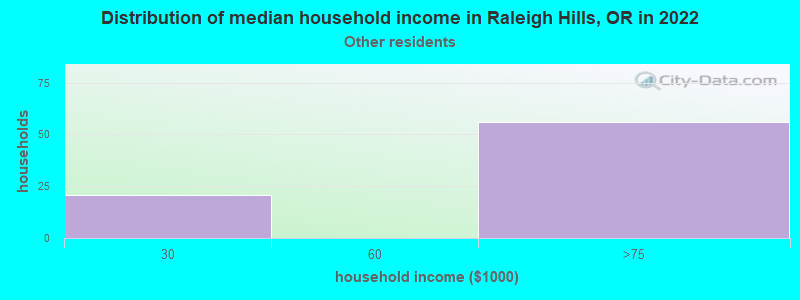
Household income for Some other race householders
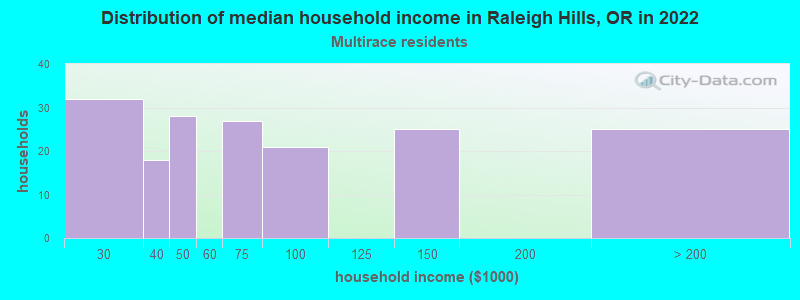
Household income for Two or more races householders
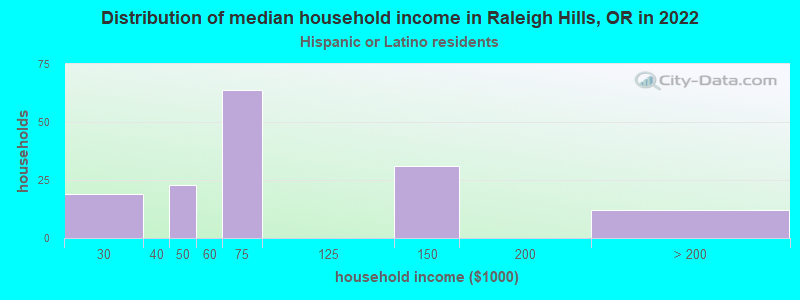
Household income for Hispanic or Latino race householders
Median age by race in Raleigh Hills
- 50.6Median age for White residents
- 49.7Males
- 52.6Females
- 25.9Median age for Black or African American residents
- -707,566,461.5Males
- 50.6Females
- -740,740,740.0Median age for American Indian / Alaska Native residents
- -838,647,342.2Males
- -658,119,657.5Females
- 32.5Median age for Asian residents
- 31.9Males
- 31.6Females
- -642,169,728.1Median age for Native Hawaiian / Pacific Islander residents
- -476,923,076.4Males
- -850,649,349.8Females
- 38.3Median age for Other race residents
- -666,666,666.0Males
- -641,807,909.0Females
- 21.8Median age for Two or more races residents
- 21.5Males
- 23.1Females
- 51.5Median age for White alone residents
- 51.0Males
- 53.2Females
- 44.7Median age for Hispanic or Latino residents
- 14.7Males
- 48.0Females
Owner/renter occupied households by race in Raleigh Hills
- House owners and renters - White residents
- 1,72062.5%Owner occupied
- 1,03137.5%Renter occupied
- House owners and renters - Asian residents
- 2615.2%Owner occupied
- 14484.8%Renter occupied
- House owners and renters - Native Hawaiian / Pacific Islander residents
- 36100.0%Renter occupied
- House owners and renters - Other race residents
- 72100.0%Renter occupied
- House owners and renters - Two or more races residents
- 6033.5%Owner occupied
- 12066.5%Renter occupied
- House owners and renters - White alone residents
- 1,70861.2%Owner occupied
- 1,08338.8%Renter occupied
- House owners and renters - Hispanic or Latino residents
- 7246.8%Owner occupied
- 8153.2%Renter occupied
Language usage in Raleigh Hills
- English speakers - Total
- 85.6% of residents of Raleigh Hills speak English at home.
- 3.0% of residents speak Spanish at home
- 17790.8%Speak English very well
- 189.2%Speak English less than very well
- 10.2% of residents speak other language at home
- 55182.1%Speak English very well
- 12017.9%Speak English less than very well
- English speakers - Born in the United States
- 91.7% of residents of Raleigh Hills speak English at home.
- 4.1% of residents speak Spanish at home
- 10584.0%Speak English very well
- 2016.0%Speak English less than very well
- 3.6% of residents speak other language at home
- 9686.5%Speak English very well
- 1513.5%Speak English less than very well
- English speakers - Native, born elsewhere
- 66.7% of residents of Raleigh Hills speak English at home.
- 52.8% of residents speak other language at home
- 4070.2%Speak English very well
- 1729.8%Speak English less than very well
- English speakers - Foreign-born
- 22.1% of residents of Raleigh Hills speak English at home.
- 12.8% of residents speak Spanish at home
- 95100.0%Speak English very well
- 62.7% of residents speak other language at home
- 36878.8%Speak English very well
- 9921.2%Speak English less than very well
White (Caucasian) - Speak only English
| Native: | 96.7% (4,835) |
| Foreign-born: | 68.1% (97) |
White (Caucasian) - Speak another language
| Native: | 3.5% (174) |
| Foreign-born: | 38.1% (54) |
Asian - Speak only English
| Native: | 39.5% (11) |
| Foreign-born: | 3.7% (16) |
Asian - Speak another language
| Native: | 62.4% (18) |
| Foreign-born: | 98.1% (412) |
Two or more races - Speak only English
| Native: | 96.7% (391) |
| Foreign-born: | 97.3% (64) |
White alone - Speak only English
| Native: | 96.1% (4,680) |
| Foreign-born: | 60.9% (108) |
White alone - Speak another language
| Native: | 4.0% (192) |
| Foreign-born: | 39.6% (70) |
Hispanic or Latino - Speak only English
| Native: | 84.2% (348) |
| Foreign-born: | 18.2% (20) |
Hispanic or Latino - Speak another language
| Native: | 10.3% (43) |
| Foreign-born: | 79.4% (85) |
Foreign-born residents in Raleigh Hills
746 residents are foreign born (6.9% Asia, 1.3% Europe, 1.2% Latin America).
| This city: | 11.1% |
| Oregon: | 9.8% |


Marital status for residents in Raleigh Hills
Marital status - White (Caucasian) population 15 years and over
- Males
- 21.8%Never married
- 66.5%Now married
- 0.3%Separated
- 2.6%Widowed
- 8.8%Divorced
- Females
- 22.2%Never married
- 54.6%Now married
- 0.3%Separated
- 13.3%Widowed
- 9.5%Divorced
Women who gave birth in the past 12 months
| Now married: | 100.0% (56) |
| Unmarried: | 0.0% (0) |
Women who did not give birth in the past 12 months
| Now married: | 63.4% (620) |
| Unmarried: | 36.6% (358) |
Marital status - Black or African American population 15 years and over
- Males
- 100.0%Never married
- 0.0%Now married
- 0.0%Separated
- 0.0%Widowed
- 0.0%Divorced
- Females
- 16.0%Never married
- 0.0%Now married
- 0.0%Separated
- 16.0%Widowed
- 68.0%Divorced
Marital status - Asian population 15 years and over
- Males
- 19.0%Never married
- 81.0%Now married
- 0.0%Separated
- 0.0%Widowed
- 0.0%Divorced
- Females
- 32.0%Never married
- 55.6%Now married
- 0.0%Separated
- 6.2%Widowed
- 6.2%Divorced
Women who gave birth in the past 12 months
| Now married: | 100.0% (42) |
| Unmarried: | 0.0% (0) |
Women who did not give birth in the past 12 months
| Now married: | 48.5% (106) |
| Unmarried: | 51.5% (112) |
Marital status - Other race population 15 years and over
- Males
- 0.0%Never married
- 100.0%Now married
- 0.0%Separated
- 0.0%Widowed
- 0.0%Divorced
- Females
- 39.7%Never married
- 60.3%Now married
- 0.0%Separated
- 0.0%Widowed
- 0.0%Divorced
Women who did not give birth in the past 12 months
| Now married: | 60.3% (48) |
| Unmarried: | 39.7% (31) |
Marital status - Two or more races population 15 years and over
- Males
- 25.9%Never married
- 60.5%Now married
- 0.0%Separated
- 0.0%Widowed
- 13.6%Divorced
- Females
- 44.2%Never married
- 32.0%Now married
- 0.0%Separated
- 0.0%Widowed
- 23.8%Divorced
Women who did not give birth in the past 12 months
| Now married: | 25.2% (39) |
| Unmarried: | 74.8% (116) |
Marital status - White alone, not Hispanic / Latino population 15 years and over
- Males
- 21.9%Never married
- 66.4%Now married
- 0.3%Separated
- 2.6%Widowed
- 8.8%Divorced
- Females
- 23.2%Never married
- 54.4%Now married
- 0.3%Separated
- 12.9%Widowed
- 9.1%Divorced
Women who gave birth in the past 12 months
| Now married: | 100.0% (59) |
| Unmarried: | 0.0% (0) |
Women who did not give birth in the past 12 months
| Now married: | 60.9% (572) |
| Unmarried: | 39.1% (368) |
Marital status - Hispanic or Latino population 15 years and over
- Males
- 0.0%Never married
- 88.9%Now married
- 0.0%Separated
- 0.0%Widowed
- 11.1%Divorced
- Females
- 27.5%Never married
- 52.9%Now married
- 0.0%Separated
- 10.9%Widowed
- 8.7%Divorced
Women who did not give birth in the past 12 months
| Now married: | 61.8% (127) |
| Unmarried: | 38.2% (79) |
Ancestries in Raleigh Hills

- 32711.8%German
- 2729.8%Irish
- 2659.5%Italian
- 2519.0%English
- 2017.2%European
- 1174.2%American
- 853.1%Norwegian
- 792.8%Scottish
- 371.3%Hungarian
- 351.3%Polish
- 230.8%British
- 210.8%Scandinavian
- 200.7%Eastern European
- 190.7%French
- 150.5%Lebanese
- 140.5%Danish
- 130.5%Ukrainian
- 120.4%Swedish
- 100.4%Iranian
- 80.3%Dutch
- 70.3%Northern European
- 50.2%Canadian
- 50.2%Czech
- 50.2%Scotch-Irish
- 30.1%Finnish

Geographical mobility in Raleigh Hills

- Same house 1 year ago
- 4,48486.5%White (Caucasian)
- 2843.6%Black or African American
- 63100.0%American Indian / Alaska Native
- 21345.8%Asian
- 129100.0%Other race
- 31564.2%Two or more races
- 4,42385.8%White alone, not Hispanic / Latino
- 50493.9%Hispanic or Latino

-
- Moved within same county
- 1853.6%White / Caucasian
- 1218.7%Black or African American
- 337.0%Asian
- 448.9%Two or more races
- 1933.8%White alone, not Hispanic / Latino

-
- Moved within same state
- 3737.2%White / Caucasian
- 14230.4%Asian
- 428.5%Two or more races
- 3797.4%White alone, not Hispanic / Latino

-
- Moved from different state
- 1893.6%White / Caucasian
- 367.7%Asian
- 1740.5%Native Hawaiian / Pacific Islander
- 10421.2%Two or more races
- 2013.9%White alone, not Hispanic / Latino
- 6311.7%Hispanic or Latino

-
- Moved from abroad
- 1727.1%Black or African American

Children Nativity (place of birth) in Raleigh Hills
Place of birth for residents in Raleigh Hills
![Place of birth for the foreign-born population - Regions]()
- 477Asia
- 326South Eastern Asia
- 147Americas
- 96South Central Asia
- 92Europe
- 82Latin America
- 75Central America
- 65Northern America
- 63Western Europe
- 54Eastern Asia
- 29Northern Europe
- 28Oceania
- 28Australia and New Zealand Subregion
- 20China
- 7South America

![Place of birth for the foreign-born population - Countries]()
- 226Philippines
- 77Vietnam
- 75Mexico
- 65Canada
- 49India
- 36Germany
- 36Iran
- 33Korea
- 20Netherlands
- 20Hong Kong
- 15England
- 15New Zealand
- 13Australia
- 12Singapore
- 11United Kingdom
- 10Pakistan
- 10Thailand
- 7Peru
- 6France

Grandparents responsible for own grandchildren in Raleigh Hills
Zip codes: 97225.