Races in Richmond, Kentucky (KY) Detailed Stats
Data:
Races - White alone (%)
Races - White alone (% change since 2000)
Races - Black alone (%)
Races - Black alone (% change since 2000)
Races - American Indian alone (%)
Races - American Indian alone (% change since 2000)
Races - Asian alone (%)
Races - Asian alone (% change since 2000)
Races - Hispanic (%)
Races - Hispanic (% change since 2000)
Races - Native Hawaiian and Other Pacific Islander alone (%)
Races - Native Hawaiian and Other Pacific Islander alone (% change since 2000)
Races - Two or more races(%)
Races - Two or more races(% change since 2000)
Races - Other race alone (%)
Races - Other race alone (% change since 2000)
Racial diversity
Place of birth - Born in state of residence (%)
Place of birth - Born in state of residence (%) - White
Place of birth - Born in state of residence (%) - Black or African American
Place of birth - Born in state of residence (%) - Asian
Place of birth - Born in state of residence (%) - Hispanic or Latino
Place of birth - Born in state of residence (%) - American Indian and Alaska Native
Place of birth - Born in state of residence (%) - Multirace
Place of birth - Born in state of residence (%) - Other Race
Place of birth - Born in other state (%)
Place of birth - Born in other state (%) - White
Place of birth - Born in other state (%) - Black or African American
Place of birth - Born in other state (%) - Asian
Place of birth - Born in other state (%) - Hispanic or Latino
Place of birth - Born in other state (%) - American Indian and Alaska Native
Place of birth - Born in other state (%) - Multirace
Place of birth - Born in other state (%) - Other Race
Place of birth - Native, outside of US (%)
Place of birth - Native, outside of US (%) - White
Place of birth - Native, outside of US (%) - Black or African American
Place of birth - Native, outside of US (%) - Asian
Place of birth - Native, outside of US (%) - Hispanic or Latino
Place of birth - Native, outside of US (%) - American Indian and Alaska Native
Place of birth - Native, outside of US (%) - Multirace
Place of birth - Native, outside of US (%) - Other Race
Place of birth - Foreign born (%)
Place of birth - Foreign born (%) - White
Place of birth - Foreign born (%) - Black or African American
Place of birth - Foreign born (%) - Asian
Place of birth - Foreign born (%) - Hispanic or Latino
Place of birth - Foreign born (%) - American Indian and Alaska Native
Place of birth - Foreign born (%) - Multirace
Place of birth - Foreign born (%) - Other Race
Residents speaking English at home (%)
Residents speaking English at home - Born in the United States (%)
Residents speaking English at home - Native, born elsewhere (%)
Residents speaking English at home - Foreign born (%)
Residents speaking Spanish at home (%)
Residents speaking Spanish at home - Born in the United States (%)
Residents speaking Spanish at home - Native, born elsewhere (%)
Residents speaking Spanish at home - Foreign born (%)
Residents speaking other language at home (%)
Residents speaking other language at home - Born in the United States (%)
Residents speaking other language at home - Native, born elsewhere (%)
Residents speaking other language at home - Foreign born (%)
Marital status - Never married (%)
Marital status - Now married (%)
Marital status - Separated (%)
Marital status - Widowed (%)
Marital status - Divorced (%)
Ancestries Reported - Arab (%)
Ancestries Reported - Czech (%)
Ancestries Reported - Danish (%)
Ancestries Reported - Dutch (%)
Ancestries Reported - English (%)
Ancestries Reported - French (%)
Ancestries Reported - French Canadian (%)
Ancestries Reported - German (%)
Ancestries Reported - Greek (%)
Ancestries Reported - Hungarian (%)
Ancestries Reported - Irish (%)
Ancestries Reported - Italian (%)
Ancestries Reported - Lithuanian (%)
Ancestries Reported - Norwegian (%)
Ancestries Reported - Polish (%)
Ancestries Reported - Portuguese (%)
Ancestries Reported - Russian (%)
Ancestries Reported - Scotch-Irish (%)
Ancestries Reported - Scottish (%)
Ancestries Reported - Slovak (%)
Ancestries Reported - Subsaharan African (%)
Ancestries Reported - Swedish (%)
Ancestries Reported - Swiss (%)
Ancestries Reported - Ukrainian (%)
Ancestries Reported - United States (%)
Ancestries Reported - Welsh (%)
Ancestries Reported - West Indian (%)
Ancestries Reported - Other (%)
Geographical mobility - Same house 1 year ago (%)
Geographical mobility - Same house 1 year ago (%) - White
Geographical mobility - Same house 1 year ago (%) - Black or African American
Geographical mobility - Same house 1 year ago (%) - Asian
Geographical mobility - Same house 1 year ago (%) - Hispanic or Latino
Geographical mobility - Same house 1 year ago (%) - American Indian and Alaska Native
Geographical mobility - Same house 1 year ago (%) - Multirace
Geographical mobility - Same house 1 year ago (%) - Other Race
Geographical mobility - Moved within same county (%)
Geographical mobility - Moved within same county (%) - White
Geographical mobility - Moved within same county (%) - Black or African American
Geographical mobility - Moved within same county (%) - Asian
Geographical mobility - Moved within same county (%) - Hispanic or Latino
Geographical mobility - Moved within same county (%) - American Indian and Alaska Native
Geographical mobility - Moved within same county (%) - Multirace
Geographical mobility - Moved within same county (%) - Other Race
Geographical mobility - Moved from different county within same state (%)
Geographical mobility - Moved from different county within same state (%) - White
Geographical mobility - Moved from different county within same state (%) - Black or African American
Geographical mobility - Moved from different county within same state (%) - Asian
Geographical mobility - Moved from different county within same state (%) - Hispanic or Latino
Geographical mobility - Moved from different county within same state (%) - American Indian and Alaska Native
Geographical mobility - Moved from different county within same state (%) - Multirace
Geographical mobility - Moved from different county within same state (%) - Other Race
Geographical mobility - Moved from different state (%)
Geographical mobility - Moved from different state (%) - White
Geographical mobility - Moved from different state (%) - Black or African American
Geographical mobility - Moved from different state (%) - Asian
Geographical mobility - Moved from different state (%) - Hispanic or Latino
Geographical mobility - Moved from different state (%) - American Indian and Alaska Native
Geographical mobility - Moved from different state (%) - Multirace
Geographical mobility - Moved from different state (%) - Other Race
Geographical mobility - Moved from abroad (%)
Geographical mobility - Moved from abroad (%) - White
Geographical mobility - Moved from abroad (%) - Black or African American
Geographical mobility - Moved from abroad (%) - Asian
Geographical mobility - Moved from abroad (%) - Hispanic or Latino
Geographical mobility - Moved from abroad (%) - American Indian and Alaska Native
Geographical mobility - Moved from abroad (%) - Multirace
Geographical mobility - Moved from abroad (%) - Other Race
Place of birth for the foreign-born population - Ireland (%)
Place of birth for the foreign-born population - Denmark (%)
Place of birth for the foreign-born population - Norway (%)
Place of birth for the foreign-born population - Sweden (%)
Place of birth for the foreign-born population - United Kingdom (%)
Place of birth for the foreign-born population - England (%)
Place of birth for the foreign-born population - Scotland (%)
Place of birth for the foreign-born population - Other Northern Europe (%)
Place of birth for the foreign-born population - Austria (%)
Place of birth for the foreign-born population - Belgium (%)
Place of birth for the foreign-born population - France (%)
Place of birth for the foreign-born population - Germany (%)
Place of birth for the foreign-born population - Netherlands (%)
Place of birth for the foreign-born population - Switzerland (%)
Place of birth for the foreign-born population - Other Western Europe (%)
Place of birth for the foreign-born population - Greece (%)
Place of birth for the foreign-born population - Italy (%)
Place of birth for the foreign-born population - Portugal (%)
Place of birth for the foreign-born population - Spain (%)
Place of birth for the foreign-born population - Other Southern Europe (%)
Place of birth for the foreign-born population - Albania (%)
Place of birth for the foreign-born population - Belarus (%)
Place of birth for the foreign-born population - Bosnia and Herzegovina (%)
Place of birth for the foreign-born population - Bulgaria (%)
Place of birth for the foreign-born population - Croatia (%)
Place of birth for the foreign-born population - Czechoslovakia (%)
Place of birth for the foreign-born population - Hungary (%)
Place of birth for the foreign-born population - Latvia (%)
Place of birth for the foreign-born population - Lithuania (%)
Place of birth for the foreign-born population - North Macedonia (Macedonia) (%)
Place of birth for the foreign-born population - Moldova (%)
Place of birth for the foreign-born population - Poland (%)
Place of birth for the foreign-born population - Romania (%)
Place of birth for the foreign-born population - Russia (%)
Place of birth for the foreign-born population - Serbia (%)
Place of birth for the foreign-born population - Ukraine (%)
Place of birth for the foreign-born population - Other Eastern Europe (%)
Place of birth for the foreign-born population - China (%)
Place of birth for the foreign-born population - Hong Kong (%)
Place of birth for the foreign-born population - Taiwan (%)
Place of birth for the foreign-born population - Japan (%)
Place of birth for the foreign-born population - Korea (%)
Place of birth for the foreign-born population - Other Eastern Asia (%)
Place of birth for the foreign-born population - Afghanistan (%)
Place of birth for the foreign-born population - Bangladesh (%)
Place of birth for the foreign-born population - India (%)
Place of birth for the foreign-born population - Iran (%)
Place of birth for the foreign-born population - Kazakhstan (%)
Place of birth for the foreign-born population - Nepal (%)
Place of birth for the foreign-born population - Pakistan (%)
Place of birth for the foreign-born population - Sri Lanka (%)
Place of birth for the foreign-born population - Uzbekistan (%)
Place of birth for the foreign-born population - Other South Central Asia (%)
Place of birth for the foreign-born population - Burma (%)
Place of birth for the foreign-born population - Cambodia (%)
Place of birth for the foreign-born population - Indonesia (%)
Place of birth for the foreign-born population - Laos (%)
Place of birth for the foreign-born population - Malaysia (%)
Place of birth for the foreign-born population - Philippines (%)
Place of birth for the foreign-born population - Singapore (%)
Place of birth for the foreign-born population - Thailand (%)
Place of birth for the foreign-born population - Vietnam (%)
Place of birth for the foreign-born population - Other South Eastern Asia (%)
Place of birth for the foreign-born population - Armenia (%)
Place of birth for the foreign-born population - Iraq (%)
Place of birth for the foreign-born population - Israel (%)
Place of birth for the foreign-born population - Jordan (%)
Place of birth for the foreign-born population - Kuwait (%)
Place of birth for the foreign-born population - Lebanon (%)
Place of birth for the foreign-born population - Saudi Arabia (%)
Place of birth for the foreign-born population - Syria (%)
Place of birth for the foreign-born population - Turkey (%)
Place of birth for the foreign-born population - Yemen (%)
Place of birth for the foreign-born population - Other Western Asia (%)
Place of birth for the foreign-born population - Eritrea (%)
Place of birth for the foreign-born population - Ethiopia (%)
Place of birth for the foreign-born population - Kenya (%)
Place of birth for the foreign-born population - Somalia (%)
Place of birth for the foreign-born population - Uganda (%)
Place of birth for the foreign-born population - Zimbabwe (%)
Place of birth for the foreign-born population - Other Eastern Africa (%)
Place of birth for the foreign-born population - Cameroon (%)
Place of birth for the foreign-born population - Congo (%)
Place of birth for the foreign-born population - Democratic Republic of Congo (Zaire) (%)
Place of birth for the foreign-born population - Other Middle Africa (%)
Place of birth for the foreign-born population - Egypt (%)
Place of birth for the foreign-born population - Morocco (%)
Place of birth for the foreign-born population - Sudan (%)
Place of birth for the foreign-born population - Other Northern Africa (%)
Place of birth for the foreign-born population - South Africa (%)
Place of birth for the foreign-born population - Other Southern Africa (%)
Place of birth for the foreign-born population - Cabo Verde (%)
Place of birth for the foreign-born population - Ghana (%)
Place of birth for the foreign-born population - Liberia (%)
Place of birth for the foreign-born population - Nigeria (%)
Place of birth for the foreign-born population - Senegal (%)
Place of birth for the foreign-born population - Sierra Leone (%)
Place of birth for the foreign-born population - Other Western Africa (%)
Place of birth for the foreign-born population - Australia (%)
Place of birth for the foreign-born population - New Zealand (%)
Place of birth for the foreign-born population - Fiji (%)
Place of birth for the foreign-born population - Micronesia (%)
Place of birth for the foreign-born population - Bahamas (%)
Place of birth for the foreign-born population - Barbados (%)
Place of birth for the foreign-born population - Cuba (%)
Place of birth for the foreign-born population - Dominica (%)
Place of birth for the foreign-born population - Dominican Republic (%)
Place of birth for the foreign-born population - Grenada (%)
Place of birth for the foreign-born population - Haiti (%)
Place of birth for the foreign-born population - Jamaica (%)
Place of birth for the foreign-born population - St. Vincent and the Grenadines (%)
Place of birth for the foreign-born population - Trinidad and Tobago (%)
Place of birth for the foreign-born population - West Indies (%)
Place of birth for the foreign-born population - Other Caribbean (%)
Place of birth for the foreign-born population - Belize (%)
Place of birth for the foreign-born population - Costa Rica (%)
Place of birth for the foreign-born population - El Salvador (%)
Place of birth for the foreign-born population - Guatemala (%)
Place of birth for the foreign-born population - Honduras (%)
Place of birth for the foreign-born population - Mexico (%)
Place of birth for the foreign-born population - Nicaragua (%)
Place of birth for the foreign-born population - Panama (%)
Place of birth for the foreign-born population - Other Central America (%)
Place of birth for the foreign-born population - Argentina (%)
Place of birth for the foreign-born population - Bolivia (%)
Place of birth for the foreign-born population - Brazil (%)
Place of birth for the foreign-born population - Chile (%)
Place of birth for the foreign-born population - Colombia (%)
Place of birth for the foreign-born population - Ecuador (%)
Place of birth for the foreign-born population - Guyana (%)
Place of birth for the foreign-born population - Peru (%)
Place of birth for the foreign-born population - Uruguay (%)
Place of birth for the foreign-born population - Venezuela (%)
Place of birth for the foreign-born population - Other South America (%)
Place of birth for the foreign-born population - Canada (%)
Place of birth for the foreign-born population - Other Northern America (%)
Place of birth for the foreign-born population - Other (%)
Latest news about races in Richmond, KY collected exclusively by city-data.com from local newspapers, TV, and radio stations
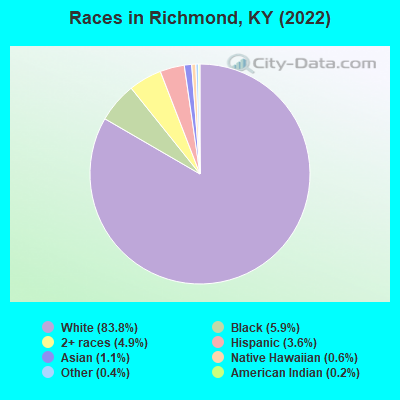
According to 2022 data, the most numerous races in Richmond, KY are White alone (29,279 residents), Black alone (2,053 residents), and Hispanic (1,242 residents). 95.6% of Richmond residents speak English at home. 3.2% of Richmond, KY residents are foreign-born (1.4% born in Asia, 1.1% born in Latin America, 0.5% born in Europe), which is 23.7% less than the foreign-born rate of 4.0% across the entire state of Kentucky.
Race distribution in Richmond
2000 2022
3,608,013 89.3% White alone 293,639 7.3% Black alone 59,939 1.5% Hispanic 37,750 0.9% Two or more races 29,368 0.7% Asian alone 7,939 0.2% American Indian alone 3,846 0.10% Other race alone 1,275 0.03% Native Hawaiian and Other
3,710,998 82.2% White alone 343,194 7.6% Black alone 187,483 4.2% Hispanic 187,394 4.2% Two or more races 62,240 1.4% Asian alone 13,529 0.3% Other race alone 4,302 0.10% American Indian alone 3,170 0.07% Native Hawaiian and Other
Income and house value in Richmond Median household income in 2022 $45,409 White non-Hispanic householders$21,228 Black householders$62,111 Some other race householders$58,504 Two or more races householders$45,763 Hispanic or Latino race householdersMedian 2022 house value $214,841 White Non-Hispanic householders$126,336 Black or African American householders$282,096 American Indian or Alaska Native householders $361,961 Asian householders$237,259 Two or more races householders$151,790 Hispanic or Latino householders
Median age by race in Richmond
28.4 Median age for White residents26.5 31.4 38.8 Median age for Black or African American residents45.5 38.1 17.7 Median age for American Indian / Alaska Native residents57.5 21.2 31.6 Median age for Asian residents35.9 24.7 25.5 Median age for Native Hawaiian / Pacific Islander residents-724,043,715.1 28.3 16.8 Median age for Other race residents16.6 9.4 20.2 Median age for Two or more races residents20.1 21.6 28.7 Median age for White alone residents27.1 31.4 26.4 Median age for Hispanic or Latino residents26.2 30.4
Owner/renter occupied households by race in Richmond
House owners and renters - White residents 5,112 38.1% Owner occupied8,306 61.9% Renter occupiedHouse owners and renters - Black or African American residents 77 10.8% Owner occupied633 89.2% Renter occupiedHouse owners and renters - American Indian / Alaska Native residents 1 2.2% Owner occupied30 97.8% Renter occupiedHouse owners and renters - Asian residents 45 33.9% Owner occupied88 66.1% Renter occupiedHouse owners and renters - Native Hawaiian / Pacific Islander residents 51 100.0% Renter occupiedHouse owners and renters - Other race residents 16 14.9% Owner occupied93 85.1% Renter occupiedHouse owners and renters - Two or more races residents 260 52.6% Owner occupied235 47.4% Renter occupiedHouse owners and renters - White alone residents 5,117 38.3% Owner occupied8,230 61.7% Renter occupiedHouse owners and renters - Hispanic or Latino residents 62 21.7% Owner occupied225 78.3% Renter occupied
Language usage in Richmond
English speakers - Total 95.6% of residents of Richmond speak English at home.
2.2% of residents speak Spanish at home 417 55.2% Speak English very well339 44.8% Speak English less than very well2.0% of residents speak other language at home 569 83.3% Speak English very well114 16.7% Speak English less than very well
English speakers - Born in the United States 98.6% of residents of Richmond speak English at home.
1.2% of residents speak Spanish at home 95 88.0% Speak English very well13 12.0% Speak English less than very well0.6% of residents speak other language at home 60 100.0% Speak English very well
English speakers - Native, born elsewhere 88.8% of residents of Richmond speak English at home.
10.2% of residents speak Spanish at home 52 86.7% Speak English very well8 13.3% Speak English less than very well13.1% of residents speak other language at home 77 100.0% Speak English very well
English speakers - Foreign-born 14.3% of residents of Richmond speak English at home.
47.8% of residents speak Spanish at home 209 36.3% Speak English very well367 63.7% Speak English less than very well37.8% of residents speak other language at home 342 75.0% Speak English very well114 25.0% Speak English less than very well
White (Caucasian) - Speak only English Native:
99.5% (28,468)Foreign-born:
22.5% (131)
White (Caucasian) - Speak another language Native:
0.6% (162)Foreign-born:
94.7% (553)
Black or African American - Speak only English Native:
97.1% (1,865)Foreign-born:
63.4% (59)
Black or African American - Speak another language Native:
2.7% (52)Foreign-born:
41.4% (38)
American Indian / Alaska Native - Speak only English Native:
88.5% (55)Foreign-born:
100.0% (14)
Asian - Speak only English Native:
72.9% (62)Foreign-born:
32.8% (95)
Asian - Speak another language Native:
26.1% (22)Foreign-born:
66.3% (193)
Other race - Speak another language Native:
57.1% (245)Foreign-born:
98.6% (86)
Two or more races - Speak only English Native:
89.6% (1,556)Foreign-born:
2.5% (6)
Two or more races - Speak another language Native:
8.1% (140)Foreign-born:
97.9% (241)
White alone - Speak only English Native:
99.5% (28,096)Foreign-born:
25.0% (64)
White alone - Speak another language Native:
0.5% (151)Foreign-born:
76.2% (194)
Hispanic or Latino - Speak another language Native:
57.0% (435)Foreign-born:
100.0% (456)
Foreign-born residents in Richmond 1,155 residents are foreign born (1.4% Asia , 1.1% Latin America , 0.5% Europe ).
This city:
3.2%Kentucky:
4.1%
Marital status for residents in Richmond Marital status - White (Caucasian) population 15 years and over
Males 50.5% Never married33.3% Now married1.2% Separated2.6% Widowed12.4% DivorcedFemales 40.4% Never married32.4% Now married3.2% Separated8.4% Widowed15.6% DivorcedWomen who gave birth in the past 12 months Now married:
62.0% (280)Unmarried:
38.0% (171)
Women who did not give birth in the past 12 months Now married:
34.7% (3,338)Unmarried:
65.3% (6,293)
Marital status - Black or African American population 15 years and over
Males 44.5% Never married28.5% Now married8.1% Separated0.3% Widowed18.5% DivorcedFemales 61.0% Never married25.7% Now married2.3% Separated2.4% Widowed8.6% DivorcedWomen who gave birth in the past 12 months Now married:
0.0% (0)Unmarried:
100.0% (16)
Women who did not give birth in the past 12 months Now married:
10.6% (69)Unmarried:
89.4% (577)
Marital status - American Indian / Alaska Native population 15 years and over
Males 42.1% Never married0.0% Now married57.9% Separated0.0% Widowed0.0% DivorcedFemales 25.9% Never married70.4% Now married0.0% Separated0.0% Widowed3.7% DivorcedWomen who did not give birth in the past 12 months Now married:
72.0% (21)Unmarried:
28.0% (8)
Marital status - Asian population 15 years and over
Males 20.9% Never married58.1% Now married1.7% Separated0.0% Widowed19.2% DivorcedFemales 25.3% Never married20.8% Now married0.0% Separated0.0% Widowed53.8% DivorcedWomen who did not give birth in the past 12 months Now married:
18.9% (30)Unmarried:
81.1% (131)
Marital status - Native Hawaiian / Pacific Islander population 15 years and over
Males 100.0% Never married0.0% Now married0.0% Separated0.0% Widowed0.0% DivorcedFemales 100.0% Never married0.0% Now married0.0% Separated0.0% Widowed0.0% DivorcedWomen who gave birth in the past 12 months Now married:
0.0% (0)Unmarried:
100.0% (54)
Women who did not give birth in the past 12 months Now married:
0.0% (0)Unmarried:
100.0% (6)
Marital status - Other race population 15 years and over
Males 54.1% Never married28.8% Now married0.0% Separated0.0% Widowed17.1% DivorcedFemales 32.5% Never married26.0% Now married0.0% Separated0.0% Widowed41.6% DivorcedWomen who did not give birth in the past 12 months Now married:
30.3% (26)Unmarried:
69.7% (61)
Marital status - Two or more races population 15 years and over
Males 61.8% Never married24.9% Now married2.4% Separated0.0% Widowed10.9% DivorcedFemales 72.0% Never married19.8% Now married1.9% Separated1.6% Widowed4.7% DivorcedWomen who gave birth in the past 12 months Now married:
0.0% (0)Unmarried:
100.0% (13)
Women who did not give birth in the past 12 months Now married:
17.9% (118)Unmarried:
82.1% (540)
Marital status - White alone, not Hispanic / Latino population 15 years and over
Males 50.3% Never married33.7% Now married1.0% Separated2.6% Widowed12.4% DivorcedFemales 40.3% Never married32.2% Now married3.3% Separated8.5% Widowed15.7% DivorcedWomen who gave birth in the past 12 months Now married:
62.0% (283)Unmarried:
38.0% (173)
Women who did not give birth in the past 12 months Now married:
34.4% (3,263)Unmarried:
65.6% (6,210)
Marital status - Hispanic or Latino population 15 years and over
Males 53.9% Never married25.6% Now married5.0% Separated0.0% Widowed15.5% DivorcedFemales 49.0% Never married47.0% Now married0.0% Separated0.0% Widowed4.0% DivorcedWomen who did not give birth in the past 12 months Now married:
44.0% (172)Unmarried:
56.0% (219)
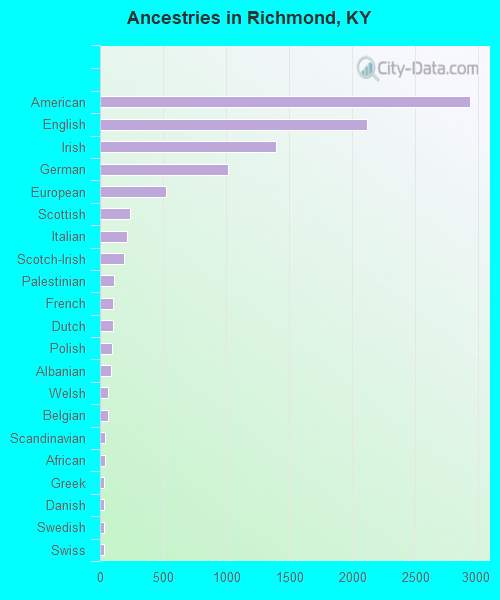
Ancestries in Richmond
2,939 21.2% American2,122 15.3% English1,400 10.1% Irish1,012 7.3% German526 3.8% European235 1.7% Scottish211 1.5% Italian190 1.4% Scotch-Irish109 0.8% Palestinian102 0.7% French100 0.7% Dutch96 0.7% Polish91 0.7% Albanian64 0.5% Welsh63 0.5% Belgian37 0.3% Scandinavian37 0.3% African33 0.2% Greek29 0.2% Danish28 0.2% Swedish28 0.2% Swiss26 0.2% Egyptian24 0.2% Russian21 0.2% Syrian20 0.1% Lebanese18 0.1% Norwegian16 0.1% Slovak9 0.06% French Canadian8 0.06% Bulgarian7 0.05% Latvian6 0.04% Czech4 0.03% Celtic4 0.03% Armenian
Geographical mobility in Richmond Same house 1 year ago 22,822 75.7% White (Caucasian)1,665 82.2% Black or African American25 33.8% American Indian / Alaska Native323 85.8% Asian208 98.0% Native Hawaiian / Pacific Islander487 87.8% Other race1,389 64.2% Two or more races22,295 75.6% White alone, not Hispanic / Latino946 76.4% Hispanic or LatinoMoved within same county 3,530 11.7% White / Caucasian122 6.0% Black or African American32 42.8% American Indian / Alaska Native21 3.8% Other race473 21.8% Two or more races3,496 11.8% White alone, not Hispanic / Latino95 7.7% Hispanic or LatinoMoved within same state 2,506 8.3% White / Caucasian185 9.2% Black or African American24 6.3% Asian7 3.1% Native Hawaiian / Pacific Islander48 8.6% Other race211 9.8% Two or more races2,501 8.5% White alone, not Hispanic / Latino184 14.8% Hispanic or LatinoMoved from different state 804 2.7% White / Caucasian67 3.3% Black or African American23 30.6% American Indian / Alaska Native33 8.8% Asian30 1.4% Two or more races804 2.7% White alone, not Hispanic / LatinoMoved from abroad 7 0.0% White7 0.0% White alone, not Hispanic / Latino
Children Nativity (place of birth) in Richmond
Children under 6 years - Living with two parents Both parents native 1,136 100.0% NativeBoth parents foreign-born 23 82.2% Native5 17.8% Foreign-bornOne native, one foreign-born parent 108 100.0% NativeChildren under 6 years - Living with one parent Native parent 609 100.0% NativeChildren 6 to 17 years - Living with two parents Both parents native 2,101 100.0% NativeBoth parents foreign-born 110 100.0% NativeOne native, one foreign-born parent 153 100.0% NativeChildren 6 to 17 years - Living with one parent Native parent 1,343 100.0% NativeForeign-born parent 59 53.6% Native51 46.4% Foreign-born
Grandparents responsible for own grandchildren in Richmond
Grandparents (30 to 59 years) White / Caucasian 136 85.6% Responsible for grandchildren23 14.4% Not responsible for grandchildrenWhite alone, not Hispanic / Latino 136 85.6% Responsible for grandchildren23 14.4% Not responsible for grandchildrenGrandparents (60 years and over) White / Caucasian 38 28.3% Responsible for grandchildren95 71.7% Not responsible for grandchildrenWhite alone, not Hispanic / Latino 38 28.3% Responsible for grandchildren95 71.7% Not responsible for grandchildren