Races in Rochelle, Illinois (IL) Detailed Stats
Data:
Races - White alone (%)
Races - White alone (% change since 2000)
Races - Black alone (%)
Races - Black alone (% change since 2000)
Races - American Indian alone (%)
Races - American Indian alone (% change since 2000)
Races - Asian alone (%)
Races - Asian alone (% change since 2000)
Races - Hispanic (%)
Races - Hispanic (% change since 2000)
Races - Native Hawaiian and Other Pacific Islander alone (%)
Races - Native Hawaiian and Other Pacific Islander alone (% change since 2000)
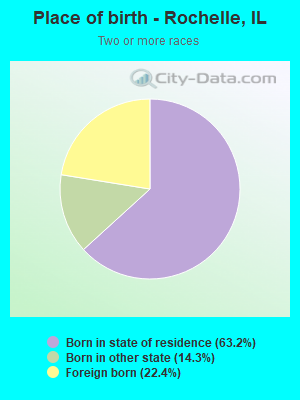
Races - Two or more races(%)
Races - Two or more races(% change since 2000)
Races - Other race alone (%)
Races - Other race alone (% change since 2000)
Racial diversity
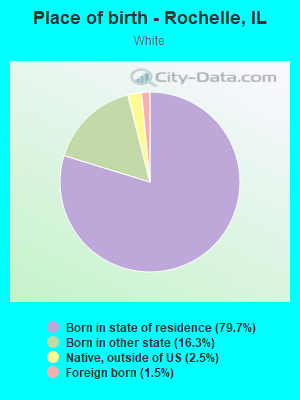
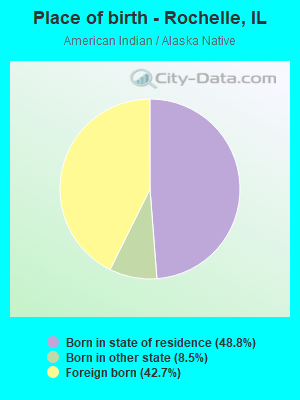
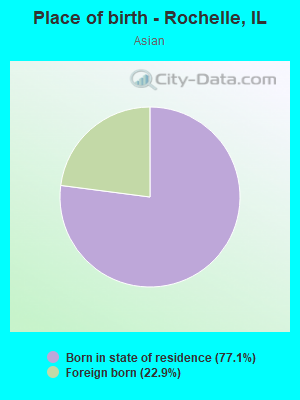
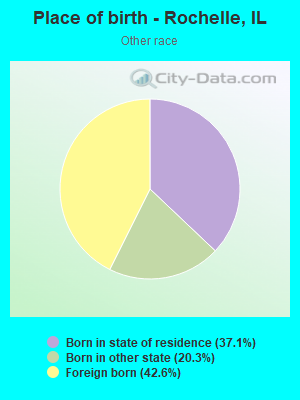
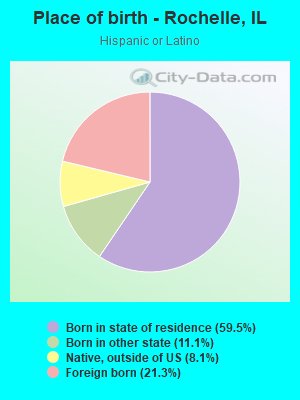
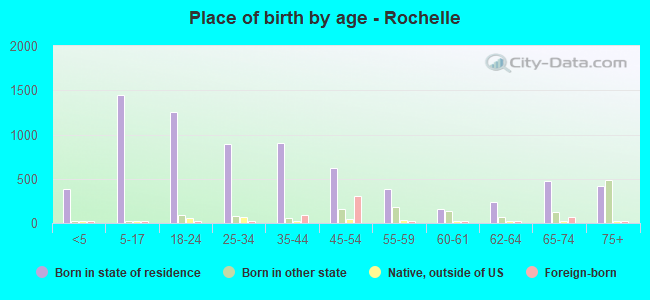
Place of birth - Born in state of residence (%)
Place of birth - Born in state of residence (%) - White
Place of birth - Born in state of residence (%) - Black or African American
Place of birth - Born in state of residence (%) - Asian
Place of birth - Born in state of residence (%) - Hispanic or Latino
Place of birth - Born in state of residence (%) - American Indian and Alaska Native
Place of birth - Born in state of residence (%) - Multirace
Place of birth - Born in state of residence (%) - Other Race
Place of birth - Born in other state (%)
Place of birth - Born in other state (%) - White
Place of birth - Born in other state (%) - Black or African American
Place of birth - Born in other state (%) - Asian
Place of birth - Born in other state (%) - Hispanic or Latino
Place of birth - Born in other state (%) - American Indian and Alaska Native
Place of birth - Born in other state (%) - Multirace
Place of birth - Born in other state (%) - Other Race
Place of birth - Native, outside of US (%)
Place of birth - Native, outside of US (%) - White
Place of birth - Native, outside of US (%) - Black or African American
Place of birth - Native, outside of US (%) - Asian
Place of birth - Native, outside of US (%) - Hispanic or Latino
Place of birth - Native, outside of US (%) - American Indian and Alaska Native
Place of birth - Native, outside of US (%) - Multirace
Place of birth - Native, outside of US (%) - Other Race
Place of birth - Foreign born (%)
Place of birth - Foreign born (%) - White
Place of birth - Foreign born (%) - Black or African American
Place of birth - Foreign born (%) - Asian
Place of birth - Foreign born (%) - Hispanic or Latino
Place of birth - Foreign born (%) - American Indian and Alaska Native
Place of birth - Foreign born (%) - Multirace
Place of birth - Foreign born (%) - Other Race
Residents speaking English at home (%)
Residents speaking English at home - Born in the United States (%)
Residents speaking English at home - Native, born elsewhere (%)
Residents speaking English at home - Foreign born (%)
Residents speaking Spanish at home (%)
Residents speaking Spanish at home - Born in the United States (%)
Residents speaking Spanish at home - Native, born elsewhere (%)
Residents speaking Spanish at home - Foreign born (%)
Residents speaking other language at home (%)
Residents speaking other language at home - Born in the United States (%)
Residents speaking other language at home - Native, born elsewhere (%)
Residents speaking other language at home - Foreign born (%)
Marital status - Never married (%)
Marital status - Now married (%)
Marital status - Separated (%)
Marital status - Widowed (%)
Marital status - Divorced (%)
Ancestries Reported - Arab (%)
Ancestries Reported - Czech (%)
Ancestries Reported - Danish (%)
Ancestries Reported - Dutch (%)
Ancestries Reported - English (%)
Ancestries Reported - French (%)
Ancestries Reported - French Canadian (%)
Ancestries Reported - German (%)
Ancestries Reported - Greek (%)
Ancestries Reported - Hungarian (%)
Ancestries Reported - Irish (%)
Ancestries Reported - Italian (%)
Ancestries Reported - Lithuanian (%)
Ancestries Reported - Norwegian (%)
Ancestries Reported - Polish (%)
Ancestries Reported - Portuguese (%)
Ancestries Reported - Russian (%)
Ancestries Reported - Scotch-Irish (%)
Ancestries Reported - Scottish (%)
Ancestries Reported - Slovak (%)
Ancestries Reported - Subsaharan African (%)
Ancestries Reported - Swedish (%)
Ancestries Reported - Swiss (%)
Ancestries Reported - Ukrainian (%)
Ancestries Reported - United States (%)
Ancestries Reported - Welsh (%)
Ancestries Reported - West Indian (%)
Ancestries Reported - Other (%)
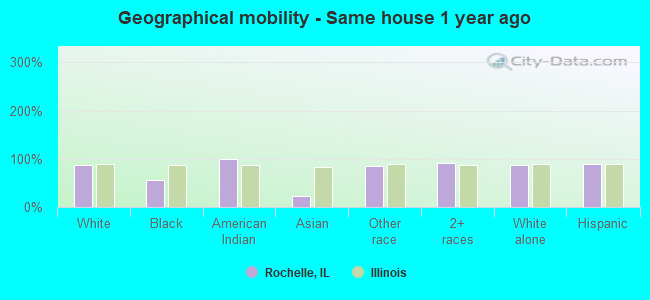
Geographical mobility - Same house 1 year ago (%)
Geographical mobility - Same house 1 year ago (%) - White
Geographical mobility - Same house 1 year ago (%) - Black or African American
Geographical mobility - Same house 1 year ago (%) - Asian
Geographical mobility - Same house 1 year ago (%) - Hispanic or Latino
Geographical mobility - Same house 1 year ago (%) - American Indian and Alaska Native
Geographical mobility - Same house 1 year ago (%) - Multirace
Geographical mobility - Same house 1 year ago (%) - Other Race
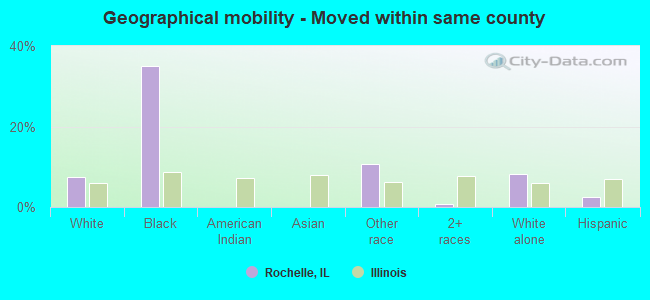
Geographical mobility - Moved within same county (%)
Geographical mobility - Moved within same county (%) - White
Geographical mobility - Moved within same county (%) - Black or African American
Geographical mobility - Moved within same county (%) - Asian
Geographical mobility - Moved within same county (%) - Hispanic or Latino
Geographical mobility - Moved within same county (%) - American Indian and Alaska Native
Geographical mobility - Moved within same county (%) - Multirace
Geographical mobility - Moved within same county (%) - Other Race
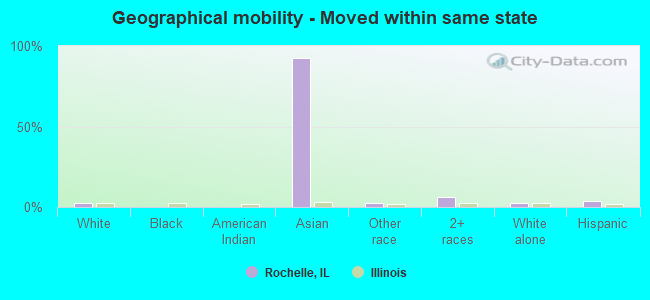
Geographical mobility - Moved from different county within same state (%)
Geographical mobility - Moved from different county within same state (%) - White
Geographical mobility - Moved from different county within same state (%) - Black or African American
Geographical mobility - Moved from different county within same state (%) - Asian
Geographical mobility - Moved from different county within same state (%) - Hispanic or Latino
Geographical mobility - Moved from different county within same state (%) - American Indian and Alaska Native
Geographical mobility - Moved from different county within same state (%) - Multirace
Geographical mobility - Moved from different county within same state (%) - Other Race
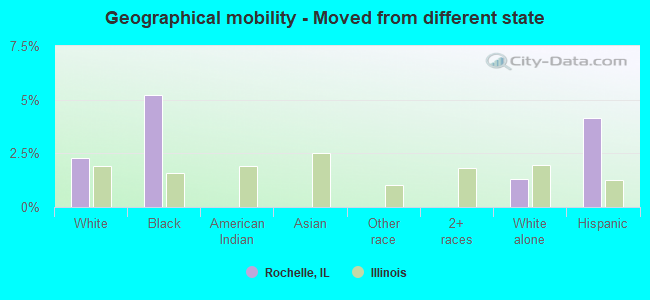
Geographical mobility - Moved from different state (%)
Geographical mobility - Moved from different state (%) - White
Geographical mobility - Moved from different state (%) - Black or African American
Geographical mobility - Moved from different state (%) - Asian
Geographical mobility - Moved from different state (%) - Hispanic or Latino
Geographical mobility - Moved from different state (%) - American Indian and Alaska Native
Geographical mobility - Moved from different state (%) - Multirace
Geographical mobility - Moved from different state (%) - Other Race
Geographical mobility - Moved from abroad (%)
Geographical mobility - Moved from abroad (%) - White
Geographical mobility - Moved from abroad (%) - Black or African American
Geographical mobility - Moved from abroad (%) - Asian
Geographical mobility - Moved from abroad (%) - Hispanic or Latino
Geographical mobility - Moved from abroad (%) - American Indian and Alaska Native
Geographical mobility - Moved from abroad (%) - Multirace
Geographical mobility - Moved from abroad (%) - Other Race
Place of birth for the foreign-born population - Ireland (%)
Place of birth for the foreign-born population - Denmark (%)
Place of birth for the foreign-born population - Norway (%)
Place of birth for the foreign-born population - Sweden (%)
Place of birth for the foreign-born population - United Kingdom (%)
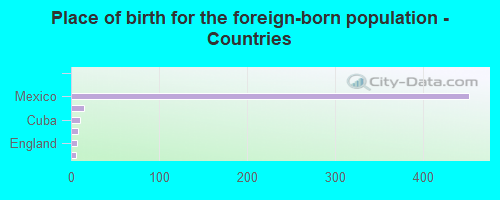
Place of birth for the foreign-born population - England (%)
Place of birth for the foreign-born population - Scotland (%)
Place of birth for the foreign-born population - Other Northern Europe (%)
Place of birth for the foreign-born population - Austria (%)
Place of birth for the foreign-born population - Belgium (%)
Place of birth for the foreign-born population - France (%)
Place of birth for the foreign-born population - Germany (%)
Place of birth for the foreign-born population - Netherlands (%)
Place of birth for the foreign-born population - Switzerland (%)
Place of birth for the foreign-born population - Other Western Europe (%)
Place of birth for the foreign-born population - Greece (%)
Place of birth for the foreign-born population - Italy (%)
Place of birth for the foreign-born population - Portugal (%)
Place of birth for the foreign-born population - Spain (%)
Place of birth for the foreign-born population - Other Southern Europe (%)
Place of birth for the foreign-born population - Albania (%)
Place of birth for the foreign-born population - Belarus (%)
Place of birth for the foreign-born population - Bosnia and Herzegovina (%)
Place of birth for the foreign-born population - Bulgaria (%)
Place of birth for the foreign-born population - Croatia (%)
Place of birth for the foreign-born population - Czechoslovakia (%)
Place of birth for the foreign-born population - Hungary (%)
Place of birth for the foreign-born population - Latvia (%)
Place of birth for the foreign-born population - Lithuania (%)
Place of birth for the foreign-born population - North Macedonia (Macedonia) (%)
Place of birth for the foreign-born population - Moldova (%)
Place of birth for the foreign-born population - Poland (%)
Place of birth for the foreign-born population - Romania (%)
Place of birth for the foreign-born population - Russia (%)
Place of birth for the foreign-born population - Serbia (%)
Place of birth for the foreign-born population - Ukraine (%)
Place of birth for the foreign-born population - Other Eastern Europe (%)
Place of birth for the foreign-born population - China (%)
Place of birth for the foreign-born population - Hong Kong (%)
Place of birth for the foreign-born population - Taiwan (%)
Place of birth for the foreign-born population - Japan (%)
Place of birth for the foreign-born population - Korea (%)
Place of birth for the foreign-born population - Other Eastern Asia (%)
Place of birth for the foreign-born population - Afghanistan (%)
Place of birth for the foreign-born population - Bangladesh (%)
Place of birth for the foreign-born population - India (%)
Place of birth for the foreign-born population - Iran (%)
Place of birth for the foreign-born population - Kazakhstan (%)
Place of birth for the foreign-born population - Nepal (%)
Place of birth for the foreign-born population - Pakistan (%)
Place of birth for the foreign-born population - Sri Lanka (%)
Place of birth for the foreign-born population - Uzbekistan (%)
Place of birth for the foreign-born population - Other South Central Asia (%)
Place of birth for the foreign-born population - Burma (%)
Place of birth for the foreign-born population - Cambodia (%)
Place of birth for the foreign-born population - Indonesia (%)
Place of birth for the foreign-born population - Laos (%)
Place of birth for the foreign-born population - Malaysia (%)
Place of birth for the foreign-born population - Philippines (%)
Place of birth for the foreign-born population - Singapore (%)
Place of birth for the foreign-born population - Thailand (%)
Place of birth for the foreign-born population - Vietnam (%)
Place of birth for the foreign-born population - Other South Eastern Asia (%)
Place of birth for the foreign-born population - Armenia (%)
Place of birth for the foreign-born population - Iraq (%)
Place of birth for the foreign-born population - Israel (%)
Place of birth for the foreign-born population - Jordan (%)
Place of birth for the foreign-born population - Kuwait (%)
Place of birth for the foreign-born population - Lebanon (%)
Place of birth for the foreign-born population - Saudi Arabia (%)
Place of birth for the foreign-born population - Syria (%)
Place of birth for the foreign-born population - Turkey (%)
Place of birth for the foreign-born population - Yemen (%)
Place of birth for the foreign-born population - Other Western Asia (%)
Place of birth for the foreign-born population - Eritrea (%)
Place of birth for the foreign-born population - Ethiopia (%)
Place of birth for the foreign-born population - Kenya (%)
Place of birth for the foreign-born population - Somalia (%)
Place of birth for the foreign-born population - Uganda (%)
Place of birth for the foreign-born population - Zimbabwe (%)
Place of birth for the foreign-born population - Other Eastern Africa (%)
Place of birth for the foreign-born population - Cameroon (%)
Place of birth for the foreign-born population - Congo (%)
Place of birth for the foreign-born population - Democratic Republic of Congo (Zaire) (%)
Place of birth for the foreign-born population - Other Middle Africa (%)
Place of birth for the foreign-born population - Egypt (%)
Place of birth for the foreign-born population - Morocco (%)
Place of birth for the foreign-born population - Sudan (%)
Place of birth for the foreign-born population - Other Northern Africa (%)
Place of birth for the foreign-born population - South Africa (%)
Place of birth for the foreign-born population - Other Southern Africa (%)
Place of birth for the foreign-born population - Cabo Verde (%)
Place of birth for the foreign-born population - Ghana (%)
Place of birth for the foreign-born population - Liberia (%)
Place of birth for the foreign-born population - Nigeria (%)
Place of birth for the foreign-born population - Senegal (%)
Place of birth for the foreign-born population - Sierra Leone (%)
Place of birth for the foreign-born population - Other Western Africa (%)
Place of birth for the foreign-born population - Australia (%)
Place of birth for the foreign-born population - New Zealand (%)
Place of birth for the foreign-born population - Fiji (%)
Place of birth for the foreign-born population - Micronesia (%)
Place of birth for the foreign-born population - Bahamas (%)
Place of birth for the foreign-born population - Barbados (%)
Place of birth for the foreign-born population - Cuba (%)
Place of birth for the foreign-born population - Dominica (%)
Place of birth for the foreign-born population - Dominican Republic (%)
Place of birth for the foreign-born population - Grenada (%)
Place of birth for the foreign-born population - Haiti (%)
Place of birth for the foreign-born population - Jamaica (%)
Place of birth for the foreign-born population - St. Vincent and the Grenadines (%)
Place of birth for the foreign-born population - Trinidad and Tobago (%)
Place of birth for the foreign-born population - West Indies (%)
Place of birth for the foreign-born population - Other Caribbean (%)
Place of birth for the foreign-born population - Belize (%)
Place of birth for the foreign-born population - Costa Rica (%)
Place of birth for the foreign-born population - El Salvador (%)
Place of birth for the foreign-born population - Guatemala (%)
Place of birth for the foreign-born population - Honduras (%)
Place of birth for the foreign-born population - Mexico (%)
Place of birth for the foreign-born population - Nicaragua (%)
Place of birth for the foreign-born population - Panama (%)
Place of birth for the foreign-born population - Other Central America (%)
Place of birth for the foreign-born population - Argentina (%)
Place of birth for the foreign-born population - Bolivia (%)
Place of birth for the foreign-born population - Brazil (%)
Place of birth for the foreign-born population - Chile (%)
Place of birth for the foreign-born population - Colombia (%)
Place of birth for the foreign-born population - Ecuador (%)
Place of birth for the foreign-born population - Guyana (%)
Place of birth for the foreign-born population - Peru (%)
Place of birth for the foreign-born population - Uruguay (%)
Place of birth for the foreign-born population - Venezuela (%)
Place of birth for the foreign-born population - Other South America (%)
Place of birth for the foreign-born population - Canada (%)
Place of birth for the foreign-born population - Other Northern America (%)
Place of birth for the foreign-born population - Other (%)
Latest news about races in Rochelle, IL collected exclusively by city-data.com from local newspapers, TV, and radio stations
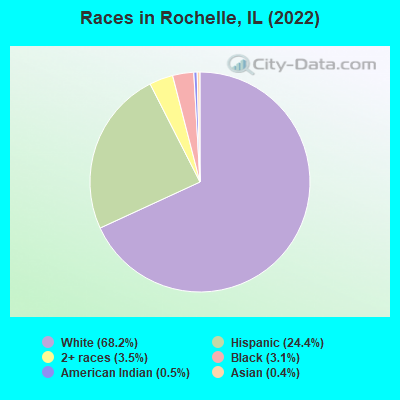
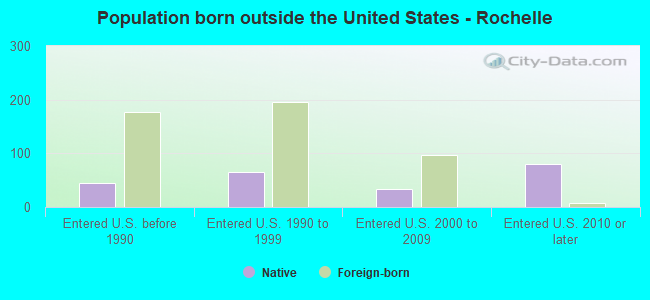
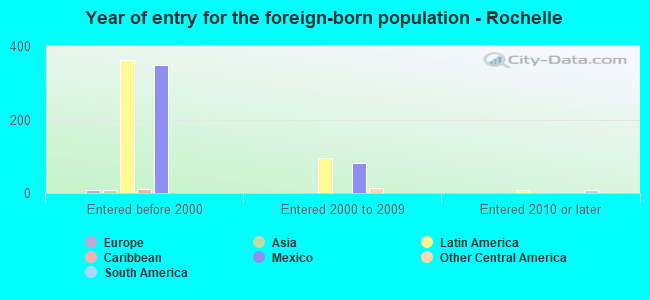
According to 2022 data, the most numerous races in Rochelle, IL are White alone (6,333 residents), Hispanic (2,267 residents), and Black alone (287 residents). 86.1% of Rochelle residents speak English at home. 5.4% of Rochelle, IL residents are foreign-born (5.1% born in Latin America), which is 160.6% less than the foreign-born rate of 14.0% across the entire state of Illinois.
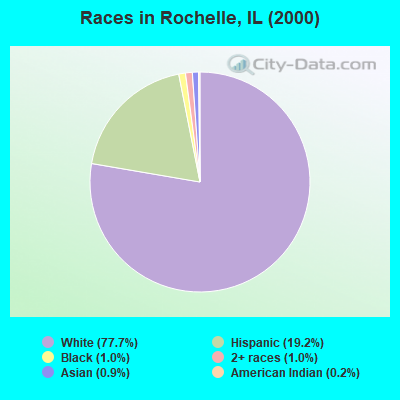
Race distribution in Rochelle
2000 2022
8,424,140 67.8% White alone 1,856,152 14.9% Black alone 1,530,262 12.3% Hispanic 419,916 3.4% Asian alone 153,996 1.2% Two or more races 13,479 0.1% Other race alone 18,232 0.1% American Indian alone 3,116 0.03% Native Hawaiian and Other
7,356,301 58.5% White alone 2,299,726 18.3% Hispanic 1,660,423 13.2% Black alone 747,296 5.9% Asian alone 458,599 3.6% Two or more races 45,386 0.4% Other race alone 10,405 0.08% American Indian alone 3,896 0.03% Native Hawaiian and Other
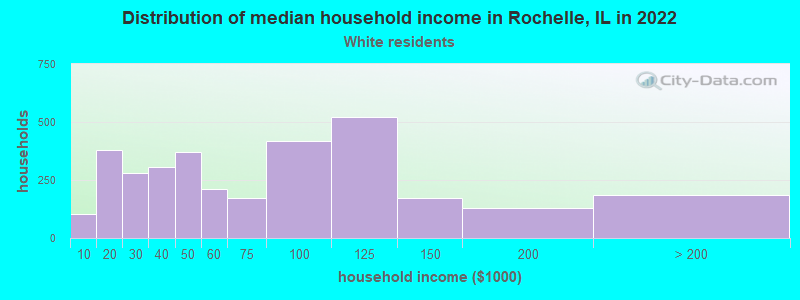
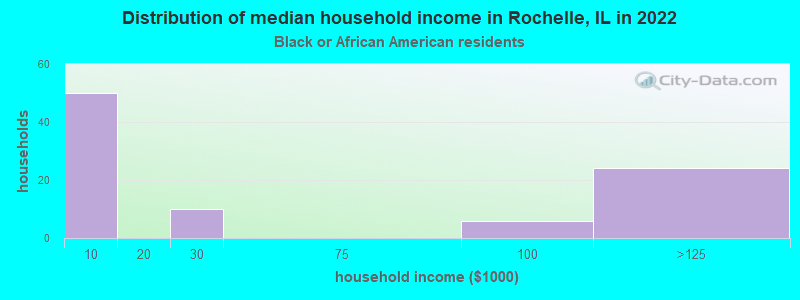
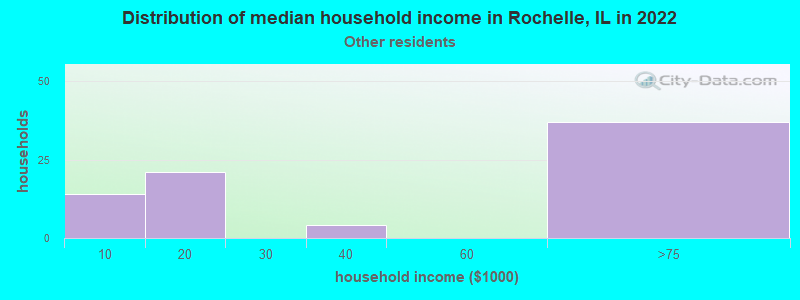
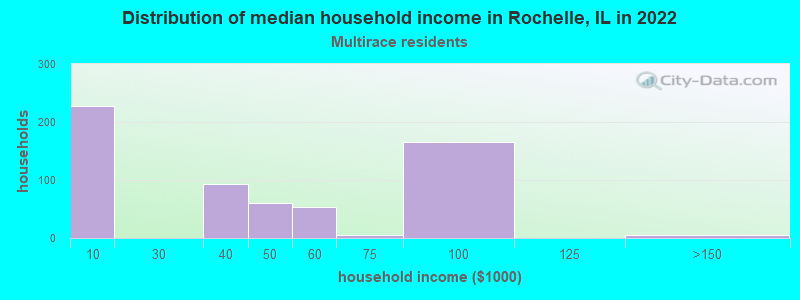
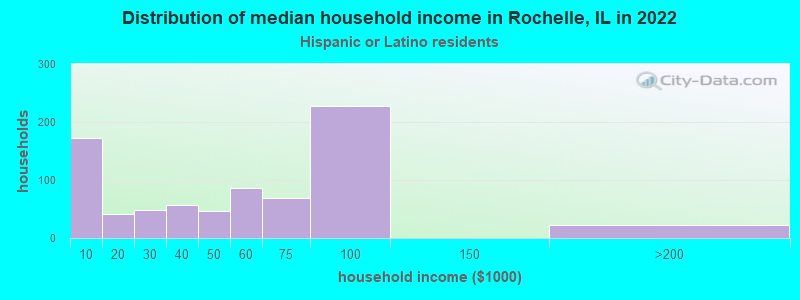
Income and house value in Rochelle Median household income in 2022 $56,591 White non-Hispanic householders$41,636 Two or more races householders$52,672 Hispanic or Latino race householdersMedian 2022 house value $146,965 White Non-Hispanic householders$170,449 Black or African American householders$157,268 American Indian or Alaska Native householders $246,204 Asian householders$128,178 Some other race householders$125,602 Two or more races householders$133,329 Hispanic or Latino householders
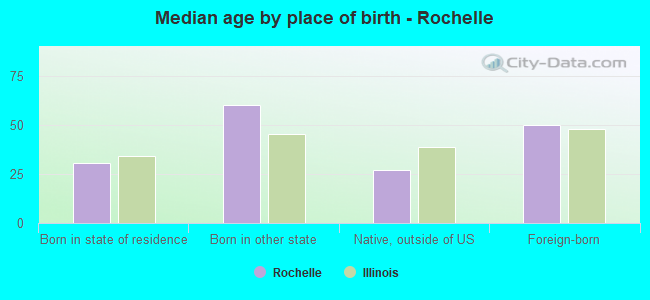
Median age by race in Rochelle
40.4 Median age for White residents37.0 44.5 13.1 Median age for Black or African American residents13.0 14.1 25.1 Median age for American Indian / Alaska Native residents25.0 47.7 -684,491,977.9 Median age for Asian residents-684,981,684.3 -682,291,666.0 -593,236,714.4 Median age for Native Hawaiian / Pacific Islander residents-658,536,584.7 -576,015,108.0 53.4 Median age for Other race residents53.4 63.5 26.7 Median age for Two or more races residents26.9 26.7 43.5 Median age for White alone residents38.4 45.7 27.1 Median age for Hispanic or Latino residents22.0 35.0
Owner/renter occupied households by race in Rochelle
House owners and renters - White residents 1,652 51.4% Owner occupied1,560 48.6% Renter occupiedHouse owners and renters - Black or African American residents 34 41.2% Owner occupied49 58.8% Renter occupiedHouse owners and renters - American Indian / Alaska Native residents 17 32.8% Owner occupied35 67.2% Renter occupiedHouse owners and renters - Asian residents 25 100.0% Renter occupiedHouse owners and renters - Other race residents 73 100.0% Renter occupiedHouse owners and renters - Two or more races residents 335 57.4% Owner occupied249 42.6% Renter occupiedHouse owners and renters - White alone residents 1,523 49.8% Owner occupied1,537 50.2% Renter occupiedHouse owners and renters - Hispanic or Latino residents 397 53.1% Owner occupied350 46.9% Renter occupied
Language usage in Rochelle
English speakers - Total 86.1% of residents of Rochelle speak English at home.
13.5% of residents speak Spanish at home 757 63.1% Speak English very well442 36.9% Speak English less than very well0.1% of residents speak other language at home 10 100.0% Speak English very well
English speakers - Born in the United States 86.3% of residents of Rochelle speak English at home.
14.5% of residents speak Spanish at home 50 25.0% Speak English very well150 75.0% Speak English less than very well
English speakers - Native, born elsewhere 53.1% of residents of Rochelle speak English at home.
46.5% of residents speak Spanish at home 68 64.2% Speak English very well38 35.8% Speak English less than very well
English speakers - Foreign-born 5.8% of residents of Rochelle speak English at home.
94.4% of residents speak Spanish at home 221 46.9% Speak English very well250 53.1% Speak English less than very well
White (Caucasian) - Speak only English Native:
98.4% (6,620)Foreign-born:
5.6% (6)
White (Caucasian) - Speak another language Native:
2.7% (181)Foreign-born:
93.0% (98)
American Indian / Alaska Native - Speak only English Native:
59.6% (54)Foreign-born:
17.8% (12)
American Indian / Alaska Native - Speak another language Native:
34.4% (31)Foreign-born:
76.8% (52)
Asian - Speak only English Native:
98.7% (27)Foreign-born:
87.5% (7)
Other race - Speak another language Native:
65.2% (38)Foreign-born:
99.9% (45)
Two or more races - Speak only English Native:
52.5% (684)Foreign-born:
2.1% (8)
Two or more races - Speak another language Native:
48.3% (629)Foreign-born:
98.2% (398)
White alone - Speak only English Native:
99.7% (6,175)Foreign-born:
92.8% (6)
Hispanic or Latino - Speak only English Native:
54.4% (856)Foreign-born:
2.0% (10)
Hispanic or Latino - Speak another language Native:
46.4% (729)Foreign-born:
98.0% (474)
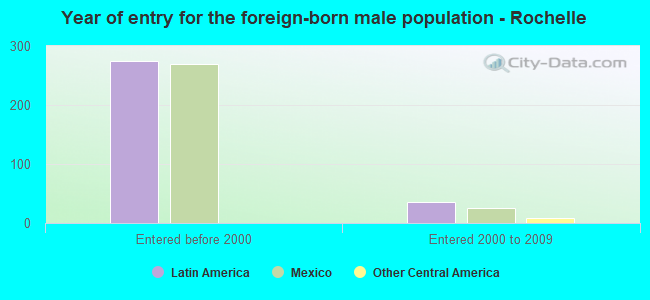
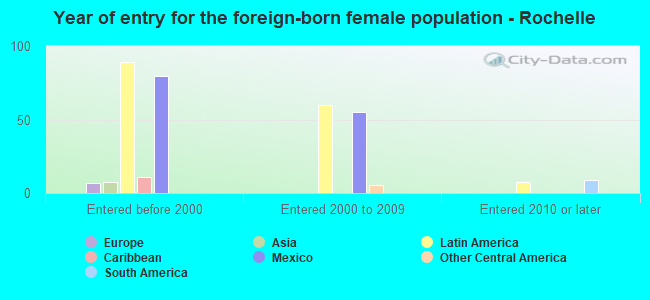
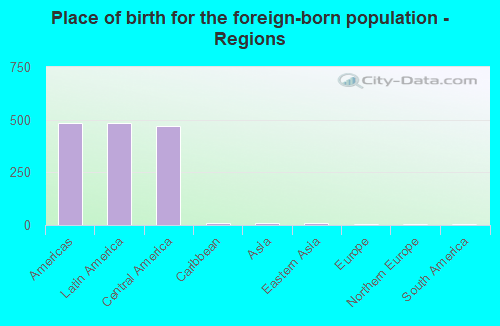
Foreign-born residents in Rochelle 499 residents are foreign born (5.1% Latin America ).
This city:
5.4%Illinois:
14.1%
Marital status for residents in Rochelle Marital status - White (Caucasian) population 15 years and over
Males 44.5% Never married34.3% Now married1.2% Separated3.3% Widowed16.7% DivorcedFemales 28.1% Never married33.6% Now married2.3% Separated14.2% Widowed21.8% DivorcedWomen who gave birth in the past 12 months Now married:
61.9% (107)Unmarried:
38.1% (66)
Women who did not give birth in the past 12 months Now married:
32.7% (428)Unmarried:
67.3% (879)
Marital status - Black or African American population 15 years and over
Males 94.5% Never married5.5% Now married0.0% Separated0.0% Widowed0.0% DivorcedFemales 32.3% Never married7.7% Now married0.0% Separated23.1% Widowed36.9% DivorcedWomen who did not give birth in the past 12 months Now married:
10.4% (5)Unmarried:
89.6% (41)
Marital status - American Indian / Alaska Native population 15 years and over
Males 61.4% Never married38.6% Now married0.0% Separated0.0% Widowed0.0% DivorcedFemales 34.1% Never married65.9% Now married0.0% Separated0.0% Widowed0.0% DivorcedWomen who did not give birth in the past 12 months Now married:
65.9% (48)Unmarried:
34.1% (25)
Marital status - Other race population 15 years and over
Males 70.8% Never married25.0% Now married0.0% Separated0.0% Widowed4.2% DivorcedFemales 31.4% Never married28.6% Now married0.0% Separated0.0% Widowed40.0% DivorcedWomen who gave birth in the past 12 months Now married:
100.0% (6)Unmarried:
0.0% (0)
Marital status - Two or more races population 15 years and over
Males 47.0% Never married43.7% Now married0.6% Separated0.0% Widowed8.7% DivorcedFemales 45.8% Never married25.0% Now married0.0% Separated22.0% Widowed7.2% DivorcedWomen who did not give birth in the past 12 months Now married:
21.2% (126)Unmarried:
78.8% (469)
Marital status - White alone, not Hispanic / Latino population 15 years and over
Males 42.8% Never married33.5% Now married1.4% Separated3.7% Widowed18.6% DivorcedFemales 28.6% Never married31.9% Now married2.7% Separated16.1% Widowed20.7% DivorcedWomen who gave birth in the past 12 months Now married:
79.6% (37)Unmarried:
20.4% (10)
Women who did not give birth in the past 12 months Now married:
28.0% (349)Unmarried:
72.0% (898)
Marital status - Hispanic or Latino population 15 years and over
Males 52.2% Never married42.5% Now married0.0% Separated0.0% Widowed5.3% DivorcedFemales 29.8% Never married37.7% Now married0.0% Separated15.0% Widowed17.5% DivorcedWomen who gave birth in the past 12 months Now married:
57.3% (87)Unmarried:
42.7% (65)
Women who did not give birth in the past 12 months Now married:
47.7% (214)Unmarried:
52.3% (234)
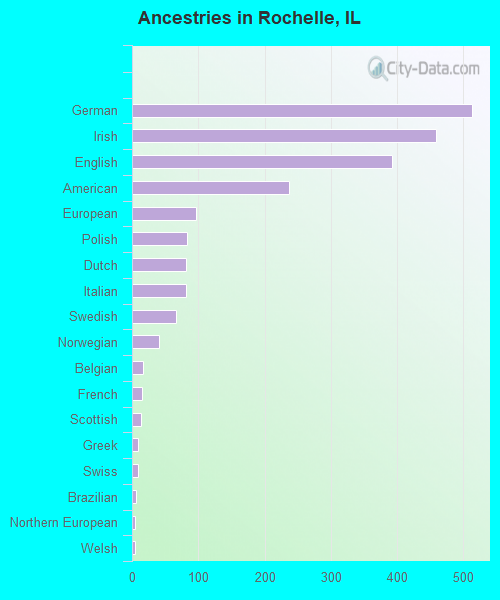
Ancestries in Rochelle
513 13.5% German459 12.1% Irish392 10.3% English237 6.2% American96 2.5% European83 2.2% Polish82 2.2% Dutch81 2.1% Italian67 1.8% Swedish41 1.1% Norwegian17 0.4% Belgian15 0.4% French14 0.4% Scottish9 0.2% Greek9 0.2% Swiss6 0.2% Brazilian5 0.1% Northern European5 0.1% Welsh4 0.1% Scandinavian4 0.1% Scotch-Irish2 0.05% Czech
Children Nativity (place of birth) in Rochelle
Children under 6 years - Living with two parents Both parents native 228 100.0% NativeOne native, one foreign-born parent 46 100.0% NativeChildren under 6 years - Living with one parent Native parent 207 100.0% NativeChildren 6 to 17 years - Living with two parents Both parents native 537 100.0% NativeBoth parents foreign-born 13 100.0% NativeOne native, one foreign-born parent 108 100.0% NativeChildren 6 to 17 years - Living with one parent Native parent 582 100.0% NativeForeign-born parent 47 49.8% Native47 50.2% Foreign-born
Grandparents responsible for own grandchildren in Rochelle
Grandparents (30 to 59 years) White / Caucasian 32 100.0% Not responsible for grandchildrenBlack or African American 4 47.9% Responsible for grandchildren4 52.1% Not responsible for grandchildrenWhite alone, not Hispanic / Latino 9 100.0% Not responsible for grandchildrenHispanic or Latino 38 100.0% Not responsible for grandchildrenGrandparents (60 years and over) White / Caucasian 6 53.6% Responsible for grandchildren5 46.4% Not responsible for grandchildrenWhite alone, not Hispanic / Latino 7 52.5% Responsible for grandchildren6 47.5% Not responsible for grandchildren