Races in Rose Hill, Virginia (VA) Detailed Stats
Data:
Races - White alone (%)
Races - White alone (% change since 2000)
Races - Black alone (%)
Races - Black alone (% change since 2000)
Races - American Indian alone (%)
Races - American Indian alone (% change since 2000)
Races - Asian alone (%)
Races - Asian alone (% change since 2000)
Races - Hispanic (%)
Races - Hispanic (% change since 2000)
Races - Native Hawaiian and Other Pacific Islander alone (%)
Races - Native Hawaiian and Other Pacific Islander alone (% change since 2000)
Races - Two or more races(%)
Races - Two or more races(% change since 2000)
Races - Other race alone (%)
Races - Other race alone (% change since 2000)
Racial diversity
Place of birth - Born in state of residence (%)
Place of birth - Born in state of residence (%) - White
Place of birth - Born in state of residence (%) - Black or African American
Place of birth - Born in state of residence (%) - Asian
Place of birth - Born in state of residence (%) - Hispanic or Latino
Place of birth - Born in state of residence (%) - American Indian and Alaska Native
Place of birth - Born in state of residence (%) - Multirace
Place of birth - Born in state of residence (%) - Other Race
Place of birth - Born in other state (%)
Place of birth - Born in other state (%) - White
Place of birth - Born in other state (%) - Black or African American
Place of birth - Born in other state (%) - Asian
Place of birth - Born in other state (%) - Hispanic or Latino
Place of birth - Born in other state (%) - American Indian and Alaska Native
Place of birth - Born in other state (%) - Multirace
Place of birth - Born in other state (%) - Other Race
Place of birth - Native, outside of US (%)
Place of birth - Native, outside of US (%) - White
Place of birth - Native, outside of US (%) - Black or African American
Place of birth - Native, outside of US (%) - Asian
Place of birth - Native, outside of US (%) - Hispanic or Latino
Place of birth - Native, outside of US (%) - American Indian and Alaska Native
Place of birth - Native, outside of US (%) - Multirace
Place of birth - Native, outside of US (%) - Other Race
Place of birth - Foreign born (%)
Place of birth - Foreign born (%) - White
Place of birth - Foreign born (%) - Black or African American
Place of birth - Foreign born (%) - Asian
Place of birth - Foreign born (%) - Hispanic or Latino
Place of birth - Foreign born (%) - American Indian and Alaska Native
Place of birth - Foreign born (%) - Multirace
Place of birth - Foreign born (%) - Other Race
Residents speaking English at home (%)
Residents speaking English at home - Born in the United States (%)
Residents speaking English at home - Native, born elsewhere (%)
Residents speaking English at home - Foreign born (%)
Residents speaking Spanish at home (%)
Residents speaking Spanish at home - Born in the United States (%)
Residents speaking Spanish at home - Native, born elsewhere (%)
Residents speaking Spanish at home - Foreign born (%)
Residents speaking other language at home (%)
Residents speaking other language at home - Born in the United States (%)
Residents speaking other language at home - Native, born elsewhere (%)
Residents speaking other language at home - Foreign born (%)
Marital status - Never married (%)
Marital status - Now married (%)
Marital status - Separated (%)
Marital status - Widowed (%)
Marital status - Divorced (%)
Ancestries Reported - Arab (%)
Ancestries Reported - Czech (%)
Ancestries Reported - Danish (%)
Ancestries Reported - Dutch (%)
Ancestries Reported - English (%)
Ancestries Reported - French (%)
Ancestries Reported - French Canadian (%)
Ancestries Reported - German (%)
Ancestries Reported - Greek (%)
Ancestries Reported - Hungarian (%)
Ancestries Reported - Irish (%)
Ancestries Reported - Italian (%)
Ancestries Reported - Lithuanian (%)
Ancestries Reported - Norwegian (%)
Ancestries Reported - Polish (%)
Ancestries Reported - Portuguese (%)
Ancestries Reported - Russian (%)
Ancestries Reported - Scotch-Irish (%)
Ancestries Reported - Scottish (%)
Ancestries Reported - Slovak (%)
Ancestries Reported - Subsaharan African (%)
Ancestries Reported - Swedish (%)
Ancestries Reported - Swiss (%)
Ancestries Reported - Ukrainian (%)
Ancestries Reported - United States (%)
Ancestries Reported - Welsh (%)
Ancestries Reported - West Indian (%)
Ancestries Reported - Other (%)
Geographical mobility - Same house 1 year ago (%)
Geographical mobility - Same house 1 year ago (%) - White
Geographical mobility - Same house 1 year ago (%) - Black or African American
Geographical mobility - Same house 1 year ago (%) - Asian
Geographical mobility - Same house 1 year ago (%) - Hispanic or Latino
Geographical mobility - Same house 1 year ago (%) - American Indian and Alaska Native
Geographical mobility - Same house 1 year ago (%) - Multirace
Geographical mobility - Same house 1 year ago (%) - Other Race
Geographical mobility - Moved within same county (%)
Geographical mobility - Moved within same county (%) - White
Geographical mobility - Moved within same county (%) - Black or African American
Geographical mobility - Moved within same county (%) - Asian
Geographical mobility - Moved within same county (%) - Hispanic or Latino
Geographical mobility - Moved within same county (%) - American Indian and Alaska Native
Geographical mobility - Moved within same county (%) - Multirace
Geographical mobility - Moved within same county (%) - Other Race
Geographical mobility - Moved from different county within same state (%)
Geographical mobility - Moved from different county within same state (%) - White
Geographical mobility - Moved from different county within same state (%) - Black or African American
Geographical mobility - Moved from different county within same state (%) - Asian
Geographical mobility - Moved from different county within same state (%) - Hispanic or Latino
Geographical mobility - Moved from different county within same state (%) - American Indian and Alaska Native
Geographical mobility - Moved from different county within same state (%) - Multirace
Geographical mobility - Moved from different county within same state (%) - Other Race
Geographical mobility - Moved from different state (%)
Geographical mobility - Moved from different state (%) - White
Geographical mobility - Moved from different state (%) - Black or African American
Geographical mobility - Moved from different state (%) - Asian
Geographical mobility - Moved from different state (%) - Hispanic or Latino
Geographical mobility - Moved from different state (%) - American Indian and Alaska Native
Geographical mobility - Moved from different state (%) - Multirace
Geographical mobility - Moved from different state (%) - Other Race
Geographical mobility - Moved from abroad (%)
Geographical mobility - Moved from abroad (%) - White
Geographical mobility - Moved from abroad (%) - Black or African American
Geographical mobility - Moved from abroad (%) - Asian
Geographical mobility - Moved from abroad (%) - Hispanic or Latino
Geographical mobility - Moved from abroad (%) - American Indian and Alaska Native
Geographical mobility - Moved from abroad (%) - Multirace
Geographical mobility - Moved from abroad (%) - Other Race
Place of birth for the foreign-born population - Ireland (%)
Place of birth for the foreign-born population - Denmark (%)
Place of birth for the foreign-born population - Norway (%)
Place of birth for the foreign-born population - Sweden (%)
Place of birth for the foreign-born population - United Kingdom (%)
Place of birth for the foreign-born population - England (%)
Place of birth for the foreign-born population - Scotland (%)
Place of birth for the foreign-born population - Other Northern Europe (%)
Place of birth for the foreign-born population - Austria (%)
Place of birth for the foreign-born population - Belgium (%)
Place of birth for the foreign-born population - France (%)
Place of birth for the foreign-born population - Germany (%)
Place of birth for the foreign-born population - Netherlands (%)
Place of birth for the foreign-born population - Switzerland (%)
Place of birth for the foreign-born population - Other Western Europe (%)
Place of birth for the foreign-born population - Greece (%)
Place of birth for the foreign-born population - Italy (%)
Place of birth for the foreign-born population - Portugal (%)
Place of birth for the foreign-born population - Spain (%)
Place of birth for the foreign-born population - Other Southern Europe (%)
Place of birth for the foreign-born population - Albania (%)
Place of birth for the foreign-born population - Belarus (%)
Place of birth for the foreign-born population - Bosnia and Herzegovina (%)
Place of birth for the foreign-born population - Bulgaria (%)
Place of birth for the foreign-born population - Croatia (%)
Place of birth for the foreign-born population - Czechoslovakia (%)
Place of birth for the foreign-born population - Hungary (%)
Place of birth for the foreign-born population - Latvia (%)
Place of birth for the foreign-born population - Lithuania (%)
Place of birth for the foreign-born population - North Macedonia (Macedonia) (%)
Place of birth for the foreign-born population - Moldova (%)
Place of birth for the foreign-born population - Poland (%)
Place of birth for the foreign-born population - Romania (%)
Place of birth for the foreign-born population - Russia (%)
Place of birth for the foreign-born population - Serbia (%)
Place of birth for the foreign-born population - Ukraine (%)
Place of birth for the foreign-born population - Other Eastern Europe (%)
Place of birth for the foreign-born population - China (%)
Place of birth for the foreign-born population - Hong Kong (%)
Place of birth for the foreign-born population - Taiwan (%)
Place of birth for the foreign-born population - Japan (%)
Place of birth for the foreign-born population - Korea (%)
Place of birth for the foreign-born population - Other Eastern Asia (%)
Place of birth for the foreign-born population - Afghanistan (%)
Place of birth for the foreign-born population - Bangladesh (%)
Place of birth for the foreign-born population - India (%)
Place of birth for the foreign-born population - Iran (%)
Place of birth for the foreign-born population - Kazakhstan (%)
Place of birth for the foreign-born population - Nepal (%)
Place of birth for the foreign-born population - Pakistan (%)
Place of birth for the foreign-born population - Sri Lanka (%)
Place of birth for the foreign-born population - Uzbekistan (%)
Place of birth for the foreign-born population - Other South Central Asia (%)
Place of birth for the foreign-born population - Burma (%)
Place of birth for the foreign-born population - Cambodia (%)
Place of birth for the foreign-born population - Indonesia (%)
Place of birth for the foreign-born population - Laos (%)
Place of birth for the foreign-born population - Malaysia (%)
Place of birth for the foreign-born population - Philippines (%)
Place of birth for the foreign-born population - Singapore (%)
Place of birth for the foreign-born population - Thailand (%)
Place of birth for the foreign-born population - Vietnam (%)
Place of birth for the foreign-born population - Other South Eastern Asia (%)
Place of birth for the foreign-born population - Armenia (%)
Place of birth for the foreign-born population - Iraq (%)
Place of birth for the foreign-born population - Israel (%)
Place of birth for the foreign-born population - Jordan (%)
Place of birth for the foreign-born population - Kuwait (%)
Place of birth for the foreign-born population - Lebanon (%)
Place of birth for the foreign-born population - Saudi Arabia (%)
Place of birth for the foreign-born population - Syria (%)
Place of birth for the foreign-born population - Turkey (%)
Place of birth for the foreign-born population - Yemen (%)
Place of birth for the foreign-born population - Other Western Asia (%)
Place of birth for the foreign-born population - Eritrea (%)
Place of birth for the foreign-born population - Ethiopia (%)
Place of birth for the foreign-born population - Kenya (%)
Place of birth for the foreign-born population - Somalia (%)
Place of birth for the foreign-born population - Uganda (%)
Place of birth for the foreign-born population - Zimbabwe (%)
Place of birth for the foreign-born population - Other Eastern Africa (%)
Place of birth for the foreign-born population - Cameroon (%)
Place of birth for the foreign-born population - Congo (%)
Place of birth for the foreign-born population - Democratic Republic of Congo (Zaire) (%)
Place of birth for the foreign-born population - Other Middle Africa (%)
Place of birth for the foreign-born population - Egypt (%)
Place of birth for the foreign-born population - Morocco (%)
Place of birth for the foreign-born population - Sudan (%)
Place of birth for the foreign-born population - Other Northern Africa (%)
Place of birth for the foreign-born population - South Africa (%)
Place of birth for the foreign-born population - Other Southern Africa (%)
Place of birth for the foreign-born population - Cabo Verde (%)
Place of birth for the foreign-born population - Ghana (%)
Place of birth for the foreign-born population - Liberia (%)
Place of birth for the foreign-born population - Nigeria (%)
Place of birth for the foreign-born population - Senegal (%)
Place of birth for the foreign-born population - Sierra Leone (%)
Place of birth for the foreign-born population - Other Western Africa (%)
Place of birth for the foreign-born population - Australia (%)
Place of birth for the foreign-born population - New Zealand (%)
Place of birth for the foreign-born population - Fiji (%)
Place of birth for the foreign-born population - Micronesia (%)
Place of birth for the foreign-born population - Bahamas (%)
Place of birth for the foreign-born population - Barbados (%)
Place of birth for the foreign-born population - Cuba (%)
Place of birth for the foreign-born population - Dominica (%)
Place of birth for the foreign-born population - Dominican Republic (%)
Place of birth for the foreign-born population - Grenada (%)
Place of birth for the foreign-born population - Haiti (%)
Place of birth for the foreign-born population - Jamaica (%)
Place of birth for the foreign-born population - St. Vincent and the Grenadines (%)
Place of birth for the foreign-born population - Trinidad and Tobago (%)
Place of birth for the foreign-born population - West Indies (%)
Place of birth for the foreign-born population - Other Caribbean (%)
Place of birth for the foreign-born population - Belize (%)
Place of birth for the foreign-born population - Costa Rica (%)
Place of birth for the foreign-born population - El Salvador (%)
Place of birth for the foreign-born population - Guatemala (%)
Place of birth for the foreign-born population - Honduras (%)
Place of birth for the foreign-born population - Mexico (%)
Place of birth for the foreign-born population - Nicaragua (%)
Place of birth for the foreign-born population - Panama (%)
Place of birth for the foreign-born population - Other Central America (%)
Place of birth for the foreign-born population - Argentina (%)
Place of birth for the foreign-born population - Bolivia (%)
Place of birth for the foreign-born population - Brazil (%)
Place of birth for the foreign-born population - Chile (%)
Place of birth for the foreign-born population - Colombia (%)
Place of birth for the foreign-born population - Ecuador (%)
Place of birth for the foreign-born population - Guyana (%)
Place of birth for the foreign-born population - Peru (%)
Place of birth for the foreign-born population - Uruguay (%)
Place of birth for the foreign-born population - Venezuela (%)
Place of birth for the foreign-born population - Other South America (%)
Place of birth for the foreign-born population - Canada (%)
Place of birth for the foreign-born population - Other Northern America (%)
Place of birth for the foreign-born population - Other (%)
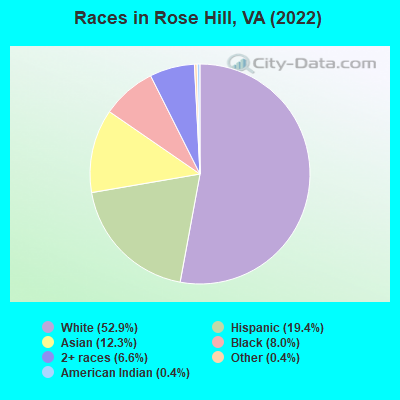
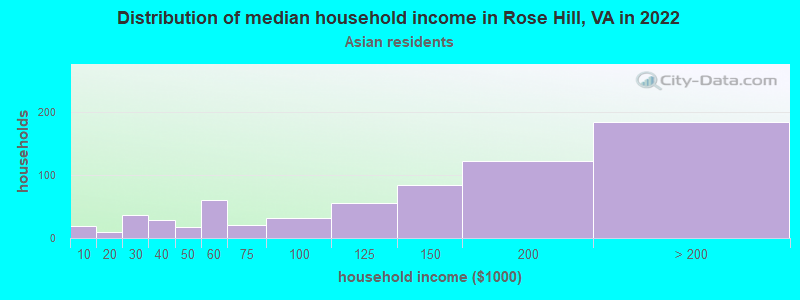
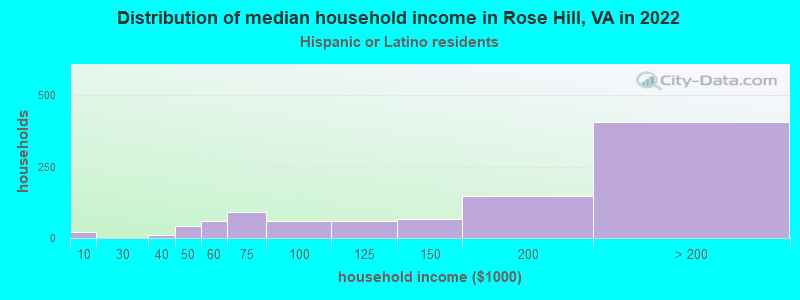
According to 2022 data, the most numerous races in Rose Hill, VA are White alone (11,140 residents), Black alone (1,676 residents), and Hispanic (4,083 residents). 68.2% of Rose Hill residents speak English at home. 22.9% of Rose Hill, VA residents are foreign-born (10.0% born in Latin America, 8.8% born in Asia), which is 47.7% greater than the foreign-born rate of 12.0% across the entire state of Virginia.
Race distribution in Rose Hill
2000 2022
4,965,637 70.2% White alone 1,376,378 19.4% Black alone 329,540 4.7% Hispanic 259,277 3.7% Asian alone 114,022 1.6% Two or more races 18,596 0.3% American Indian alone 11,685 0.2% Other race alone 3,380 0.05% Native Hawaiian and Other
5,095,130 58.7% White alone 1,594,785 18.4% Black alone 905,750 10.4% Hispanic 602,881 6.9% Asian alone 406,047 4.7% Two or more races 60,419 0.7% Other race alone 11,738 0.1% American Indian alone 6,869 0.08% Native Hawaiian and Other
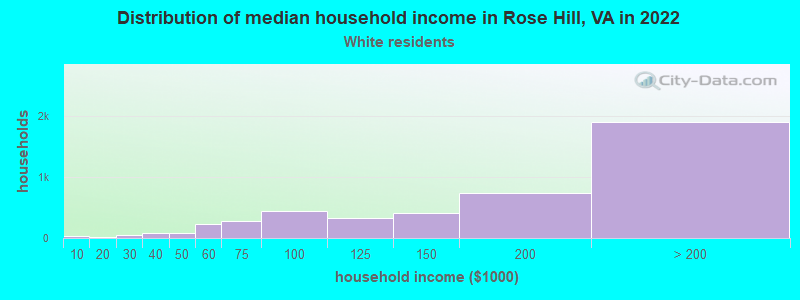
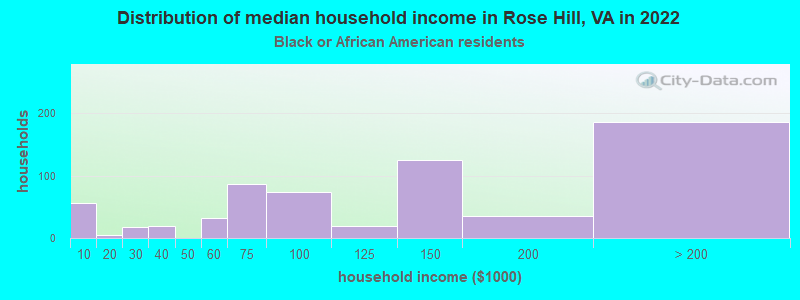
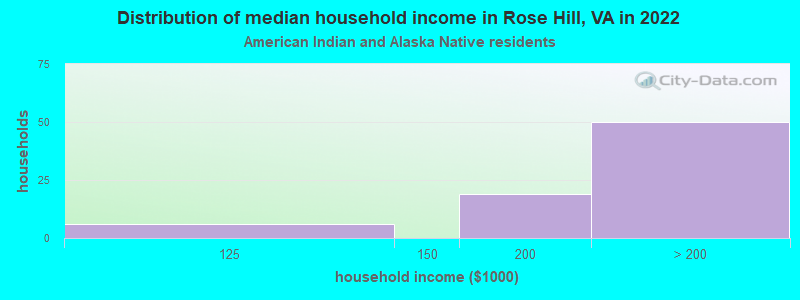
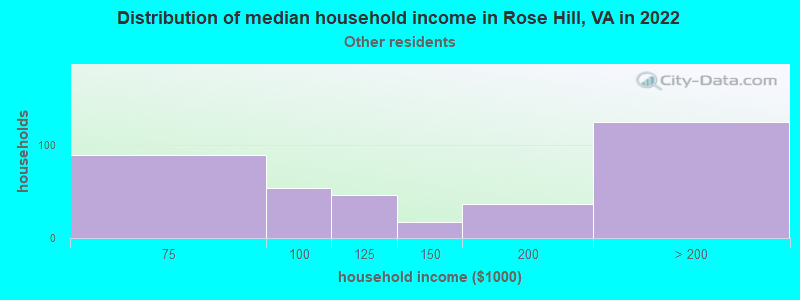
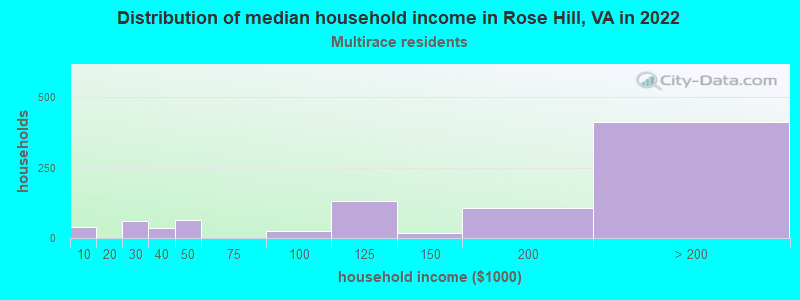
Income and house value in Rose Hill Median household income in 2022 $167,703 White non-Hispanic householders$110,280 Black householders$176,213 American Indian and Alaska Native householders$136,581 Asian householders$122,073 Some other race householders$182,268 Two or more races householders$159,974 Hispanic or Latino race householdersMedian 2022 house value $676,841 White Non-Hispanic householders$713,716 Black or African American householders$586,894 American Indian or Alaska Native householders $622,390 Asian householders$575,177 Some other race householders$549,330 Two or more races householders$607,572 Hispanic or Latino householders
Median age by race in Rose Hill
41.0 Median age for White residents41.3 40.6 39.9 Median age for Black or African American residents34.9 43.5 34.8 Median age for American Indian / Alaska Native residents76.0 30.6 38.2 Median age for Asian residents37.7 38.5 -666,666,666.0 Median age for Native Hawaiian / Pacific Islander residents-558,791,801.0 -584,518,166.9 41.6 Median age for Other race residents41.6 41.7 30.9 Median age for Two or more races residents31.5 30.3 42.0 Median age for White alone residents42.1 41.8 35.6 Median age for Hispanic or Latino residents36.4 34.7
Owner/renter occupied households by race in Rose Hill
House owners and renters - White residents 3,872 83.7% Owner occupied756 16.3% Renter occupiedHouse owners and renters - Black or African American residents 294 47.4% Owner occupied327 52.6% Renter occupiedHouse owners and renters - American Indian / Alaska Native residents 93 94.2% Owner occupied6 5.8% Renter occupiedHouse owners and renters - Asian residents 606 89.5% Owner occupied71 10.5% Renter occupiedHouse owners and renters - Native Hawaiian / Pacific Islander residents 11 100.0% Renter occupiedHouse owners and renters - Other race residents 324 89.9% Owner occupied37 10.1% Renter occupiedHouse owners and renters - Two or more races residents 675 78.8% Owner occupied181 21.2% Renter occupiedHouse owners and renters - White alone residents 3,782 83.6% Owner occupied742 16.4% Renter occupiedHouse owners and renters - Hispanic or Latino residents 792 86.5% Owner occupied124 13.5% Renter occupied
Language usage in Rose Hill
English speakers - Total 68.2% of residents of Rose Hill speak English at home.
16.4% of residents speak Spanish at home 1,706 54.6% Speak English very well1,416 45.4% Speak English less than very well15.5% of residents speak other language at home 1,932 65.4% Speak English very well1,021 34.6% Speak English less than very well
English speakers - Born in the United States 91.7% of residents of Rose Hill speak English at home.
6.2% of residents speak Spanish at home 320 60.4% Speak English very well210 39.6% Speak English less than very well2.8% of residents speak other language at home 233 97.9% Speak English very well5 2.1% Speak English less than very well
English speakers - Native, born elsewhere 59.9% of residents of Rose Hill speak English at home.
33.0% of residents speak Spanish at home 195 85.2% Speak English very well34 14.8% Speak English less than very well5.5% of residents speak other language at home 33 86.8% Speak English very well5 13.2% Speak English less than very well
English speakers - Foreign-born 17.6% of residents of Rose Hill speak English at home.
37.2% of residents speak Spanish at home 705 39.3% Speak English very well1,089 60.7% Speak English less than very well45.5% of residents speak other language at home 1,257 57.3% Speak English very well938 42.7% Speak English less than very well
White (Caucasian) - Speak only English Native:
94.3% (9,575)Foreign-born:
22.5% (225)
White (Caucasian) - Speak another language Native:
5.9% (598)Foreign-born:
76.4% (763)
Black or African American - Speak only English Native:
92.1% (961)Foreign-born:
54.4% (312)
Black or African American - Speak another language Native:
7.1% (74)Foreign-born:
52.6% (302)
American Indian / Alaska Native - Speak another language Native:
75.3% (163)Foreign-born:
100.0% (164)
Asian - Speak only English Native:
35.1% (180)Foreign-born:
15.5% (251)
Asian - Speak another language Native:
66.1% (339)Foreign-born:
84.8% (1,370)
Other race - Speak only English Native:
24.8% (129)Foreign-born:
1.0% (8)
Other race - Speak another language Native:
69.6% (362)Foreign-born:
97.4% (765)
Two or more races - Speak only English Native:
67.6% (1,140)Foreign-born:
9.7% (66)
Two or more races - Speak another language Native:
32.8% (553)Foreign-born:
90.3% (620)
White alone - Speak only English Native:
96.5% (9,407)Foreign-born:
30.1% (185)
White alone - Speak another language Native:
3.7% (358)Foreign-born:
70.2% (430)
Hispanic or Latino - Speak only English Native:
34.5% (631)Foreign-born:
4.6% (87)
Hispanic or Latino - Speak another language Native:
63.3% (1,155)Foreign-born:
95.4% (1,824)
Foreign-born residents in Rose Hill 4,831 residents are foreign born (10.0% Latin America , 8.8% Asia ).
This city:
22.9%Virginia:
12.6%
Marital status for residents in Rose Hill Marital status - White (Caucasian) population 15 years and over
Males 25.0% Never married63.3% Now married1.9% Separated2.0% Widowed7.8% DivorcedFemales 22.7% Never married58.5% Now married2.8% Separated6.6% Widowed9.5% DivorcedWomen who gave birth in the past 12 months Now married:
82.6% (160)Unmarried:
17.4% (34)
Women who did not give birth in the past 12 months Now married:
61.6% (1,570)Unmarried:
38.4% (980)
Marital status - Black or African American population 15 years and over
Males 40.1% Never married52.7% Now married1.0% Separated3.9% Widowed2.2% DivorcedFemales 41.5% Never married41.0% Now married0.0% Separated6.1% Widowed11.5% DivorcedWomen who did not give birth in the past 12 months Now married:
41.1% (172)Unmarried:
58.9% (246)
Marital status - American Indian / Alaska Native population 15 years and over
Males 44.2% Never married55.8% Now married0.0% Separated0.0% Widowed0.0% DivorcedFemales 18.7% Never married81.2% Now married0.0% Separated0.0% Widowed0.0% DivorcedWomen who did not give birth in the past 12 months Now married:
71.9% (98)Unmarried:
28.1% (38)
Marital status - Asian population 15 years and over
Males 41.6% Never married50.8% Now married2.3% Separated1.9% Widowed3.4% DivorcedFemales 15.0% Never married70.0% Now married0.5% Separated8.1% Widowed6.4% DivorcedWomen who gave birth in the past 12 months Now married:
100.0% (20)Unmarried:
0.0% (0)
Women who did not give birth in the past 12 months Now married:
64.4% (307)Unmarried:
35.6% (170)
Marital status - Native Hawaiian / Pacific Islander population 15 years and over
Males 0.0% Never married100.0% Now married0.0% Separated0.0% Widowed0.0% DivorcedFemales 100.0% Never married0.0% Now married0.0% Separated0.0% Widowed0.0% DivorcedWomen who did not give birth in the past 12 months Now married:
0.0% (0)Unmarried:
100.0% (12)
Marital status - Other race population 15 years and over
Males 31.1% Never married63.9% Now married1.7% Separated0.0% Widowed3.4% DivorcedFemales 16.7% Never married66.1% Now married0.0% Separated13.8% Widowed3.5% DivorcedWomen who did not give birth in the past 12 months Now married:
73.8% (280)Unmarried:
26.2% (100)
Marital status - Two or more races population 15 years and over
Males 47.6% Never married47.2% Now married0.0% Separated0.0% Widowed5.2% DivorcedFemales 35.4% Never married41.7% Now married1.7% Separated2.3% Widowed18.9% DivorcedWomen who gave birth in the past 12 months Now married:
41.0% (57)Unmarried:
59.0% (83)
Women who did not give birth in the past 12 months Now married:
42.7% (279)Unmarried:
57.3% (376)
Marital status - White alone, not Hispanic / Latino population 15 years and over
Males 23.3% Never married65.5% Now married2.2% Separated1.5% Widowed7.6% DivorcedFemales 21.9% Never married57.9% Now married2.8% Separated7.4% Widowed10.0% DivorcedWomen who gave birth in the past 12 months Now married:
78.4% (134)Unmarried:
21.6% (37)
Women who did not give birth in the past 12 months Now married:
61.3% (1,421)Unmarried:
38.7% (899)
Marital status - Hispanic or Latino population 15 years and over
Males 37.5% Never married53.9% Now married0.5% Separated2.3% Widowed5.8% DivorcedFemales 27.3% Never married59.6% Now married0.9% Separated4.8% Widowed7.4% DivorcedWomen who gave birth in the past 12 months Now married:
87.3% (62)Unmarried:
12.7% (9)
Women who did not give birth in the past 12 months Now married:
60.6% (659)Unmarried:
39.4% (429)
Ancestries in Rose Hill
859 7.9% English633 5.8% Irish523 4.8% American487 4.5% German422 3.9% European195 1.8% Italian111 1.0% Polish98 0.9% Dutch94 0.9% Ghanaian92 0.8% Ethiopian91 0.8% Ukrainian80 0.7% Scotch-Irish75 0.7% French66 0.6% Greek56 0.5% Moroccan52 0.5% British46 0.4% Norwegian45 0.4% Celtic39 0.4% French Canadian36 0.3% Afghan36 0.3% Arab35 0.3% Lebanese33 0.3% Welsh32 0.3% Syrian32 0.3% Turkish30 0.3% Egyptian30 0.3% Danish30 0.3% African28 0.3% Palestinian24 0.2% Jamaican24 0.2% Austrian23 0.2% Scottish22 0.2% Australian20 0.2% Swiss18 0.2% Brazilian14 0.1% Serbian13 0.1% Romanian12 0.1% Iranian10 0.09% Slovak9 0.08% Latvian8 0.07% Slavic3 0.03% Croatian3 0.03% Sudanese3 0.03% Northern European
Geographical mobility in Rose Hill Same house 1 year ago 10,498 89.3% White (Caucasian)1,334 80.5% Black or African American325 89.5% American Indian / Alaska Native2,236 85.9% Asian13 38.8% Native Hawaiian / Pacific Islander1,435 97.7% Other race2,016 72.6% Two or more races9,738 88.3% White alone, not Hispanic / Latino3,619 89.8% Hispanic or LatinoMoved within same county 414 3.5% White / Caucasian125 7.5% Black or African American12 3.4% American Indian / Alaska Native130 5.0% Asian6 0.4% Other race426 15.4% Two or more races441 4.0% White alone, not Hispanic / Latino72 1.8% Hispanic or LatinoMoved within same state 301 2.6% White / Caucasian79 4.8% Black or African American190 7.3% Asian75 5.1% Other race303 10.9% Two or more races276 2.5% White alone, not Hispanic / Latino200 5.0% Hispanic or LatinoMoved from different state 495 4.2% White / Caucasian69 4.2% Black or African American85 3.1% Two or more races527 4.8% White alone, not Hispanic / Latino59 1.5% Hispanic or LatinoMoved from abroad 52 0.4% White23 6.4% American Indian / Alaska Native45 1.7% Asian16 46.8% Native Hawaiian / Pacific Islander50 1.8% Two or more races48 0.4% White alone, not Hispanic / Latino33 0.8% Hispanic or Latino
Children Nativity (place of birth) in Rose Hill
Children under 6 years - Living with two parents Both parents native 790 100.0% NativeBoth parents foreign-born 492 97.1% Native15 2.9% Foreign-bornOne native, one foreign-born parent 394 100.0% NativeChildren under 6 years - Living with one parent Native parent 255 100.0% NativeForeign-born parent 303 97.7% Native7 2.3% Foreign-bornChildren 6 to 17 years - Living with two parents Both parents native 1,204 98.6% Native17 1.4% Foreign-bornBoth parents foreign-born 395 77.0% Native118 23.0% Foreign-bornOne native, one foreign-born parent 489 100.0% NativeChildren 6 to 17 years - Living with one parent Native parent 387 100.0% NativeForeign-born parent 236 60.7% Native153 39.3% Foreign-born
Grandparents responsible for own grandchildren in Rose Hill
Grandparents (30 to 59 years) White / Caucasian 5 11.9% Responsible for grandchildren37 88.1% Not responsible for grandchildrenBlack or African American 8 100.0% Not responsible for grandchildrenAsian 28 100.0% Not responsible for grandchildrenOther race 36 100.0% Not responsible for grandchildrenTwo or more races 38 100.0% Not responsible for grandchildrenWhite alone, not Hispanic / Latino 9 20.9% Responsible for grandchildren36 79.1% Not responsible for grandchildrenHispanic or Latino 79 100.0% Not responsible for grandchildrenGrandparents (60 years and over) White / Caucasian 30 18.8% Responsible for grandchildren131 81.2% Not responsible for grandchildrenBlack or African American 15 27.8% Responsible for grandchildren40 72.2% Not responsible for grandchildrenAsian 105 100.0% Not responsible for grandchildrenOther race 110 100.0% Not responsible for grandchildrenTwo or more races 134 100.0% Not responsible for grandchildrenWhite alone, not Hispanic / Latino 33 24.8% Responsible for grandchildren101 75.2% Not responsible for grandchildrenHispanic or Latino 264 100.0% Not responsible for grandchildren