Races in Rupert, Vermont (VT) Detailed Stats
Ancestries, Foreign-born residents, place of birth

Recent posts about races in Rupert, Vermont on our local forum with over 2,400,000 registered users:
 | One Day in VT (9 replies) |
1.6% of Rupert, VT residents are foreign-born , which is 156.0% less than the foreign-born rate of 4.0% across the entire state of Vermont.
Race distribution in Rupert

- 69598.7%White alone
- 71.0%Hispanic
- 10.1%Asian alone
- 10.1%American Indian alone

2000
2022
-
- 585,43196.2%White alone
- 6,8091.1%Two or more races
- 5,5040.9%Hispanic
- 5,1600.8%Asian alone
- 2,9210.5%Black alone
- 2,3250.4%American Indian alone
- 5570.09%Other race alone
- 1200.02%Native Hawaiian and Other
Pacific Islander alone

-
- 583,54690.2%White alone
- 27,3404.2%Two or more races
- 14,7702.3%Hispanic
- 11,5121.8%Asian alone
- 6,2641.0%Black alone
- 2,5210.4%Other race alone
- 1,0520.2%American Indian alone
- 590.01%Native Hawaiian and Other
Pacific Islander alone

Income and house value in Rupert
- Median household income in 2022
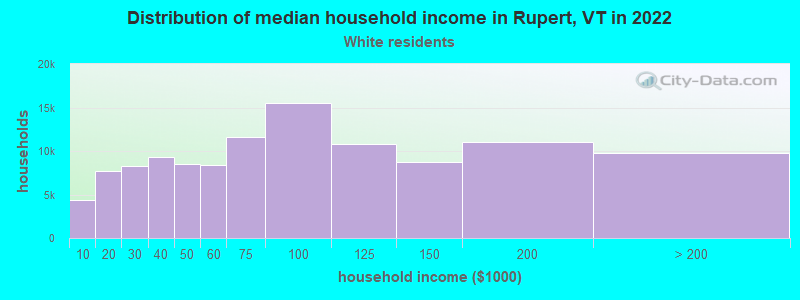
- $65,841White non-Hispanic householders
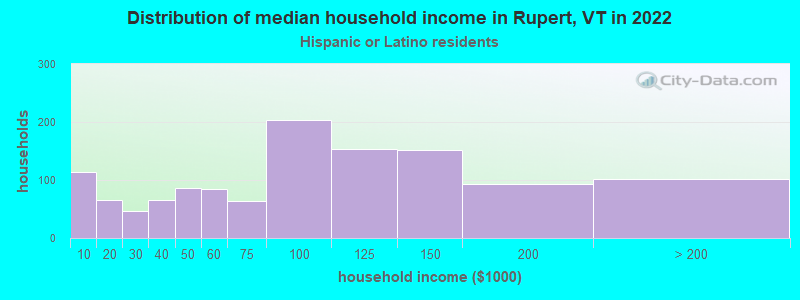
- $18,675Hispanic or Latino race householders
- Median 2022 house value
- $258,858White Non-Hispanic householders
Household income for White non-Hispanic householders
Household income for Hispanic or Latino race householders
Foreign-born residents in Rupert
11 residents are foreign born
| This city: | 1.6% |
| Vermont: | 3.8% |
Ancestries in Rupert

- 10115.5%English
- 8913.7%Irish
- 7110.9%Other
- 6810.5%German
- 6810.5%United States
- 416.3%Scottish
- 416.3%Welsh
- 375.7%French
- 345.2%Scotch-Irish
- 233.5%Italian
- 162.5%French Canadian
- 142.2%Swedish
- 101.5%Dutch
- 91.4%Norwegian
- 81.2%Polish
- 71.1%Russian
- 50.8%Hungarian
- 40.6%Ukrainian
- 20.3%Danish
- 20.3%Slovak

Zip codes: 05251.