Races in Salisbury, New York (NY) Detailed Stats
Data:
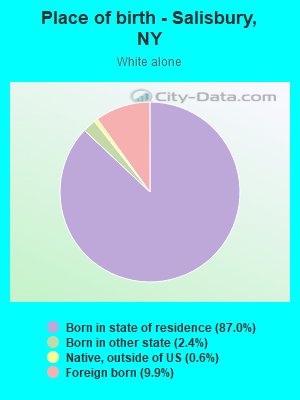
Races - White alone (%)
Races - White alone (% change since 2000)
Races - Black alone (%)
Races - Black alone (% change since 2000)
Races - American Indian alone (%)
Races - American Indian alone (% change since 2000)
Races - Asian alone (%)
Races - Asian alone (% change since 2000)
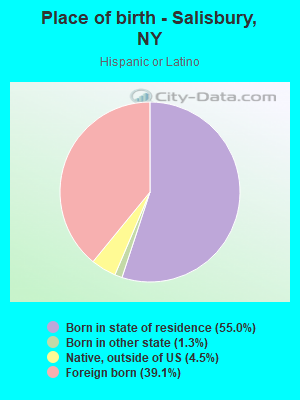
Races - Hispanic (%)
Races - Hispanic (% change since 2000)
Races - Native Hawaiian and Other Pacific Islander alone (%)
Races - Native Hawaiian and Other Pacific Islander alone (% change since 2000)
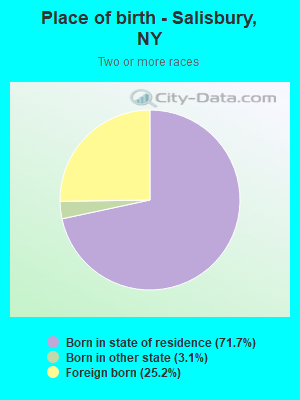
Races - Two or more races(%)
Races - Two or more races(% change since 2000)
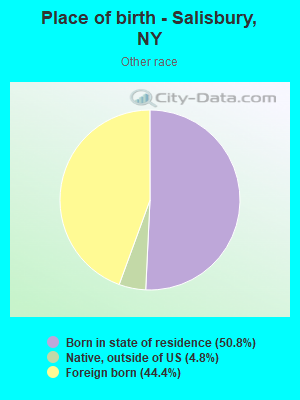
Races - Other race alone (%)
Races - Other race alone (% change since 2000)
Racial diversity
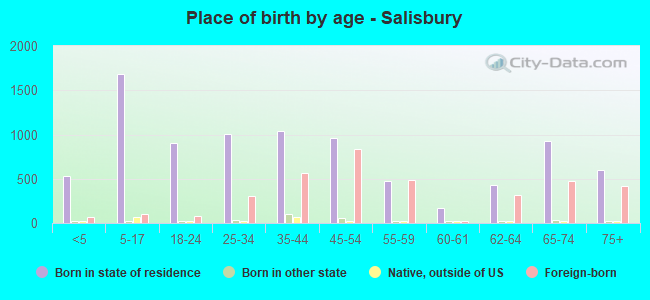
Place of birth - Born in state of residence (%)
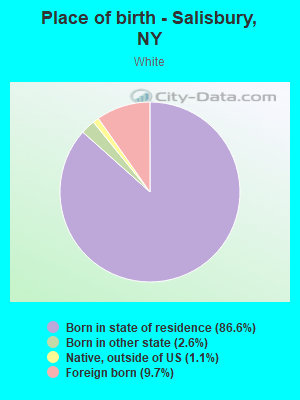
Place of birth - Born in state of residence (%) - White
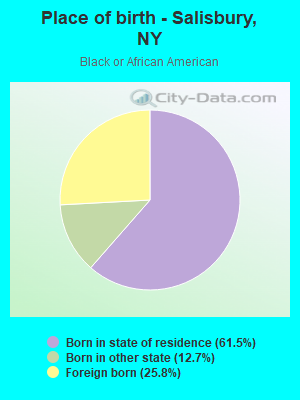
Place of birth - Born in state of residence (%) - Black or African American
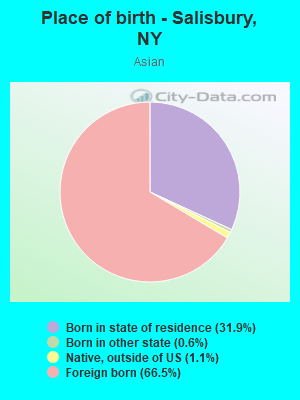
Place of birth - Born in state of residence (%) - Asian
Place of birth - Born in state of residence (%) - Hispanic or Latino
Place of birth - Born in state of residence (%) - American Indian and Alaska Native
Place of birth - Born in state of residence (%) - Multirace
Place of birth - Born in state of residence (%) - Other Race
Place of birth - Born in other state (%)
Place of birth - Born in other state (%) - White
Place of birth - Born in other state (%) - Black or African American
Place of birth - Born in other state (%) - Asian
Place of birth - Born in other state (%) - Hispanic or Latino
Place of birth - Born in other state (%) - American Indian and Alaska Native
Place of birth - Born in other state (%) - Multirace
Place of birth - Born in other state (%) - Other Race
Place of birth - Native, outside of US (%)
Place of birth - Native, outside of US (%) - White
Place of birth - Native, outside of US (%) - Black or African American
Place of birth - Native, outside of US (%) - Asian
Place of birth - Native, outside of US (%) - Hispanic or Latino
Place of birth - Native, outside of US (%) - American Indian and Alaska Native
Place of birth - Native, outside of US (%) - Multirace
Place of birth - Native, outside of US (%) - Other Race
Place of birth - Foreign born (%)
Place of birth - Foreign born (%) - White
Place of birth - Foreign born (%) - Black or African American
Place of birth - Foreign born (%) - Asian
Place of birth - Foreign born (%) - Hispanic or Latino
Place of birth - Foreign born (%) - American Indian and Alaska Native
Place of birth - Foreign born (%) - Multirace
Place of birth - Foreign born (%) - Other Race
Residents speaking English at home (%)
Residents speaking English at home - Born in the United States (%)
Residents speaking English at home - Native, born elsewhere (%)
Residents speaking English at home - Foreign born (%)
Residents speaking Spanish at home (%)
Residents speaking Spanish at home - Born in the United States (%)
Residents speaking Spanish at home - Native, born elsewhere (%)
Residents speaking Spanish at home - Foreign born (%)
Residents speaking other language at home (%)
Residents speaking other language at home - Born in the United States (%)
Residents speaking other language at home - Native, born elsewhere (%)
Residents speaking other language at home - Foreign born (%)
Marital status - Never married (%)
Marital status - Now married (%)
Marital status - Separated (%)
Marital status - Widowed (%)
Marital status - Divorced (%)
Ancestries Reported - Arab (%)
Ancestries Reported - Czech (%)
Ancestries Reported - Danish (%)
Ancestries Reported - Dutch (%)
Ancestries Reported - English (%)
Ancestries Reported - French (%)
Ancestries Reported - French Canadian (%)
Ancestries Reported - German (%)
Ancestries Reported - Greek (%)
Ancestries Reported - Hungarian (%)
Ancestries Reported - Irish (%)
Ancestries Reported - Italian (%)
Ancestries Reported - Lithuanian (%)
Ancestries Reported - Norwegian (%)
Ancestries Reported - Polish (%)
Ancestries Reported - Portuguese (%)
Ancestries Reported - Russian (%)
Ancestries Reported - Scotch-Irish (%)
Ancestries Reported - Scottish (%)
Ancestries Reported - Slovak (%)
Ancestries Reported - Subsaharan African (%)
Ancestries Reported - Swedish (%)
Ancestries Reported - Swiss (%)
Ancestries Reported - Ukrainian (%)
Ancestries Reported - United States (%)
Ancestries Reported - Welsh (%)
Ancestries Reported - West Indian (%)
Ancestries Reported - Other (%)
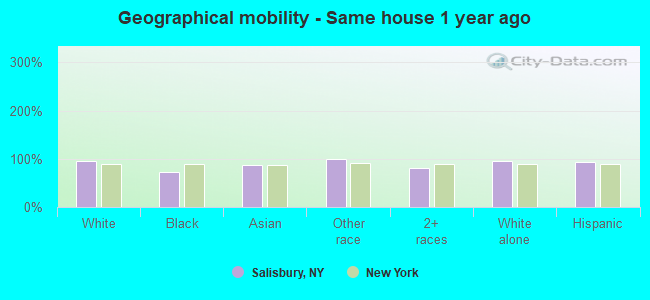
Geographical mobility - Same house 1 year ago (%)
Geographical mobility - Same house 1 year ago (%) - White
Geographical mobility - Same house 1 year ago (%) - Black or African American
Geographical mobility - Same house 1 year ago (%) - Asian
Geographical mobility - Same house 1 year ago (%) - Hispanic or Latino
Geographical mobility - Same house 1 year ago (%) - American Indian and Alaska Native
Geographical mobility - Same house 1 year ago (%) - Multirace
Geographical mobility - Same house 1 year ago (%) - Other Race
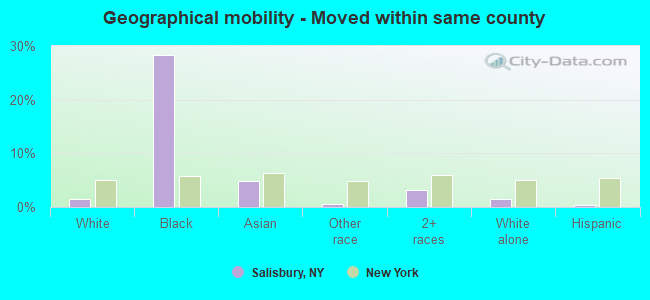
Geographical mobility - Moved within same county (%)
Geographical mobility - Moved within same county (%) - White
Geographical mobility - Moved within same county (%) - Black or African American
Geographical mobility - Moved within same county (%) - Asian
Geographical mobility - Moved within same county (%) - Hispanic or Latino
Geographical mobility - Moved within same county (%) - American Indian and Alaska Native
Geographical mobility - Moved within same county (%) - Multirace
Geographical mobility - Moved within same county (%) - Other Race
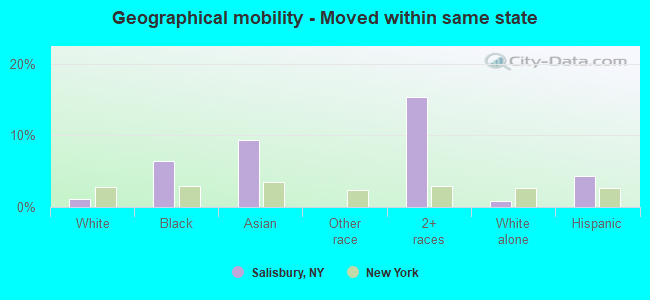
Geographical mobility - Moved from different county within same state (%)
Geographical mobility - Moved from different county within same state (%) - White
Geographical mobility - Moved from different county within same state (%) - Black or African American
Geographical mobility - Moved from different county within same state (%) - Asian
Geographical mobility - Moved from different county within same state (%) - Hispanic or Latino
Geographical mobility - Moved from different county within same state (%) - American Indian and Alaska Native
Geographical mobility - Moved from different county within same state (%) - Multirace
Geographical mobility - Moved from different county within same state (%) - Other Race
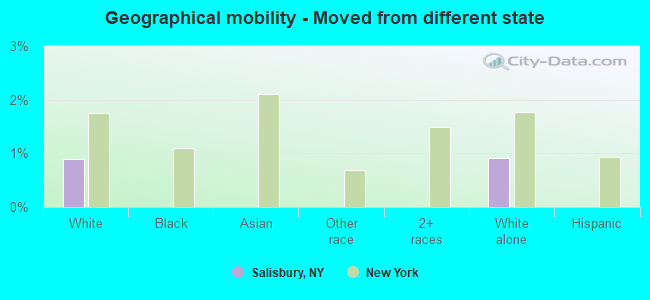
Geographical mobility - Moved from different state (%)
Geographical mobility - Moved from different state (%) - White
Geographical mobility - Moved from different state (%) - Black or African American
Geographical mobility - Moved from different state (%) - Asian
Geographical mobility - Moved from different state (%) - Hispanic or Latino
Geographical mobility - Moved from different state (%) - American Indian and Alaska Native
Geographical mobility - Moved from different state (%) - Multirace
Geographical mobility - Moved from different state (%) - Other Race
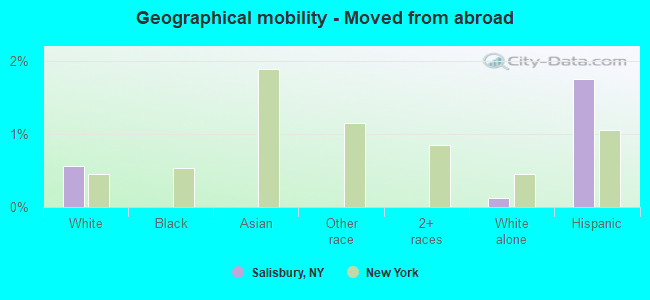
Geographical mobility - Moved from abroad (%)
Geographical mobility - Moved from abroad (%) - White
Geographical mobility - Moved from abroad (%) - Black or African American
Geographical mobility - Moved from abroad (%) - Asian
Geographical mobility - Moved from abroad (%) - Hispanic or Latino
Geographical mobility - Moved from abroad (%) - American Indian and Alaska Native
Geographical mobility - Moved from abroad (%) - Multirace
Geographical mobility - Moved from abroad (%) - Other Race
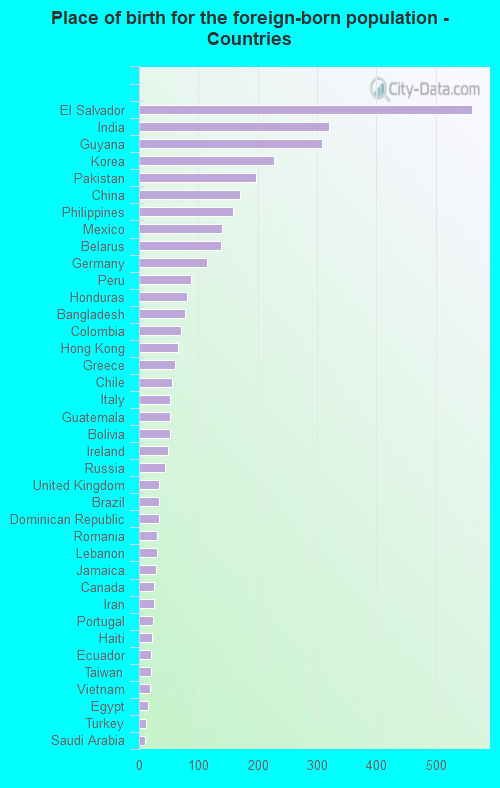
Place of birth for the foreign-born population - Ireland (%)
Place of birth for the foreign-born population - Denmark (%)
Place of birth for the foreign-born population - Norway (%)
Place of birth for the foreign-born population - Sweden (%)
Place of birth for the foreign-born population - United Kingdom (%)
Place of birth for the foreign-born population - England (%)
Place of birth for the foreign-born population - Scotland (%)
Place of birth for the foreign-born population - Other Northern Europe (%)
Place of birth for the foreign-born population - Austria (%)
Place of birth for the foreign-born population - Belgium (%)
Place of birth for the foreign-born population - France (%)
Place of birth for the foreign-born population - Germany (%)
Place of birth for the foreign-born population - Netherlands (%)
Place of birth for the foreign-born population - Switzerland (%)
Place of birth for the foreign-born population - Other Western Europe (%)
Place of birth for the foreign-born population - Greece (%)
Place of birth for the foreign-born population - Italy (%)
Place of birth for the foreign-born population - Portugal (%)
Place of birth for the foreign-born population - Spain (%)
Place of birth for the foreign-born population - Other Southern Europe (%)
Place of birth for the foreign-born population - Albania (%)
Place of birth for the foreign-born population - Belarus (%)
Place of birth for the foreign-born population - Bosnia and Herzegovina (%)
Place of birth for the foreign-born population - Bulgaria (%)
Place of birth for the foreign-born population - Croatia (%)
Place of birth for the foreign-born population - Czechoslovakia (%)
Place of birth for the foreign-born population - Hungary (%)
Place of birth for the foreign-born population - Latvia (%)
Place of birth for the foreign-born population - Lithuania (%)
Place of birth for the foreign-born population - North Macedonia (Macedonia) (%)
Place of birth for the foreign-born population - Moldova (%)
Place of birth for the foreign-born population - Poland (%)
Place of birth for the foreign-born population - Romania (%)
Place of birth for the foreign-born population - Russia (%)
Place of birth for the foreign-born population - Serbia (%)
Place of birth for the foreign-born population - Ukraine (%)
Place of birth for the foreign-born population - Other Eastern Europe (%)
Place of birth for the foreign-born population - China (%)
Place of birth for the foreign-born population - Hong Kong (%)
Place of birth for the foreign-born population - Taiwan (%)
Place of birth for the foreign-born population - Japan (%)
Place of birth for the foreign-born population - Korea (%)
Place of birth for the foreign-born population - Other Eastern Asia (%)
Place of birth for the foreign-born population - Afghanistan (%)
Place of birth for the foreign-born population - Bangladesh (%)
Place of birth for the foreign-born population - India (%)
Place of birth for the foreign-born population - Iran (%)
Place of birth for the foreign-born population - Kazakhstan (%)
Place of birth for the foreign-born population - Nepal (%)
Place of birth for the foreign-born population - Pakistan (%)
Place of birth for the foreign-born population - Sri Lanka (%)
Place of birth for the foreign-born population - Uzbekistan (%)
Place of birth for the foreign-born population - Other South Central Asia (%)
Place of birth for the foreign-born population - Burma (%)
Place of birth for the foreign-born population - Cambodia (%)
Place of birth for the foreign-born population - Indonesia (%)
Place of birth for the foreign-born population - Laos (%)
Place of birth for the foreign-born population - Malaysia (%)
Place of birth for the foreign-born population - Philippines (%)
Place of birth for the foreign-born population - Singapore (%)
Place of birth for the foreign-born population - Thailand (%)
Place of birth for the foreign-born population - Vietnam (%)
Place of birth for the foreign-born population - Other South Eastern Asia (%)
Place of birth for the foreign-born population - Armenia (%)
Place of birth for the foreign-born population - Iraq (%)
Place of birth for the foreign-born population - Israel (%)
Place of birth for the foreign-born population - Jordan (%)
Place of birth for the foreign-born population - Kuwait (%)
Place of birth for the foreign-born population - Lebanon (%)
Place of birth for the foreign-born population - Saudi Arabia (%)
Place of birth for the foreign-born population - Syria (%)
Place of birth for the foreign-born population - Turkey (%)
Place of birth for the foreign-born population - Yemen (%)
Place of birth for the foreign-born population - Other Western Asia (%)
Place of birth for the foreign-born population - Eritrea (%)
Place of birth for the foreign-born population - Ethiopia (%)
Place of birth for the foreign-born population - Kenya (%)
Place of birth for the foreign-born population - Somalia (%)
Place of birth for the foreign-born population - Uganda (%)
Place of birth for the foreign-born population - Zimbabwe (%)
Place of birth for the foreign-born population - Other Eastern Africa (%)
Place of birth for the foreign-born population - Cameroon (%)
Place of birth for the foreign-born population - Congo (%)
Place of birth for the foreign-born population - Democratic Republic of Congo (Zaire) (%)
Place of birth for the foreign-born population - Other Middle Africa (%)
Place of birth for the foreign-born population - Egypt (%)
Place of birth for the foreign-born population - Morocco (%)
Place of birth for the foreign-born population - Sudan (%)
Place of birth for the foreign-born population - Other Northern Africa (%)
Place of birth for the foreign-born population - South Africa (%)
Place of birth for the foreign-born population - Other Southern Africa (%)
Place of birth for the foreign-born population - Cabo Verde (%)
Place of birth for the foreign-born population - Ghana (%)
Place of birth for the foreign-born population - Liberia (%)
Place of birth for the foreign-born population - Nigeria (%)
Place of birth for the foreign-born population - Senegal (%)
Place of birth for the foreign-born population - Sierra Leone (%)
Place of birth for the foreign-born population - Other Western Africa (%)
Place of birth for the foreign-born population - Australia (%)
Place of birth for the foreign-born population - New Zealand (%)
Place of birth for the foreign-born population - Fiji (%)
Place of birth for the foreign-born population - Micronesia (%)
Place of birth for the foreign-born population - Bahamas (%)
Place of birth for the foreign-born population - Barbados (%)
Place of birth for the foreign-born population - Cuba (%)
Place of birth for the foreign-born population - Dominica (%)
Place of birth for the foreign-born population - Dominican Republic (%)
Place of birth for the foreign-born population - Grenada (%)
Place of birth for the foreign-born population - Haiti (%)
Place of birth for the foreign-born population - Jamaica (%)
Place of birth for the foreign-born population - St. Vincent and the Grenadines (%)
Place of birth for the foreign-born population - Trinidad and Tobago (%)
Place of birth for the foreign-born population - West Indies (%)
Place of birth for the foreign-born population - Other Caribbean (%)
Place of birth for the foreign-born population - Belize (%)
Place of birth for the foreign-born population - Costa Rica (%)
Place of birth for the foreign-born population - El Salvador (%)
Place of birth for the foreign-born population - Guatemala (%)
Place of birth for the foreign-born population - Honduras (%)
Place of birth for the foreign-born population - Mexico (%)
Place of birth for the foreign-born population - Nicaragua (%)
Place of birth for the foreign-born population - Panama (%)
Place of birth for the foreign-born population - Other Central America (%)
Place of birth for the foreign-born population - Argentina (%)
Place of birth for the foreign-born population - Bolivia (%)
Place of birth for the foreign-born population - Brazil (%)
Place of birth for the foreign-born population - Chile (%)
Place of birth for the foreign-born population - Colombia (%)
Place of birth for the foreign-born population - Ecuador (%)
Place of birth for the foreign-born population - Guyana (%)
Place of birth for the foreign-born population - Peru (%)
Place of birth for the foreign-born population - Uruguay (%)
Place of birth for the foreign-born population - Venezuela (%)
Place of birth for the foreign-born population - Other South America (%)
Place of birth for the foreign-born population - Canada (%)
Place of birth for the foreign-born population - Other Northern America (%)
Place of birth for the foreign-born population - Other (%)
Latest news about races in Salisbury, NY collected exclusively by city-data.com from local newspapers, TV, and radio stations
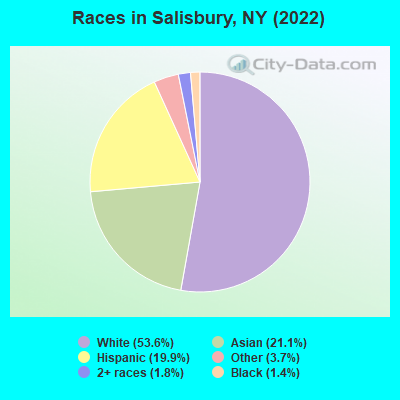
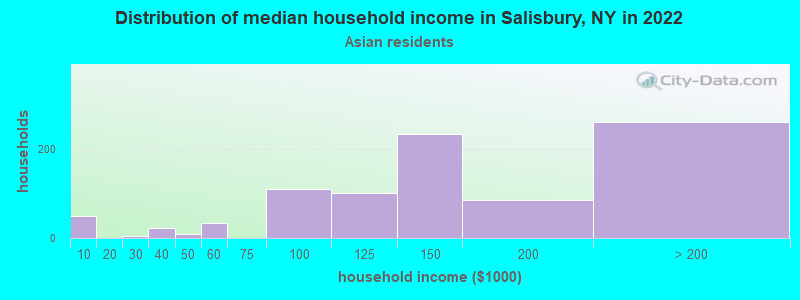
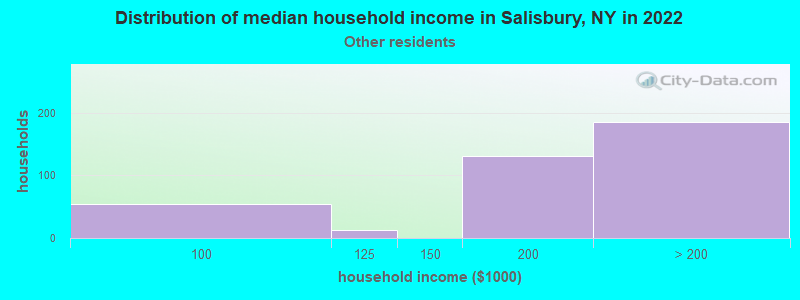
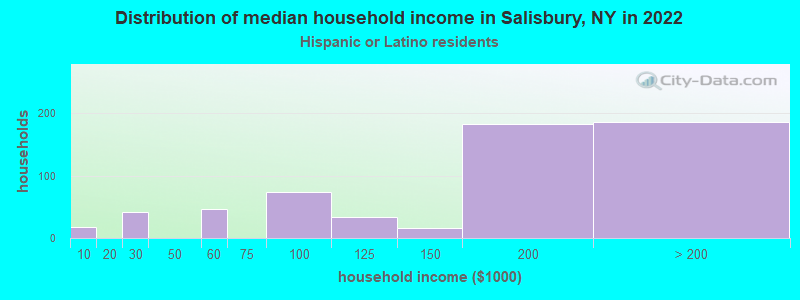
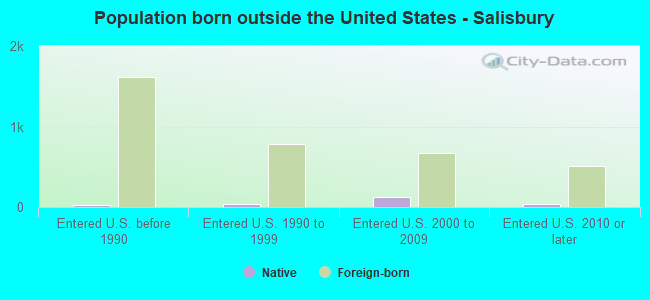
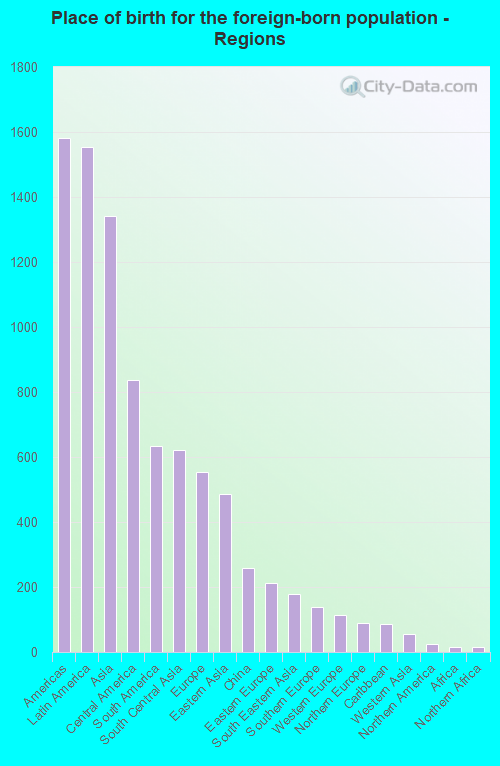
According to 2022 data, the most numerous races in Salisbury, NY are White alone (6,872 residents), Hispanic (2,548 residents), and Black alone (174 residents). 62.4% of Salisbury residents speak English at home. 27.3% of Salisbury, NY residents are foreign-born (12.2% born in Latin America, 10.5% born in Asia, 4.4% born in Europe), which is 19.4% greater than the foreign-born rate of 22.0% across the entire state of New York.
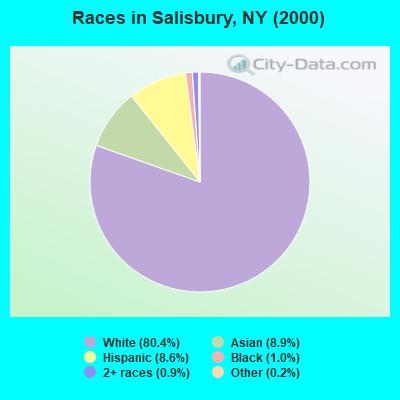
Race distribution in Salisbury
2000 2022
11,760,981 62.0% White alone 2,867,583 15.1% Hispanic 2,812,623 14.8% Black alone 1,035,926 5.5% Asian alone 366,116 1.9% Two or more races 75,499 0.4% Other race alone 52,499 0.3% American Indian alone 5,230 0.03% Native Hawaiian and Other
10,408,933 52.9% White alone 3,867,299 19.7% Hispanic 2,633,840 13.4% Black alone 1,776,286 9.0% Asian alone 732,670 3.7% Two or more races 216,110 1.1% Other race alone 35,082 0.2% American Indian alone 6,931 0.04% Native Hawaiian and Other
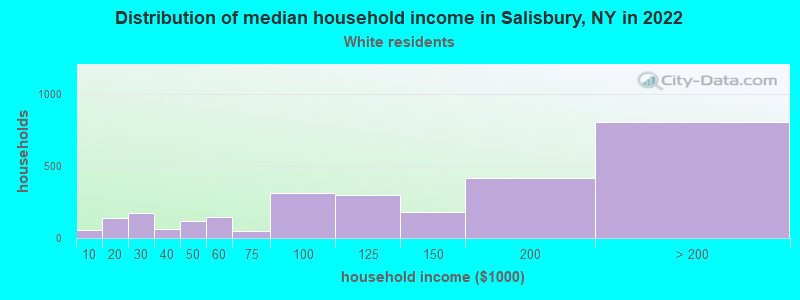
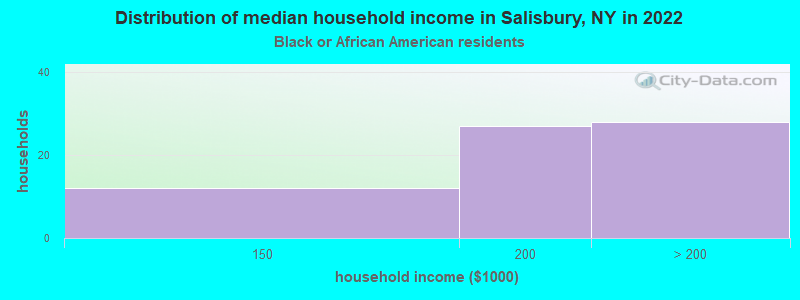
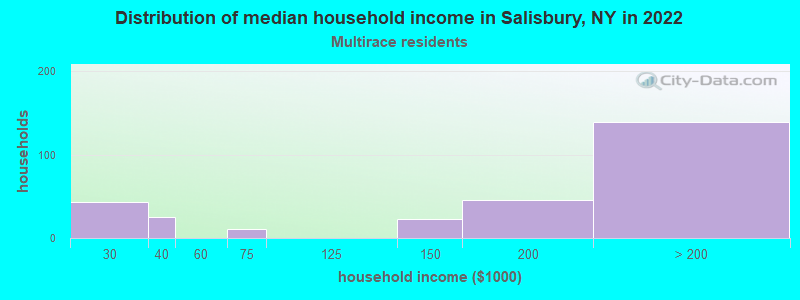
Income and house value in Salisbury Median household income in 2022 $142,340 White non-Hispanic householdersover $200,000 Black householders$134,293 Asian householders$191,785 Some other race householders$199,951 Two or more races householders$164,086 Hispanic or Latino race householdersMedian 2022 house value $626,384 White Non-Hispanic householders$695,053 Black or African American householders$410,523 American Indian or Alaska Native householders $737,449 Asian householders$821,046 Some other race householders$781,636 Two or more races householders$625,189 Hispanic or Latino householders
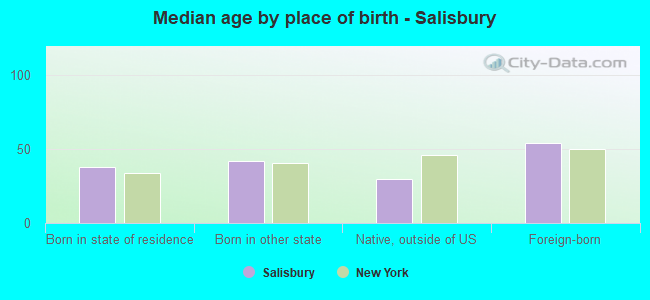
Median age by race in Salisbury
49.8 Median age for White residents48.9 51.6 47.3 Median age for Black or African American residents38.7 48.4 -855,158,729.3 Median age for American Indian / Alaska Native residents-607,543,322.5 -837,121,211.3 46.3 Median age for Asian residents46.6 46.1 -487,992,314.6 Median age for Native Hawaiian / Pacific Islander residents-477,502,295.2 -497,387,669.3 26.7 Median age for Other race residents26.2 28.4 35.0 Median age for Two or more races residents35.2 24.6 48.9 Median age for White alone residents48.4 50.4 32.1 Median age for Hispanic or Latino residents28.9 35.5
Owner/renter occupied households by race in Salisbury
House owners and renters - White residents 2,498 91.0% Owner occupied248 9.0% Renter occupiedHouse owners and renters - Black or African American residents 65 100.0% Owner occupiedHouse owners and renters - Asian residents 873 96.0% Owner occupied37 4.0% Renter occupiedHouse owners and renters - Other race residents 320 85.1% Owner occupied56 14.9% Renter occupiedHouse owners and renters - Two or more races residents 214 75.3% Owner occupied70 24.7% Renter occupiedHouse owners and renters - White alone residents 2,403 90.5% Owner occupied253 9.5% Renter occupiedHouse owners and renters - Hispanic or Latino residents 520 88.6% Owner occupied67 11.4% Renter occupied
Language usage in Salisbury
English speakers - Total 62.4% of residents of Salisbury speak English at home.
16.5% of residents speak Spanish at home 1,420 70.5% Speak English very well593 29.5% Speak English less than very well21.2% of residents speak other language at home 1,924 74.2% Speak English very well668 25.8% Speak English less than very well
English speakers - Born in the United States 68.2% of residents of Salisbury speak English at home.
17.6% of residents speak Spanish at home 45 100.0% Speak English very well17.6% of residents speak other language at home 45 100.0% Speak English very well
English speakers - Native, born elsewhere 10.4% of residents of Salisbury speak English at home.
42.6% of residents speak Spanish at home 51 59.3% Speak English very well35 40.7% Speak English less than very well49.5% of residents speak other language at home 100 100.0% Speak English very well
English speakers - Foreign-born 18.9% of residents of Salisbury speak English at home.
26.5% of residents speak Spanish at home 409 43.5% Speak English very well532 56.5% Speak English less than very well55.0% of residents speak other language at home 1,332 68.1% Speak English very well625 31.9% Speak English less than very well
White (Caucasian) - Speak only English Native:
93.1% (5,679)Foreign-born:
22.5% (151)
White (Caucasian) - Speak another language Native:
6.8% (414)Foreign-born:
75.9% (507)
Black or African American - Speak only English Native:
99.1% (121)Foreign-born:
55.2% (28)
Asian - Speak only English Native:
63.7% (549)Foreign-born:
23.5% (424)
Asian - Speak another language Native:
37.2% (321)Foreign-born:
73.5% (1,328)
Other race - Speak only English Native:
19.7% (186)Foreign-born:
0.4% (3)
Other race - Speak another language Native:
77.2% (726)Foreign-born:
100.0% (830)
Two or more races - Speak only English Native:
55.7% (406)Foreign-born:
23.0% (70)
Two or more races - Speak another language Native:
46.8% (341)Foreign-born:
76.2% (232)
White alone - Speak only English Native:
94.1% (5,651)Foreign-born:
15.3% (103)
White alone - Speak another language Native:
5.9% (352)Foreign-born:
85.1% (573)
Hispanic or Latino - Speak only English Native:
30.8% (394)Foreign-born:
11.0% (105)
Hispanic or Latino - Speak another language Native:
69.5% (888)Foreign-born:
89.0% (854)
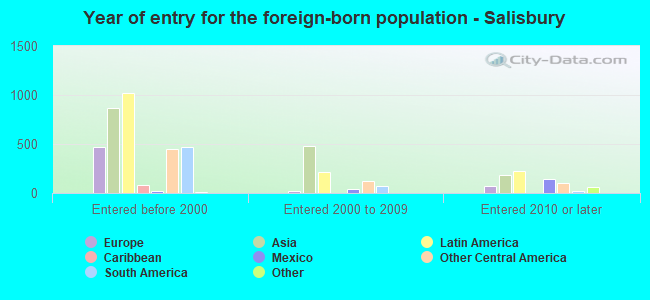
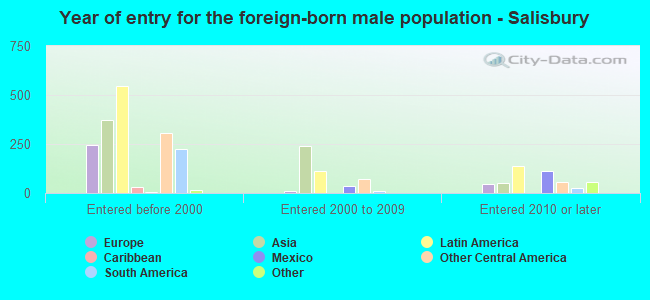
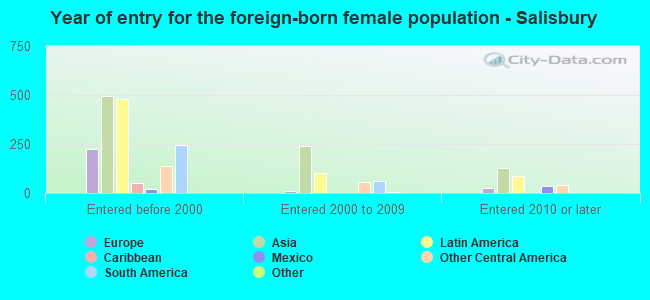
Foreign-born residents in Salisbury 3,495 residents are foreign born (12.2% Latin America , 10.5% Asia , 4.4% Europe ).
This city:
27.3%New York:
22.6%
Marital status for residents in Salisbury Marital status - White (Caucasian) population 15 years and over
Males 27.6% Never married64.7% Now married0.3% Separated2.1% Widowed5.3% DivorcedFemales 22.7% Never married54.6% Now married0.6% Separated16.8% Widowed5.2% DivorcedWomen who gave birth in the past 12 months Now married:
82.4% (50)Unmarried:
17.6% (11)
Women who did not give birth in the past 12 months Now married:
49.0% (624)Unmarried:
51.0% (649)
Marital status - Black or African American population 15 years and over
Males 42.3% Never married57.7% Now married0.0% Separated0.0% Widowed0.0% DivorcedFemales 35.5% Never married64.5% Now married0.0% Separated0.0% Widowed0.0% DivorcedWomen who did not give birth in the past 12 months Now married:
46.2% (17)Unmarried:
53.8% (20)
Marital status - Asian population 15 years and over
Males 26.4% Never married71.1% Now married0.0% Separated1.8% Widowed0.7% DivorcedFemales 19.9% Never married66.0% Now married2.1% Separated4.9% Widowed7.1% DivorcedWomen who gave birth in the past 12 months Now married:
100.0% (11)Unmarried:
0.0% (0)
Women who did not give birth in the past 12 months Now married:
57.7% (338)Unmarried:
42.3% (248)
Marital status - Other race population 15 years and over
Males 61.9% Never married32.3% Now married0.0% Separated0.0% Widowed5.8% DivorcedFemales 41.0% Never married50.8% Now married0.0% Separated2.3% Widowed6.0% DivorcedWomen who gave birth in the past 12 months Now married:
100.0% (19)Unmarried:
0.0% (0)
Women who did not give birth in the past 12 months Now married:
44.2% (192)Unmarried:
55.8% (242)
Marital status - Two or more races population 15 years and over
Males 15.5% Never married74.8% Now married7.1% Separated0.0% Widowed2.6% DivorcedFemales 30.7% Never married61.7% Now married0.0% Separated5.7% Widowed2.0% DivorcedWomen who did not give birth in the past 12 months Now married:
58.0% (192)Unmarried:
42.0% (139)
Marital status - White alone, not Hispanic / Latino population 15 years and over
Males 28.2% Never married63.6% Now married0.3% Separated2.2% Widowed5.6% DivorcedFemales 22.4% Never married55.5% Now married0.7% Separated16.2% Widowed5.3% DivorcedWomen who gave birth in the past 12 months Now married:
82.4% (53)Unmarried:
17.6% (11)
Women who did not give birth in the past 12 months Now married:
49.7% (638)Unmarried:
50.3% (645)
Marital status - Hispanic or Latino population 15 years and over
Males 43.1% Never married49.7% Now married2.1% Separated0.0% Widowed5.2% DivorcedFemales 32.3% Never married54.5% Now married0.0% Separated7.7% Widowed5.5% DivorcedWomen who gave birth in the past 12 months Now married:
100.0% (17)Unmarried:
0.0% (0)
Women who did not give birth in the past 12 months Now married:
50.6% (269)Unmarried:
49.4% (263)
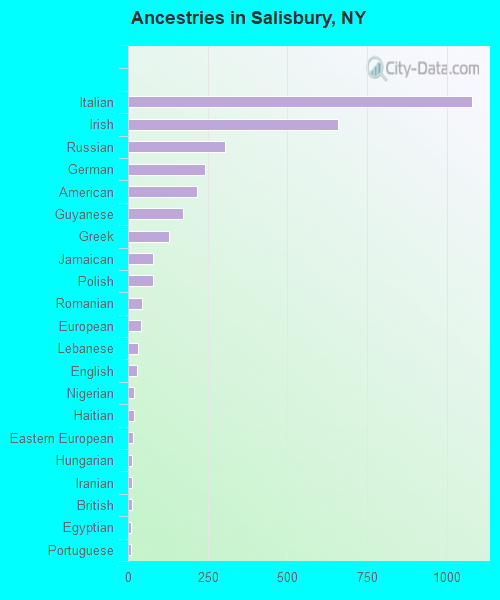
Ancestries in Salisbury
1,079 16.4% Italian659 10.0% Irish305 4.6% Russian241 3.7% German216 3.3% American174 2.6% Guyanese128 1.9% Greek79 1.2% Jamaican78 1.2% Polish45 0.7% Romanian40 0.6% European30 0.5% Lebanese29 0.4% English20 0.3% Nigerian18 0.3% Haitian17 0.3% Eastern European14 0.2% Hungarian14 0.2% Iranian12 0.2% British10 0.2% Egyptian10 0.2% Portuguese9 0.1% Israeli9 0.1% Turkish9 0.1% Ukrainian7 0.1% Austrian6 0.09% Scottish3 0.05% Swedish2 0.03% Scotch-Irish
Geographical mobility in Salisbury Same house 1 year ago 6,614 95.7% White (Caucasian)142 71.9% Black or African American2,336 86.6% Asian1,896 99.5% Other race1,001 81.8% Two or more races6,558 96.2% White alone, not Hispanic / Latino2,329 93.2% Hispanic or LatinoMoved within same county 100 1.5% White / Caucasian56 28.3% Black or African American129 4.8% Asian9 0.5% Other race39 3.2% Two or more races107 1.6% White alone, not Hispanic / Latino8 0.3% Hispanic or LatinoMoved within same state 82 1.2% White / Caucasian13 6.4% Black or African American253 9.4% Asian188 15.4% Two or more races58 0.8% White alone, not Hispanic / Latino108 4.3% Hispanic or LatinoMoved from different state 62 0.9% White / Caucasian63 0.9% White alone, not Hispanic / LatinoMoved from abroad 39 0.6% White8 0.1% White alone, not Hispanic / Latino44 1.8% Hispanic or Latino
Children Nativity (place of birth) in Salisbury
Children under 6 years - Living with two parents Both parents native 342 100.0% NativeBoth parents foreign-born 55 100.0% NativeOne native, one foreign-born parent 139 100.0% NativeChildren under 6 years - Living with one parent Native parent 105 100.0% NativeForeign-born parent 33 34.3% Native63 65.7% Foreign-bornChildren 6 to 17 years - Living with two parents Both parents native 873 100.0% NativeBoth parents foreign-born 316 79.5% Native82 20.5% Foreign-bornOne native, one foreign-born parent 119 92.0% Native10 8.0% Foreign-bornChildren 6 to 17 years - Living with one parent Native parent 107 100.0% NativeForeign-born parent 131 47.2% Native147 52.8% Foreign-born
Grandparents responsible for own grandchildren in Salisbury
Grandparents (30 to 59 years) White / Caucasian 7 100.0% Responsible for grandchildrenAsian 11 100.0% Not responsible for grandchildrenOther race 101 52.7% Responsible for grandchildren91 47.3% Not responsible for grandchildrenTwo or more races 12 100.0% Responsible for grandchildrenWhite alone, not Hispanic / Latino 7 100.0% Responsible for grandchildrenHispanic or Latino 16 20.5% Responsible for grandchildren63 79.5% Not responsible for grandchildrenGrandparents (60 years and over) White / Caucasian 115 100.0% Not responsible for grandchildrenAsian 55 47.0% Responsible for grandchildren63 53.0% Not responsible for grandchildrenTwo or more races 32 100.0% Not responsible for grandchildrenWhite alone, not Hispanic / Latino 75 100.0% Not responsible for grandchildrenHispanic or Latino 43 100.0% Not responsible for grandchildren