Races in Selden, New York (NY) Detailed Stats
Data:
Races - White alone (%)
Races - White alone (% change since 2000)
Races - Black alone (%)
Races - Black alone (% change since 2000)
Races - American Indian alone (%)
Races - American Indian alone (% change since 2000)
Races - Asian alone (%)
Races - Asian alone (% change since 2000)
Races - Hispanic (%)
Races - Hispanic (% change since 2000)
Races - Native Hawaiian and Other Pacific Islander alone (%)
Races - Native Hawaiian and Other Pacific Islander alone (% change since 2000)
Races - Two or more races(%)
Races - Two or more races(% change since 2000)
Races - Other race alone (%)
Races - Other race alone (% change since 2000)
Racial diversity
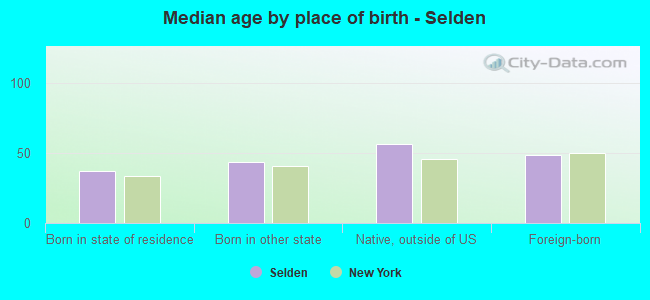
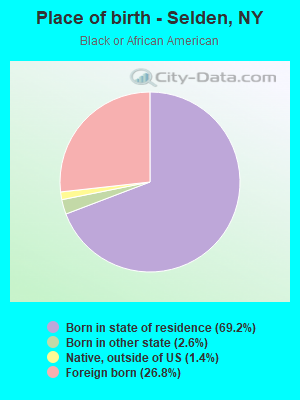
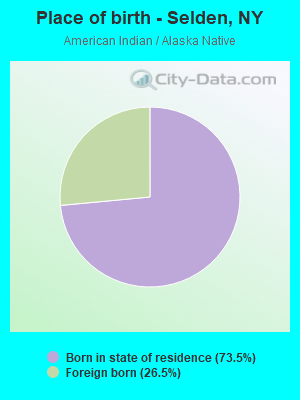
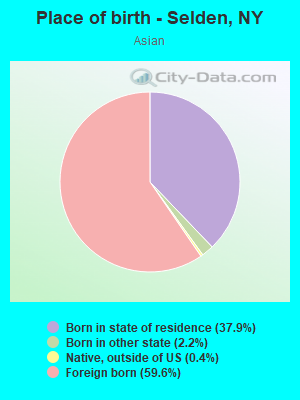
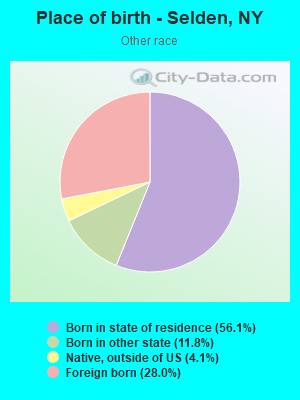
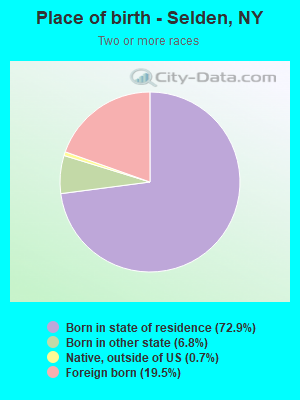
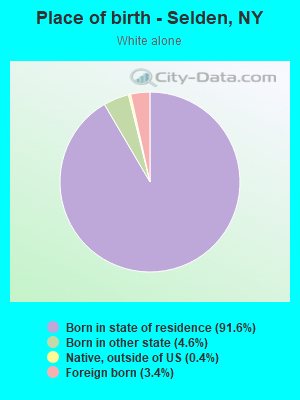
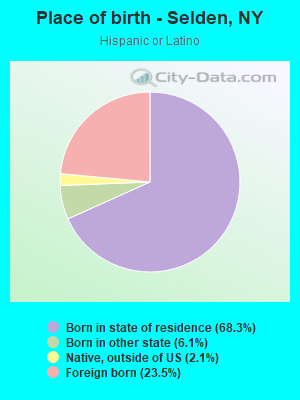
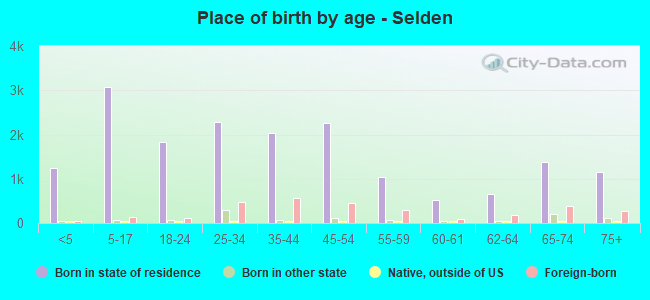
Place of birth - Born in state of residence (%)
Place of birth - Born in state of residence (%) - White
Place of birth - Born in state of residence (%) - Black or African American
Place of birth - Born in state of residence (%) - Asian
Place of birth - Born in state of residence (%) - Hispanic or Latino
Place of birth - Born in state of residence (%) - American Indian and Alaska Native
Place of birth - Born in state of residence (%) - Multirace
Place of birth - Born in state of residence (%) - Other Race
Place of birth - Born in other state (%)
Place of birth - Born in other state (%) - White
Place of birth - Born in other state (%) - Black or African American
Place of birth - Born in other state (%) - Asian
Place of birth - Born in other state (%) - Hispanic or Latino
Place of birth - Born in other state (%) - American Indian and Alaska Native
Place of birth - Born in other state (%) - Multirace
Place of birth - Born in other state (%) - Other Race
Place of birth - Native, outside of US (%)
Place of birth - Native, outside of US (%) - White
Place of birth - Native, outside of US (%) - Black or African American
Place of birth - Native, outside of US (%) - Asian
Place of birth - Native, outside of US (%) - Hispanic or Latino
Place of birth - Native, outside of US (%) - American Indian and Alaska Native
Place of birth - Native, outside of US (%) - Multirace
Place of birth - Native, outside of US (%) - Other Race
Place of birth - Foreign born (%)
Place of birth - Foreign born (%) - White
Place of birth - Foreign born (%) - Black or African American
Place of birth - Foreign born (%) - Asian
Place of birth - Foreign born (%) - Hispanic or Latino
Place of birth - Foreign born (%) - American Indian and Alaska Native
Place of birth - Foreign born (%) - Multirace
Place of birth - Foreign born (%) - Other Race
Residents speaking English at home (%)
Residents speaking English at home - Born in the United States (%)
Residents speaking English at home - Native, born elsewhere (%)
Residents speaking English at home - Foreign born (%)
Residents speaking Spanish at home (%)
Residents speaking Spanish at home - Born in the United States (%)
Residents speaking Spanish at home - Native, born elsewhere (%)
Residents speaking Spanish at home - Foreign born (%)
Residents speaking other language at home (%)
Residents speaking other language at home - Born in the United States (%)
Residents speaking other language at home - Native, born elsewhere (%)
Residents speaking other language at home - Foreign born (%)
Marital status - Never married (%)
Marital status - Now married (%)
Marital status - Separated (%)
Marital status - Widowed (%)
Marital status - Divorced (%)
Ancestries Reported - Arab (%)
Ancestries Reported - Czech (%)
Ancestries Reported - Danish (%)
Ancestries Reported - Dutch (%)
Ancestries Reported - English (%)
Ancestries Reported - French (%)
Ancestries Reported - French Canadian (%)
Ancestries Reported - German (%)
Ancestries Reported - Greek (%)
Ancestries Reported - Hungarian (%)
Ancestries Reported - Irish (%)
Ancestries Reported - Italian (%)
Ancestries Reported - Lithuanian (%)
Ancestries Reported - Norwegian (%)
Ancestries Reported - Polish (%)
Ancestries Reported - Portuguese (%)
Ancestries Reported - Russian (%)
Ancestries Reported - Scotch-Irish (%)
Ancestries Reported - Scottish (%)
Ancestries Reported - Slovak (%)
Ancestries Reported - Subsaharan African (%)
Ancestries Reported - Swedish (%)
Ancestries Reported - Swiss (%)
Ancestries Reported - Ukrainian (%)
Ancestries Reported - United States (%)
Ancestries Reported - Welsh (%)
Ancestries Reported - West Indian (%)
Ancestries Reported - Other (%)
Geographical mobility - Same house 1 year ago (%)
Geographical mobility - Same house 1 year ago (%) - White
Geographical mobility - Same house 1 year ago (%) - Black or African American
Geographical mobility - Same house 1 year ago (%) - Asian
Geographical mobility - Same house 1 year ago (%) - Hispanic or Latino
Geographical mobility - Same house 1 year ago (%) - American Indian and Alaska Native
Geographical mobility - Same house 1 year ago (%) - Multirace
Geographical mobility - Same house 1 year ago (%) - Other Race
Geographical mobility - Moved within same county (%)
Geographical mobility - Moved within same county (%) - White
Geographical mobility - Moved within same county (%) - Black or African American
Geographical mobility - Moved within same county (%) - Asian
Geographical mobility - Moved within same county (%) - Hispanic or Latino
Geographical mobility - Moved within same county (%) - American Indian and Alaska Native
Geographical mobility - Moved within same county (%) - Multirace
Geographical mobility - Moved within same county (%) - Other Race
Geographical mobility - Moved from different county within same state (%)
Geographical mobility - Moved from different county within same state (%) - White
Geographical mobility - Moved from different county within same state (%) - Black or African American
Geographical mobility - Moved from different county within same state (%) - Asian
Geographical mobility - Moved from different county within same state (%) - Hispanic or Latino
Geographical mobility - Moved from different county within same state (%) - American Indian and Alaska Native
Geographical mobility - Moved from different county within same state (%) - Multirace
Geographical mobility - Moved from different county within same state (%) - Other Race
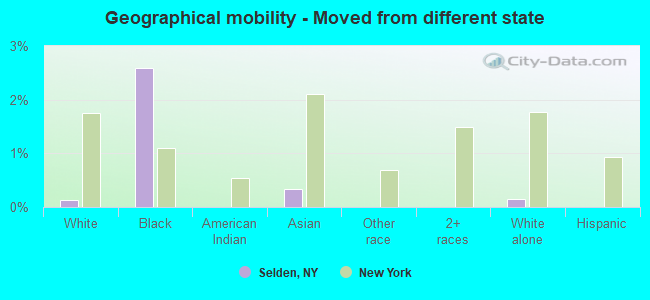
Geographical mobility - Moved from different state (%)
Geographical mobility - Moved from different state (%) - White
Geographical mobility - Moved from different state (%) - Black or African American
Geographical mobility - Moved from different state (%) - Asian
Geographical mobility - Moved from different state (%) - Hispanic or Latino
Geographical mobility - Moved from different state (%) - American Indian and Alaska Native
Geographical mobility - Moved from different state (%) - Multirace
Geographical mobility - Moved from different state (%) - Other Race
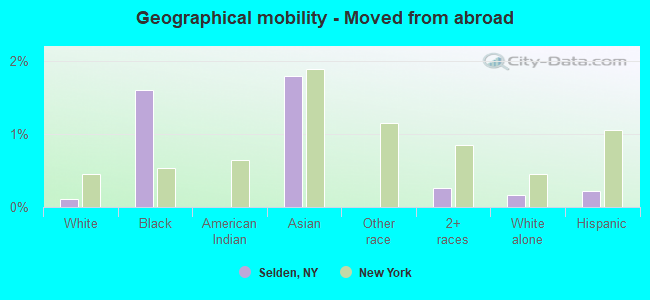
Geographical mobility - Moved from abroad (%)
Geographical mobility - Moved from abroad (%) - White
Geographical mobility - Moved from abroad (%) - Black or African American
Geographical mobility - Moved from abroad (%) - Asian
Geographical mobility - Moved from abroad (%) - Hispanic or Latino
Geographical mobility - Moved from abroad (%) - American Indian and Alaska Native
Geographical mobility - Moved from abroad (%) - Multirace
Geographical mobility - Moved from abroad (%) - Other Race
Place of birth for the foreign-born population - Ireland (%)
Place of birth for the foreign-born population - Denmark (%)
Place of birth for the foreign-born population - Norway (%)
Place of birth for the foreign-born population - Sweden (%)
Place of birth for the foreign-born population - United Kingdom (%)
Place of birth for the foreign-born population - England (%)
Place of birth for the foreign-born population - Scotland (%)
Place of birth for the foreign-born population - Other Northern Europe (%)
Place of birth for the foreign-born population - Austria (%)
Place of birth for the foreign-born population - Belgium (%)
Place of birth for the foreign-born population - France (%)
Place of birth for the foreign-born population - Germany (%)
Place of birth for the foreign-born population - Netherlands (%)
Place of birth for the foreign-born population - Switzerland (%)
Place of birth for the foreign-born population - Other Western Europe (%)
Place of birth for the foreign-born population - Greece (%)
Place of birth for the foreign-born population - Italy (%)
Place of birth for the foreign-born population - Portugal (%)
Place of birth for the foreign-born population - Spain (%)
Place of birth for the foreign-born population - Other Southern Europe (%)
Place of birth for the foreign-born population - Albania (%)
Place of birth for the foreign-born population - Belarus (%)
Place of birth for the foreign-born population - Bosnia and Herzegovina (%)
Place of birth for the foreign-born population - Bulgaria (%)
Place of birth for the foreign-born population - Croatia (%)
Place of birth for the foreign-born population - Czechoslovakia (%)
Place of birth for the foreign-born population - Hungary (%)
Place of birth for the foreign-born population - Latvia (%)
Place of birth for the foreign-born population - Lithuania (%)
Place of birth for the foreign-born population - North Macedonia (Macedonia) (%)
Place of birth for the foreign-born population - Moldova (%)
Place of birth for the foreign-born population - Poland (%)
Place of birth for the foreign-born population - Romania (%)
Place of birth for the foreign-born population - Russia (%)
Place of birth for the foreign-born population - Serbia (%)
Place of birth for the foreign-born population - Ukraine (%)
Place of birth for the foreign-born population - Other Eastern Europe (%)
Place of birth for the foreign-born population - China (%)
Place of birth for the foreign-born population - Hong Kong (%)
Place of birth for the foreign-born population - Taiwan (%)
Place of birth for the foreign-born population - Japan (%)
Place of birth for the foreign-born population - Korea (%)
Place of birth for the foreign-born population - Other Eastern Asia (%)
Place of birth for the foreign-born population - Afghanistan (%)
Place of birth for the foreign-born population - Bangladesh (%)
Place of birth for the foreign-born population - India (%)
Place of birth for the foreign-born population - Iran (%)
Place of birth for the foreign-born population - Kazakhstan (%)
Place of birth for the foreign-born population - Nepal (%)
Place of birth for the foreign-born population - Pakistan (%)
Place of birth for the foreign-born population - Sri Lanka (%)
Place of birth for the foreign-born population - Uzbekistan (%)
Place of birth for the foreign-born population - Other South Central Asia (%)
Place of birth for the foreign-born population - Burma (%)
Place of birth for the foreign-born population - Cambodia (%)
Place of birth for the foreign-born population - Indonesia (%)
Place of birth for the foreign-born population - Laos (%)
Place of birth for the foreign-born population - Malaysia (%)
Place of birth for the foreign-born population - Philippines (%)
Place of birth for the foreign-born population - Singapore (%)
Place of birth for the foreign-born population - Thailand (%)
Place of birth for the foreign-born population - Vietnam (%)
Place of birth for the foreign-born population - Other South Eastern Asia (%)
Place of birth for the foreign-born population - Armenia (%)
Place of birth for the foreign-born population - Iraq (%)
Place of birth for the foreign-born population - Israel (%)
Place of birth for the foreign-born population - Jordan (%)
Place of birth for the foreign-born population - Kuwait (%)
Place of birth for the foreign-born population - Lebanon (%)
Place of birth for the foreign-born population - Saudi Arabia (%)
Place of birth for the foreign-born population - Syria (%)
Place of birth for the foreign-born population - Turkey (%)
Place of birth for the foreign-born population - Yemen (%)
Place of birth for the foreign-born population - Other Western Asia (%)
Place of birth for the foreign-born population - Eritrea (%)
Place of birth for the foreign-born population - Ethiopia (%)
Place of birth for the foreign-born population - Kenya (%)
Place of birth for the foreign-born population - Somalia (%)
Place of birth for the foreign-born population - Uganda (%)
Place of birth for the foreign-born population - Zimbabwe (%)
Place of birth for the foreign-born population - Other Eastern Africa (%)
Place of birth for the foreign-born population - Cameroon (%)
Place of birth for the foreign-born population - Congo (%)
Place of birth for the foreign-born population - Democratic Republic of Congo (Zaire) (%)
Place of birth for the foreign-born population - Other Middle Africa (%)
Place of birth for the foreign-born population - Egypt (%)
Place of birth for the foreign-born population - Morocco (%)
Place of birth for the foreign-born population - Sudan (%)
Place of birth for the foreign-born population - Other Northern Africa (%)
Place of birth for the foreign-born population - South Africa (%)
Place of birth for the foreign-born population - Other Southern Africa (%)
Place of birth for the foreign-born population - Cabo Verde (%)
Place of birth for the foreign-born population - Ghana (%)
Place of birth for the foreign-born population - Liberia (%)
Place of birth for the foreign-born population - Nigeria (%)
Place of birth for the foreign-born population - Senegal (%)
Place of birth for the foreign-born population - Sierra Leone (%)
Place of birth for the foreign-born population - Other Western Africa (%)
Place of birth for the foreign-born population - Australia (%)
Place of birth for the foreign-born population - New Zealand (%)
Place of birth for the foreign-born population - Fiji (%)
Place of birth for the foreign-born population - Micronesia (%)
Place of birth for the foreign-born population - Bahamas (%)
Place of birth for the foreign-born population - Barbados (%)
Place of birth for the foreign-born population - Cuba (%)
Place of birth for the foreign-born population - Dominica (%)
Place of birth for the foreign-born population - Dominican Republic (%)
Place of birth for the foreign-born population - Grenada (%)
Place of birth for the foreign-born population - Haiti (%)
Place of birth for the foreign-born population - Jamaica (%)
Place of birth for the foreign-born population - St. Vincent and the Grenadines (%)
Place of birth for the foreign-born population - Trinidad and Tobago (%)
Place of birth for the foreign-born population - West Indies (%)
Place of birth for the foreign-born population - Other Caribbean (%)
Place of birth for the foreign-born population - Belize (%)
Place of birth for the foreign-born population - Costa Rica (%)
Place of birth for the foreign-born population - El Salvador (%)
Place of birth for the foreign-born population - Guatemala (%)
Place of birth for the foreign-born population - Honduras (%)
Place of birth for the foreign-born population - Mexico (%)
Place of birth for the foreign-born population - Nicaragua (%)
Place of birth for the foreign-born population - Panama (%)
Place of birth for the foreign-born population - Other Central America (%)
Place of birth for the foreign-born population - Argentina (%)
Place of birth for the foreign-born population - Bolivia (%)
Place of birth for the foreign-born population - Brazil (%)
Place of birth for the foreign-born population - Chile (%)
Place of birth for the foreign-born population - Colombia (%)
Place of birth for the foreign-born population - Ecuador (%)
Place of birth for the foreign-born population - Guyana (%)
Place of birth for the foreign-born population - Peru (%)
Place of birth for the foreign-born population - Uruguay (%)
Place of birth for the foreign-born population - Venezuela (%)
Place of birth for the foreign-born population - Other South America (%)
Place of birth for the foreign-born population - Canada (%)
Place of birth for the foreign-born population - Other Northern America (%)
Place of birth for the foreign-born population - Other (%)
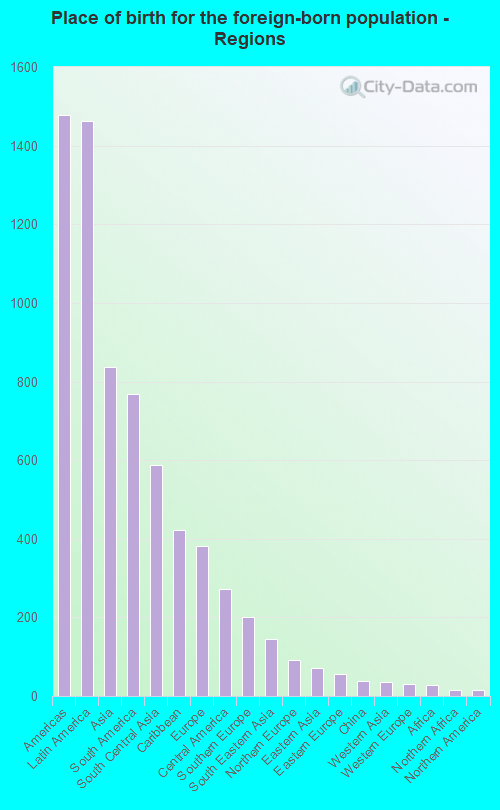
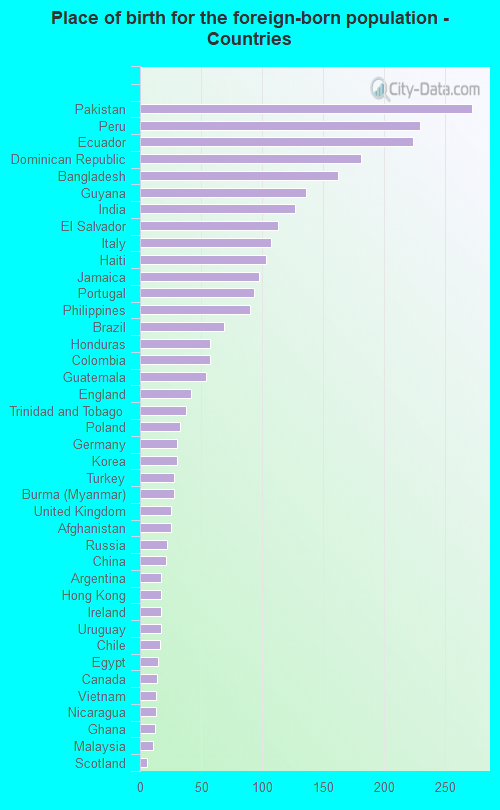
According to 2022 data, the most numerous races in Selden, NY are White alone (13,537 residents), Hispanic (4,761 residents), and Black alone (797 residents). 79.0% of Selden residents speak English at home. 12.5% of Selden, NY residents are foreign-born (6.8% born in Latin America, 3.9% born in Asia, 1.8% born in Europe), which is 75.7% less than the foreign-born rate of 22.0% across the entire state of New York.
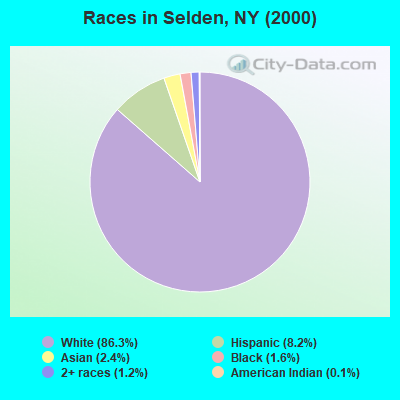
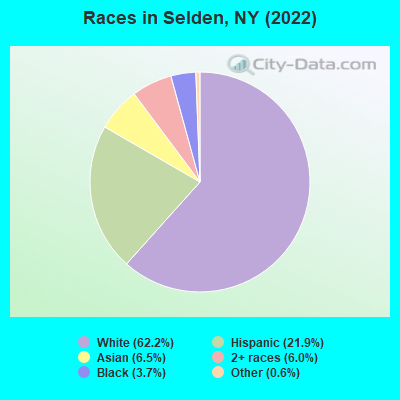
Race distribution in Selden
2000 2022
11,760,981 62.0% White alone 2,867,583 15.1% Hispanic 2,812,623 14.8% Black alone 1,035,926 5.5% Asian alone 366,116 1.9% Two or more races 75,499 0.4% Other race alone 52,499 0.3% American Indian alone 5,230 0.03% Native Hawaiian and Other
10,408,933 52.9% White alone 3,867,299 19.7% Hispanic 2,633,840 13.4% Black alone 1,776,286 9.0% Asian alone 732,670 3.7% Two or more races 216,110 1.1% Other race alone 35,082 0.2% American Indian alone 6,931 0.04% Native Hawaiian and Other
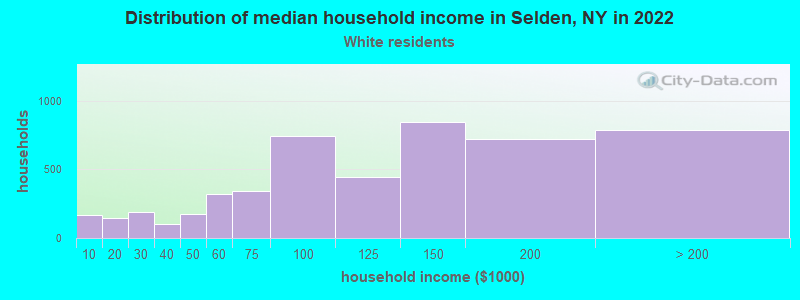
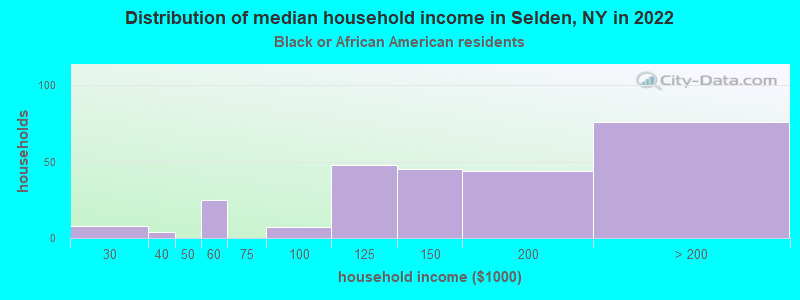
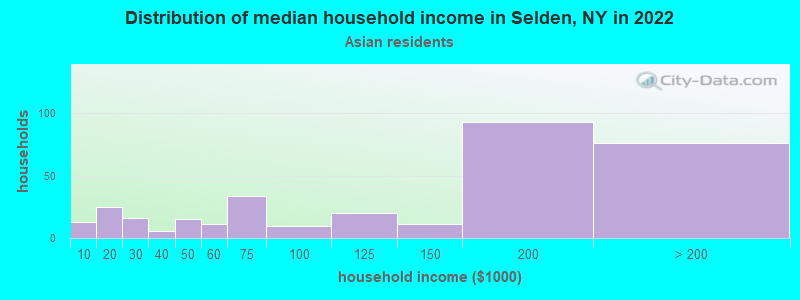
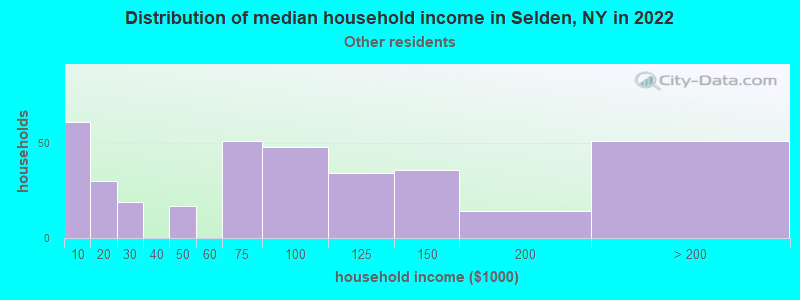
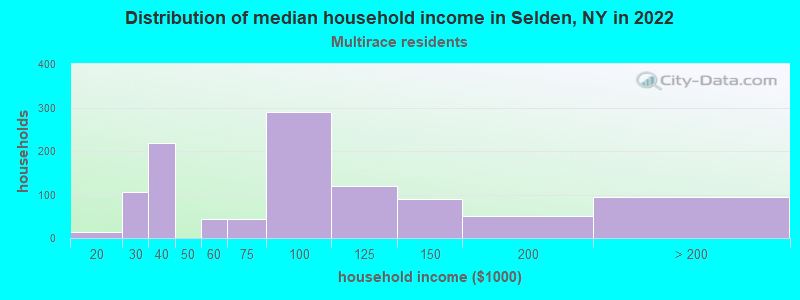
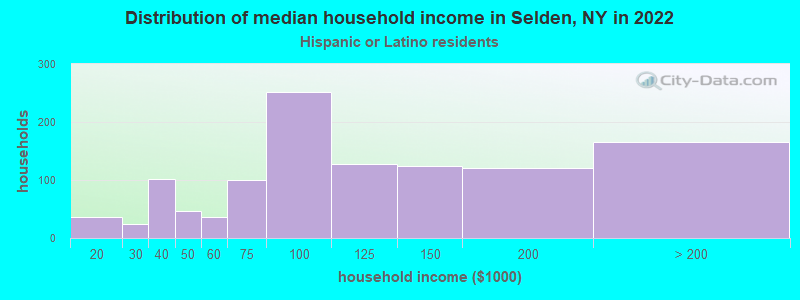
Income and house value in Selden Median household income in 2022 $115,939 White non-Hispanic householders$152,043 Black householders$143,987 Asian householders$88,220 Some other race householders$78,459 Two or more races householders$92,611 Hispanic or Latino race householdersMedian 2022 house value $449,473 White Non-Hispanic householders$504,887 Black or African American householdersover $1,000,000 American Indian or Alaska Native householders $485,492 Asian householders$435,311 Some other race householders$504,887 Two or more races householders$468,252 Hispanic or Latino householders
Median age by race in Selden
46.2 Median age for White residents44.2 47.0 33.9 Median age for Black or African American residents34.9 33.3 10.0 Median age for American Indian / Alaska Native residents-807,017,543.1 6.9 37.7 Median age for Asian residents41.3 36.4 -742,816,091.2 Median age for Native Hawaiian / Pacific Islander residents-831,187,409.8 -771,300,447.7 30.9 Median age for Other race residents30.2 34.0 26.0 Median age for Two or more races residents27.6 26.6 46.1 Median age for White alone residents44.7 47.0 30.7 Median age for Hispanic or Latino residents28.3 31.4
Owner/renter occupied households by race in Selden
House owners and renters - White residents 4,507 89.3% Owner occupied540 10.7% Renter occupiedHouse owners and renters - Black or African American residents 216 76.5% Owner occupied66 23.5% Renter occupiedHouse owners and renters - American Indian / Alaska Native residents 63 100.0% Renter occupiedHouse owners and renters - Asian residents 320 91.3% Owner occupied30 8.7% Renter occupiedHouse owners and renters - Other race residents 206 55.5% Owner occupied165 44.5% Renter occupiedHouse owners and renters - Two or more races residents 790 79.7% Owner occupied201 20.3% Renter occupiedHouse owners and renters - White alone residents 4,334 88.9% Owner occupied541 11.1% Renter occupiedHouse owners and renters - Hispanic or Latino residents 902 78.6% Owner occupied246 21.4% Renter occupied
Language usage in Selden
English speakers - Total 79.0% of residents of Selden speak English at home.
12.3% of residents speak Spanish at home 1,876 74.3% Speak English very well649 25.7% Speak English less than very well7.9% of residents speak other language at home 1,092 67.2% Speak English very well532 32.8% Speak English less than very well
English speakers - Born in the United States 84.1% of residents of Selden speak English at home.
13.1% of residents speak Spanish at home 139 100.0% Speak English very well1.8% of residents speak other language at home 19 100.0% Speak English very well
English speakers - Native, born elsewhere 50.8% of residents of Selden speak English at home.
44.6% of residents speak Spanish at home 63 79.7% Speak English very well16 20.3% Speak English less than very well1.1% of residents speak other language at home 2 100.0% Speak English less than very well
English speakers - Foreign-born 27.7% of residents of Selden speak English at home.
37.6% of residents speak Spanish at home 549 49.5% Speak English very well559 50.5% Speak English less than very well32.1% of residents speak other language at home 455 48.0% Speak English very well492 52.0% Speak English less than very well
White (Caucasian) - Speak only English Native:
94.8% (12,243)Foreign-born:
31.1% (179)
White (Caucasian) - Speak another language Native:
5.2% (674)Foreign-born:
69.3% (398)
Black or African American - Speak only English Native:
87.3% (509)Foreign-born:
84.1% (193)
Black or African American - Speak another language Native:
13.0% (76)Foreign-born:
21.8% (50)
American Indian / Alaska Native - Speak another language Native:
100.0% (78)Foreign-born:
100.0% (52)
Asian - Speak only English Native:
64.1% (326)Foreign-born:
19.8% (170)
Asian - Speak another language Native:
32.6% (166)Foreign-born:
74.5% (637)
Other race - Speak another language Native:
62.5% (696)Foreign-born:
100.0% (405)
Two or more races - Speak only English Native:
85.8% (2,387)Foreign-born:
30.7% (239)
Two or more races - Speak another language Native:
15.0% (417)Foreign-born:
66.9% (521)
White alone - Speak only English Native:
95.8% (11,921)Foreign-born:
41.7% (195)
White alone - Speak another language Native:
4.2% (518)Foreign-born:
58.3% (272)
Hispanic or Latino - Speak only English Native:
60.1% (1,919)Foreign-born:
5.2% (56)
Hispanic or Latino - Speak another language Native:
40.6% (1,296)Foreign-born:
95.0% (1,033)
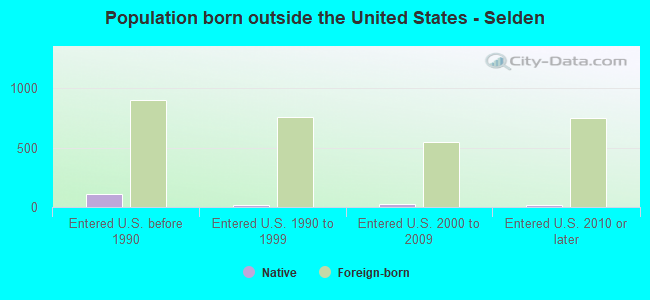
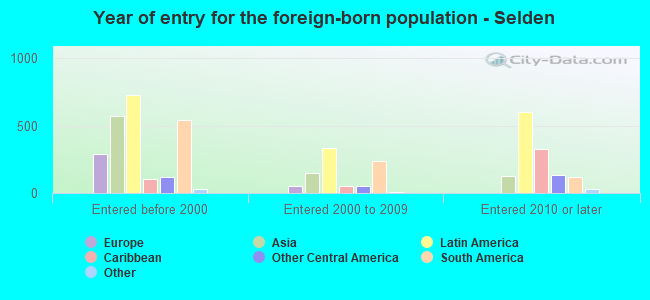
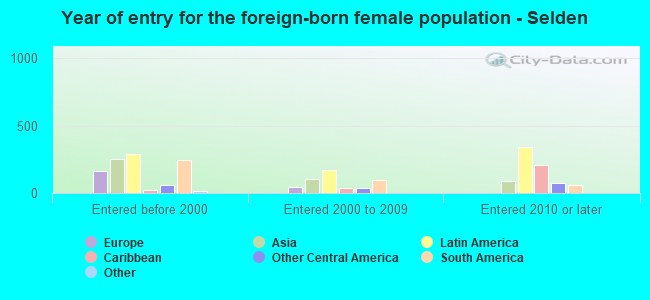
Foreign-born residents in Selden 2,727 residents are foreign born (6.8% Latin America , 3.9% Asia , 1.8% Europe ).
This city:
12.5%New York:
22.6%
Marital status for residents in Selden Marital status - White (Caucasian) population 15 years and over
Males 36.2% Never married52.2% Now married3.2% Separated2.5% Widowed5.8% DivorcedFemales 32.0% Never married47.4% Now married1.2% Separated12.6% Widowed6.8% DivorcedWomen who gave birth in the past 12 months Now married:
100.0% (94)Unmarried:
0.0% (0)
Women who did not give birth in the past 12 months Now married:
40.1% (1,191)Unmarried:
59.9% (1,780)
Marital status - Black or African American population 15 years and over
Males 18.8% Never married60.5% Now married2.6% Separated0.0% Widowed18.2% DivorcedFemales 35.5% Never married55.7% Now married0.0% Separated0.0% Widowed8.8% DivorcedWomen who did not give birth in the past 12 months Now married:
43.2% (97)Unmarried:
56.8% (128)
Marital status - Asian population 15 years and over
Males 23.0% Never married64.4% Now married0.0% Separated2.6% Widowed10.0% DivorcedFemales 27.5% Never married64.3% Now married0.0% Separated6.4% Widowed1.7% DivorcedWomen who gave birth in the past 12 months Now married:
100.0% (42)Unmarried:
0.0% (0)
Women who did not give birth in the past 12 months Now married:
54.7% (187)Unmarried:
45.3% (155)
Marital status - Other race population 15 years and over
Males 48.3% Never married37.5% Now married0.0% Separated6.4% Widowed7.7% DivorcedFemales 5.8% Never married57.2% Now married11.2% Separated10.2% Widowed15.7% DivorcedWomen who did not give birth in the past 12 months Now married:
72.7% (260)Unmarried:
27.3% (98)
Marital status - Two or more races population 15 years and over
Males 45.5% Never married50.5% Now married0.0% Separated0.7% Widowed3.4% DivorcedFemales 45.8% Never married44.3% Now married0.0% Separated5.7% Widowed4.2% DivorcedWomen who did not give birth in the past 12 months Now married:
39.3% (395)Unmarried:
60.7% (610)
Marital status - White alone, not Hispanic / Latino population 15 years and over
Males 34.9% Never married52.9% Now married3.6% Separated2.8% Widowed5.9% DivorcedFemales 31.4% Never married47.6% Now married1.2% Separated13.1% Widowed6.7% DivorcedWomen who gave birth in the past 12 months Now married:
100.0% (98)Unmarried:
0.0% (0)
Women who did not give birth in the past 12 months Now married:
39.4% (1,142)Unmarried:
60.6% (1,755)
Marital status - Hispanic or Latino population 15 years and over
Males 47.3% Never married45.1% Now married0.0% Separated2.1% Widowed5.5% DivorcedFemales 34.4% Never married47.3% Now married2.9% Separated8.2% Widowed7.2% DivorcedWomen who gave birth in the past 12 months Now married:
100.0% (5)Unmarried:
0.0% (0)
Women who did not give birth in the past 12 months Now married:
50.6% (511)Unmarried:
49.4% (499)
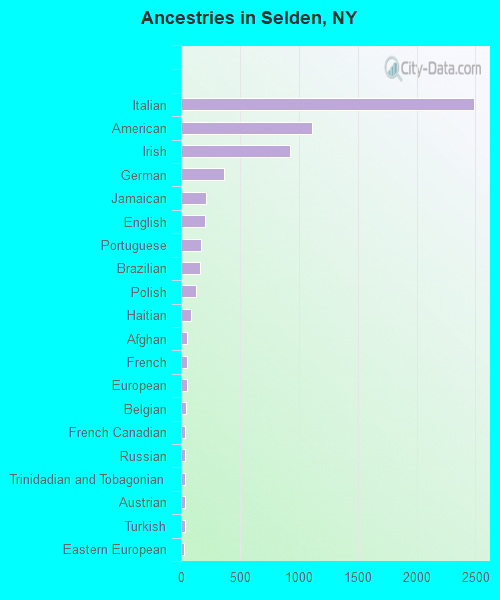
Ancestries in Selden
2,491 23.9% Italian1,116 10.7% American928 8.9% Irish361 3.5% German209 2.0% Jamaican202 1.9% English173 1.7% Portuguese159 1.5% Brazilian127 1.2% Polish81 0.8% Haitian55 0.5% Afghan50 0.5% French49 0.5% European40 0.4% Belgian38 0.4% French Canadian38 0.4% Russian37 0.4% Trinidadian and Tobagonian31 0.3% Austrian31 0.3% Turkish26 0.2% Eastern European20 0.2% Hungarian19 0.2% Egyptian16 0.2% Guyanese14 0.1% Norwegian13 0.1% Cypriot10 0.10% Scottish10 0.10% West Indian8 0.08% Slovak6 0.06% Czech
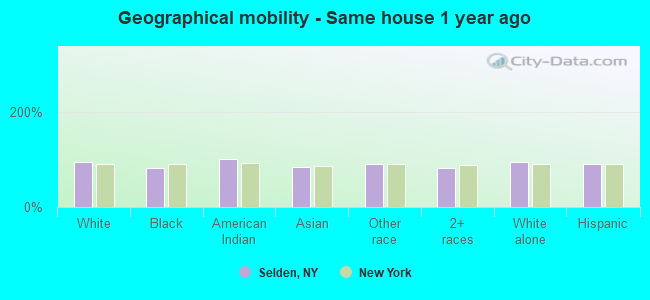
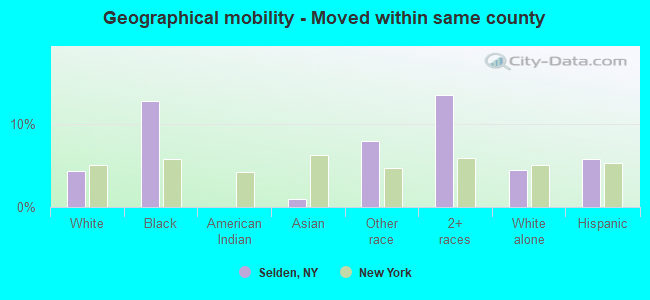
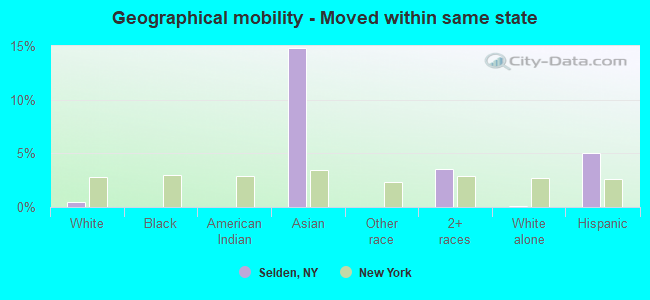
Geographical mobility in Selden Same house 1 year ago 13,265 95.0% White (Caucasian)697 81.4% Black or African American164 100.0% American Indian / Alaska Native1,174 84.0% Asian1,400 91.1% Other race3,225 80.5% Two or more races12,783 95.2% White alone, not Hispanic / Latino4,242 89.6% Hispanic or LatinoMoved within same county 606 4.3% White / Caucasian110 12.8% Black or African American13 0.9% Asian122 8.0% Other race542 13.5% Two or more races609 4.5% White alone, not Hispanic / Latino273 5.8% Hispanic or LatinoMoved within same state 66 0.5% White / Caucasian207 14.8% Asian143 3.6% Two or more races16 0.1% White alone, not Hispanic / Latino237 5.0% Hispanic or LatinoMoved from different state 19 0.1% White / Caucasian22 2.6% Black or African American5 0.3% Asian20 0.1% White alone, not Hispanic / LatinoMoved from abroad 16 0.1% White14 1.6% Black or African American25 1.8% Asian10 0.3% Two or more races21 0.2% White alone, not Hispanic / Latino11 0.2% Hispanic or Latino
Children Nativity (place of birth) in Selden
Children under 6 years - Living with two parents Both parents native 796 100.0% NativeBoth parents foreign-born 201 100.0% NativeOne native, one foreign-born parent 136 100.0% NativeChildren under 6 years - Living with one parent Native parent 143 95.4% Native7 4.6% Foreign-bornForeign-born parent 87 100.0% NativeChildren 6 to 17 years - Living with two parents Both parents native 1,520 100.0% Native0 0.0% Foreign-bornBoth parents foreign-born 515 90.8% Native52 9.2% Foreign-bornOne native, one foreign-born parent 164 100.0% NativeChildren 6 to 17 years - Living with one parent Native parent 438 100.0% NativeForeign-born parent 219 62.3% Native133 37.7% Foreign-born
Grandparents responsible for own grandchildren in Selden
Grandparents (30 to 59 years) White / Caucasian 20 27.8% Responsible for grandchildren51 72.2% Not responsible for grandchildrenBlack or African American 22 100.0% Not responsible for grandchildrenAsian 2 100.0% Responsible for grandchildrenOther race 22 100.0% Not responsible for grandchildrenTwo or more races 67 100.0% Responsible for grandchildrenWhite alone, not Hispanic / Latino 19 38.3% Responsible for grandchildren31 61.7% Not responsible for grandchildrenHispanic or Latino 57 100.0% Not responsible for grandchildrenGrandparents (60 years and over) White / Caucasian 15 9.1% Responsible for grandchildren149 90.9% Not responsible for grandchildrenBlack or African American 19 100.0% Not responsible for grandchildrenAsian 15 23.9% Responsible for grandchildren49 76.1% Not responsible for grandchildrenOther race 121 100.0% Not responsible for grandchildrenTwo or more races 23 100.0% Not responsible for grandchildrenWhite alone, not Hispanic / Latino 18 10.1% Responsible for grandchildren162 89.9% Not responsible for grandchildrenHispanic or Latino 107 100.0% Not responsible for grandchildren