Races in St. James, New York (NY) Detailed Stats
Data:
Races - White alone (%)
Races - White alone (% change since 2000)
Races - Black alone (%)
Races - Black alone (% change since 2000)
Races - American Indian alone (%)
Races - American Indian alone (% change since 2000)
Races - Asian alone (%)
Races - Asian alone (% change since 2000)
Races - Hispanic (%)
Races - Hispanic (% change since 2000)
Races - Native Hawaiian and Other Pacific Islander alone (%)
Races - Native Hawaiian and Other Pacific Islander alone (% change since 2000)
Races - Two or more races(%)
Races - Two or more races(% change since 2000)
Races - Other race alone (%)
Races - Other race alone (% change since 2000)
Racial diversity
Place of birth - Born in state of residence (%)
Place of birth - Born in state of residence (%) - White
Place of birth - Born in state of residence (%) - Black or African American
Place of birth - Born in state of residence (%) - Asian
Place of birth - Born in state of residence (%) - Hispanic or Latino
Place of birth - Born in state of residence (%) - American Indian and Alaska Native
Place of birth - Born in state of residence (%) - Multirace
Place of birth - Born in state of residence (%) - Other Race
Place of birth - Born in other state (%)
Place of birth - Born in other state (%) - White
Place of birth - Born in other state (%) - Black or African American
Place of birth - Born in other state (%) - Asian
Place of birth - Born in other state (%) - Hispanic or Latino
Place of birth - Born in other state (%) - American Indian and Alaska Native
Place of birth - Born in other state (%) - Multirace
Place of birth - Born in other state (%) - Other Race
Place of birth - Native, outside of US (%)
Place of birth - Native, outside of US (%) - White
Place of birth - Native, outside of US (%) - Black or African American
Place of birth - Native, outside of US (%) - Asian
Place of birth - Native, outside of US (%) - Hispanic or Latino
Place of birth - Native, outside of US (%) - American Indian and Alaska Native
Place of birth - Native, outside of US (%) - Multirace
Place of birth - Native, outside of US (%) - Other Race
Place of birth - Foreign born (%)
Place of birth - Foreign born (%) - White
Place of birth - Foreign born (%) - Black or African American
Place of birth - Foreign born (%) - Asian
Place of birth - Foreign born (%) - Hispanic or Latino
Place of birth - Foreign born (%) - American Indian and Alaska Native
Place of birth - Foreign born (%) - Multirace
Place of birth - Foreign born (%) - Other Race
Residents speaking English at home (%)
Residents speaking English at home - Born in the United States (%)
Residents speaking English at home - Native, born elsewhere (%)
Residents speaking English at home - Foreign born (%)
Residents speaking Spanish at home (%)
Residents speaking Spanish at home - Born in the United States (%)
Residents speaking Spanish at home - Native, born elsewhere (%)
Residents speaking Spanish at home - Foreign born (%)
Residents speaking other language at home (%)
Residents speaking other language at home - Born in the United States (%)
Residents speaking other language at home - Native, born elsewhere (%)
Residents speaking other language at home - Foreign born (%)
Marital status - Never married (%)
Marital status - Now married (%)
Marital status - Separated (%)
Marital status - Widowed (%)
Marital status - Divorced (%)
Ancestries Reported - Arab (%)
Ancestries Reported - Czech (%)
Ancestries Reported - Danish (%)
Ancestries Reported - Dutch (%)
Ancestries Reported - English (%)
Ancestries Reported - French (%)
Ancestries Reported - French Canadian (%)
Ancestries Reported - German (%)
Ancestries Reported - Greek (%)
Ancestries Reported - Hungarian (%)
Ancestries Reported - Irish (%)
Ancestries Reported - Italian (%)
Ancestries Reported - Lithuanian (%)
Ancestries Reported - Norwegian (%)
Ancestries Reported - Polish (%)
Ancestries Reported - Portuguese (%)
Ancestries Reported - Russian (%)
Ancestries Reported - Scotch-Irish (%)
Ancestries Reported - Scottish (%)
Ancestries Reported - Slovak (%)
Ancestries Reported - Subsaharan African (%)
Ancestries Reported - Swedish (%)
Ancestries Reported - Swiss (%)
Ancestries Reported - Ukrainian (%)
Ancestries Reported - United States (%)
Ancestries Reported - Welsh (%)
Ancestries Reported - West Indian (%)
Ancestries Reported - Other (%)
Geographical mobility - Same house 1 year ago (%)
Geographical mobility - Same house 1 year ago (%) - White
Geographical mobility - Same house 1 year ago (%) - Black or African American
Geographical mobility - Same house 1 year ago (%) - Asian
Geographical mobility - Same house 1 year ago (%) - Hispanic or Latino
Geographical mobility - Same house 1 year ago (%) - American Indian and Alaska Native
Geographical mobility - Same house 1 year ago (%) - Multirace
Geographical mobility - Same house 1 year ago (%) - Other Race
Geographical mobility - Moved within same county (%)
Geographical mobility - Moved within same county (%) - White
Geographical mobility - Moved within same county (%) - Black or African American
Geographical mobility - Moved within same county (%) - Asian
Geographical mobility - Moved within same county (%) - Hispanic or Latino
Geographical mobility - Moved within same county (%) - American Indian and Alaska Native
Geographical mobility - Moved within same county (%) - Multirace
Geographical mobility - Moved within same county (%) - Other Race
Geographical mobility - Moved from different county within same state (%)
Geographical mobility - Moved from different county within same state (%) - White
Geographical mobility - Moved from different county within same state (%) - Black or African American
Geographical mobility - Moved from different county within same state (%) - Asian
Geographical mobility - Moved from different county within same state (%) - Hispanic or Latino
Geographical mobility - Moved from different county within same state (%) - American Indian and Alaska Native
Geographical mobility - Moved from different county within same state (%) - Multirace
Geographical mobility - Moved from different county within same state (%) - Other Race
Geographical mobility - Moved from different state (%)
Geographical mobility - Moved from different state (%) - White
Geographical mobility - Moved from different state (%) - Black or African American
Geographical mobility - Moved from different state (%) - Asian
Geographical mobility - Moved from different state (%) - Hispanic or Latino
Geographical mobility - Moved from different state (%) - American Indian and Alaska Native
Geographical mobility - Moved from different state (%) - Multirace
Geographical mobility - Moved from different state (%) - Other Race
Geographical mobility - Moved from abroad (%)
Geographical mobility - Moved from abroad (%) - White
Geographical mobility - Moved from abroad (%) - Black or African American
Geographical mobility - Moved from abroad (%) - Asian
Geographical mobility - Moved from abroad (%) - Hispanic or Latino
Geographical mobility - Moved from abroad (%) - American Indian and Alaska Native
Geographical mobility - Moved from abroad (%) - Multirace
Geographical mobility - Moved from abroad (%) - Other Race
Place of birth for the foreign-born population - Ireland (%)
Place of birth for the foreign-born population - Denmark (%)
Place of birth for the foreign-born population - Norway (%)
Place of birth for the foreign-born population - Sweden (%)
Place of birth for the foreign-born population - United Kingdom (%)
Place of birth for the foreign-born population - England (%)
Place of birth for the foreign-born population - Scotland (%)
Place of birth for the foreign-born population - Other Northern Europe (%)
Place of birth for the foreign-born population - Austria (%)
Place of birth for the foreign-born population - Belgium (%)
Place of birth for the foreign-born population - France (%)
Place of birth for the foreign-born population - Germany (%)
Place of birth for the foreign-born population - Netherlands (%)
Place of birth for the foreign-born population - Switzerland (%)
Place of birth for the foreign-born population - Other Western Europe (%)
Place of birth for the foreign-born population - Greece (%)
Place of birth for the foreign-born population - Italy (%)
Place of birth for the foreign-born population - Portugal (%)
Place of birth for the foreign-born population - Spain (%)
Place of birth for the foreign-born population - Other Southern Europe (%)
Place of birth for the foreign-born population - Albania (%)
Place of birth for the foreign-born population - Belarus (%)
Place of birth for the foreign-born population - Bosnia and Herzegovina (%)
Place of birth for the foreign-born population - Bulgaria (%)
Place of birth for the foreign-born population - Croatia (%)
Place of birth for the foreign-born population - Czechoslovakia (%)
Place of birth for the foreign-born population - Hungary (%)
Place of birth for the foreign-born population - Latvia (%)
Place of birth for the foreign-born population - Lithuania (%)
Place of birth for the foreign-born population - North Macedonia (Macedonia) (%)
Place of birth for the foreign-born population - Moldova (%)
Place of birth for the foreign-born population - Poland (%)
Place of birth for the foreign-born population - Romania (%)
Place of birth for the foreign-born population - Russia (%)
Place of birth for the foreign-born population - Serbia (%)
Place of birth for the foreign-born population - Ukraine (%)
Place of birth for the foreign-born population - Other Eastern Europe (%)
Place of birth for the foreign-born population - China (%)
Place of birth for the foreign-born population - Hong Kong (%)
Place of birth for the foreign-born population - Taiwan (%)
Place of birth for the foreign-born population - Japan (%)
Place of birth for the foreign-born population - Korea (%)
Place of birth for the foreign-born population - Other Eastern Asia (%)
Place of birth for the foreign-born population - Afghanistan (%)
Place of birth for the foreign-born population - Bangladesh (%)
Place of birth for the foreign-born population - India (%)
Place of birth for the foreign-born population - Iran (%)
Place of birth for the foreign-born population - Kazakhstan (%)
Place of birth for the foreign-born population - Nepal (%)
Place of birth for the foreign-born population - Pakistan (%)
Place of birth for the foreign-born population - Sri Lanka (%)
Place of birth for the foreign-born population - Uzbekistan (%)
Place of birth for the foreign-born population - Other South Central Asia (%)
Place of birth for the foreign-born population - Burma (%)
Place of birth for the foreign-born population - Cambodia (%)
Place of birth for the foreign-born population - Indonesia (%)
Place of birth for the foreign-born population - Laos (%)
Place of birth for the foreign-born population - Malaysia (%)
Place of birth for the foreign-born population - Philippines (%)
Place of birth for the foreign-born population - Singapore (%)
Place of birth for the foreign-born population - Thailand (%)
Place of birth for the foreign-born population - Vietnam (%)
Place of birth for the foreign-born population - Other South Eastern Asia (%)
Place of birth for the foreign-born population - Armenia (%)
Place of birth for the foreign-born population - Iraq (%)
Place of birth for the foreign-born population - Israel (%)
Place of birth for the foreign-born population - Jordan (%)
Place of birth for the foreign-born population - Kuwait (%)
Place of birth for the foreign-born population - Lebanon (%)
Place of birth for the foreign-born population - Saudi Arabia (%)
Place of birth for the foreign-born population - Syria (%)
Place of birth for the foreign-born population - Turkey (%)
Place of birth for the foreign-born population - Yemen (%)
Place of birth for the foreign-born population - Other Western Asia (%)
Place of birth for the foreign-born population - Eritrea (%)
Place of birth for the foreign-born population - Ethiopia (%)
Place of birth for the foreign-born population - Kenya (%)
Place of birth for the foreign-born population - Somalia (%)
Place of birth for the foreign-born population - Uganda (%)
Place of birth for the foreign-born population - Zimbabwe (%)
Place of birth for the foreign-born population - Other Eastern Africa (%)
Place of birth for the foreign-born population - Cameroon (%)
Place of birth for the foreign-born population - Congo (%)
Place of birth for the foreign-born population - Democratic Republic of Congo (Zaire) (%)
Place of birth for the foreign-born population - Other Middle Africa (%)
Place of birth for the foreign-born population - Egypt (%)
Place of birth for the foreign-born population - Morocco (%)
Place of birth for the foreign-born population - Sudan (%)
Place of birth for the foreign-born population - Other Northern Africa (%)
Place of birth for the foreign-born population - South Africa (%)
Place of birth for the foreign-born population - Other Southern Africa (%)
Place of birth for the foreign-born population - Cabo Verde (%)
Place of birth for the foreign-born population - Ghana (%)
Place of birth for the foreign-born population - Liberia (%)
Place of birth for the foreign-born population - Nigeria (%)
Place of birth for the foreign-born population - Senegal (%)
Place of birth for the foreign-born population - Sierra Leone (%)
Place of birth for the foreign-born population - Other Western Africa (%)
Place of birth for the foreign-born population - Australia (%)
Place of birth for the foreign-born population - New Zealand (%)
Place of birth for the foreign-born population - Fiji (%)
Place of birth for the foreign-born population - Micronesia (%)
Place of birth for the foreign-born population - Bahamas (%)
Place of birth for the foreign-born population - Barbados (%)
Place of birth for the foreign-born population - Cuba (%)
Place of birth for the foreign-born population - Dominica (%)
Place of birth for the foreign-born population - Dominican Republic (%)
Place of birth for the foreign-born population - Grenada (%)
Place of birth for the foreign-born population - Haiti (%)
Place of birth for the foreign-born population - Jamaica (%)
Place of birth for the foreign-born population - St. Vincent and the Grenadines (%)
Place of birth for the foreign-born population - Trinidad and Tobago (%)
Place of birth for the foreign-born population - West Indies (%)
Place of birth for the foreign-born population - Other Caribbean (%)
Place of birth for the foreign-born population - Belize (%)
Place of birth for the foreign-born population - Costa Rica (%)
Place of birth for the foreign-born population - El Salvador (%)
Place of birth for the foreign-born population - Guatemala (%)
Place of birth for the foreign-born population - Honduras (%)
Place of birth for the foreign-born population - Mexico (%)
Place of birth for the foreign-born population - Nicaragua (%)
Place of birth for the foreign-born population - Panama (%)
Place of birth for the foreign-born population - Other Central America (%)
Place of birth for the foreign-born population - Argentina (%)
Place of birth for the foreign-born population - Bolivia (%)
Place of birth for the foreign-born population - Brazil (%)
Place of birth for the foreign-born population - Chile (%)
Place of birth for the foreign-born population - Colombia (%)
Place of birth for the foreign-born population - Ecuador (%)
Place of birth for the foreign-born population - Guyana (%)
Place of birth for the foreign-born population - Peru (%)
Place of birth for the foreign-born population - Uruguay (%)
Place of birth for the foreign-born population - Venezuela (%)
Place of birth for the foreign-born population - Other South America (%)
Place of birth for the foreign-born population - Canada (%)
Place of birth for the foreign-born population - Other Northern America (%)
Place of birth for the foreign-born population - Other (%)
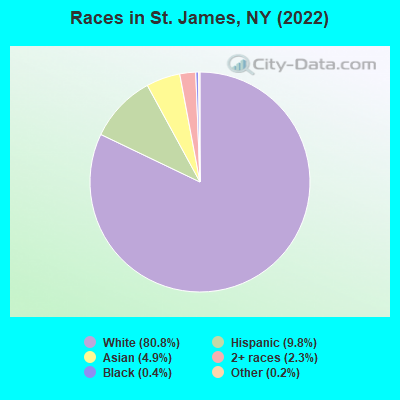
According to 2022 data, the most numerous races in St. James, NY are White alone (11,100 residents), Hispanic (1,344 residents), and Black alone (49 residents). 87.9% of St. James residents speak English at home. 6.7% of St. James, NY residents are foreign-born (2.6% born in Latin America, 2.0% born in Asia, 1.5% born in Europe), which is 227.2% less than the foreign-born rate of 22.0% across the entire state of New York.
Race distribution in St. James
2000 2022
11,760,981 62.0% White alone 2,867,583 15.1% Hispanic 2,812,623 14.8% Black alone 1,035,926 5.5% Asian alone 366,116 1.9% Two or more races 75,499 0.4% Other race alone 52,499 0.3% American Indian alone 5,230 0.03% Native Hawaiian and Other
10,408,933 52.9% White alone 3,867,299 19.7% Hispanic 2,633,840 13.4% Black alone 1,776,286 9.0% Asian alone 732,670 3.7% Two or more races 216,110 1.1% Other race alone 35,082 0.2% American Indian alone 6,931 0.04% Native Hawaiian and Other
Income and house value in St. James Median household income in 2022 $144,819 White non-Hispanic householdersover $200,000 Asian householders$117,157 Some other race householders$72,953 Hispanic or Latino race householdersMedian 2022 house value $668,893 White Non-Hispanic householders$698,909 Black or African American householders over $1,000,000 Asian householders$337,242 Two or more races householders$761,885 Hispanic or Latino householders
Median age by race in St. James
50.6 Median age for White residents45.9 53.4 26.0 Median age for Black or African American residents23.1 43.7 -748,832,865.7 Median age for American Indian / Alaska Native residents-807,017,543.1 -513,692,161.9 32.9 Median age for Asian residents33.7 33.1 -742,816,091.2 Median age for Native Hawaiian / Pacific Islander residents-831,187,409.8 -771,300,447.7 37.4 Median age for Other race residents46.5 26.4 25.4 Median age for Two or more races residents24.7 40.0 50.1 Median age for White alone residents45.6 53.3 29.5 Median age for Hispanic or Latino residents35.6 27.1
Owner/renter occupied households by race in St. James
House owners and renters - White residents 3,859 92.8% Owner occupied302 7.2% Renter occupiedHouse owners and renters - Black or African American residents 22 100.0% Owner occupiedHouse owners and renters - Asian residents 180 94.5% Owner occupied10 5.5% Renter occupiedHouse owners and renters - Other race residents 46 33.3% Owner occupied92 66.7% Renter occupiedHouse owners and renters - Two or more races residents 80 34.6% Owner occupied151 65.4% Renter occupiedHouse owners and renters - White alone residents 3,885 92.5% Owner occupied316 7.5% Renter occupiedHouse owners and renters - Hispanic or Latino residents 154 46.9% Owner occupied175 53.1% Renter occupied
Language usage in St. James
English speakers - Total 87.9% of residents of St. James speak English at home.
6.0% of residents speak Spanish at home 580 72.3% Speak English very well222 27.7% Speak English less than very well4.9% of residents speak other language at home 531 81.9% Speak English very well117 18.1% Speak English less than very well
English speakers - Born in the United States 92.7% of residents of St. James speak English at home.
5.5% of residents speak Spanish at home 52 100.0% Speak English very well1.8% of residents speak other language at home 17 100.0% Speak English very well
English speakers - Native, born elsewhere 59.1% of residents of St. James speak English at home.
39.8% of residents speak Spanish at home 35 94.6% Speak English very well2 5.4% Speak English less than very well
English speakers - Foreign-born 25.2% of residents of St. James speak English at home.
34.8% of residents speak Spanish at home 207 59.3% Speak English very well142 40.7% Speak English less than very well37.0% of residents speak other language at home 285 76.8% Speak English very well86 23.2% Speak English less than very well
White (Caucasian) - Speak only English Native:
98.4% (10,395)Foreign-born:
72.6% (167)
White (Caucasian) - Speak another language Native:
2.5% (267)Foreign-born:
40.5% (93)
Black or African American - Speak another language Native:
28.1% (32)Foreign-born:
89.3% (7)
Asian - Speak only English Native:
66.9% (247)Foreign-born:
9.3% (25)
Asian - Speak another language Native:
29.1% (108)Foreign-born:
92.2% (249)
Other race - Speak another language Native:
73.7% (158)Foreign-born:
100.0% (280)
Two or more races - Speak only English Native:
81.4% (421)Foreign-born:
16.8% (32)
Two or more races - Speak another language Native:
19.2% (99)Foreign-born:
82.6% (156)
White alone - Speak only English Native:
98.0% (10,333)Foreign-born:
66.8% (182)
White alone - Speak another language Native:
1.8% (191)Foreign-born:
33.3% (91)
Hispanic or Latino - Speak another language Native:
43.2% (370)Foreign-born:
100.0% (369)
Foreign-born residents in St. James 924 residents are foreign born (2.6% Latin America , 2.0% Asia , 1.5% Europe ).
This city:
6.7%New York:
22.6%
Marital status for residents in St. James Marital status - White (Caucasian) population 15 years and over
Males 33.8% Never married57.3% Now married1.6% Separated2.2% Widowed5.2% DivorcedFemales 21.7% Never married52.2% Now married1.9% Separated15.9% Widowed8.3% DivorcedWomen who gave birth in the past 12 months Now married:
100.0% (28)Unmarried:
0.0% (0)
Women who did not give birth in the past 12 months Now married:
48.2% (912)Unmarried:
51.8% (981)
Marital status - Black or African American population 15 years and over
Males 55.4% Never married41.5% Now married3.1% Separated0.0% Widowed0.0% DivorcedFemales 43.2% Never married27.3% Now married0.0% Separated29.5% Widowed0.0% DivorcedWomen who gave birth in the past 12 months Now married:
0.0% (0)Unmarried:
100.0% (13)
Women who did not give birth in the past 12 months Now married:
92.3% (12)Unmarried:
7.7% (1)
Marital status - Asian population 15 years and over
Males 22.4% Never married77.6% Now married0.0% Separated0.0% Widowed0.0% DivorcedFemales 13.5% Never married86.5% Now married0.0% Separated0.0% Widowed0.0% DivorcedWomen who gave birth in the past 12 months Now married:
100.0% (117)Unmarried:
0.0% (0)
Women who did not give birth in the past 12 months Now married:
72.6% (110)Unmarried:
27.4% (42)
Marital status - Other race population 15 years and over
Males 1.5% Never married53.8% Now married27.3% Separated0.0% Widowed17.4% DivorcedFemales 66.1% Never married28.9% Now married0.0% Separated1.7% Widowed3.3% DivorcedWomen who did not give birth in the past 12 months Now married:
25.6% (58)Unmarried:
74.4% (169)
Marital status - Two or more races population 15 years and over
Males 79.0% Never married17.2% Now married3.9% Separated0.0% Widowed0.0% DivorcedFemales 40.4% Never married48.4% Now married0.0% Separated6.2% Widowed5.0% DivorcedWomen who did not give birth in the past 12 months Now married:
9.7% (10)Unmarried:
90.3% (95)
Marital status - White alone, not Hispanic / Latino population 15 years and over
Males 33.7% Never married57.2% Now married1.6% Separated2.2% Widowed5.3% DivorcedFemales 22.3% Never married52.6% Now married1.5% Separated15.9% Widowed7.8% DivorcedWomen who gave birth in the past 12 months Now married:
100.0% (30)Unmarried:
0.0% (0)
Women who did not give birth in the past 12 months Now married:
46.6% (900)Unmarried:
53.4% (1,031)
Marital status - Hispanic or Latino population 15 years and over
Males 41.5% Never married42.8% Now married9.6% Separated0.0% Widowed6.1% DivorcedFemales 35.6% Never married40.2% Now married4.9% Separated8.8% Widowed10.4% DivorcedWomen who gave birth in the past 12 months Now married:
0.0% (0)Unmarried:
100.0% (13)
Women who did not give birth in the past 12 months Now married:
42.2% (151)Unmarried:
57.8% (206)
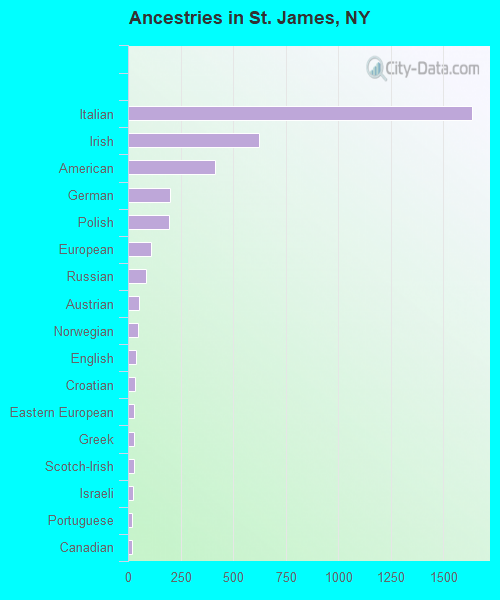
Ancestries in St. James
1,636 30.8% Italian621 11.7% Irish416 7.8% American202 3.8% German197 3.7% Polish108 2.0% European85 1.6% Russian51 1.0% Austrian47 0.9% Norwegian37 0.7% English32 0.6% Croatian30 0.6% Eastern European29 0.5% Greek27 0.5% Scotch-Irish22 0.4% Israeli19 0.4% Portuguese17 0.3% Canadian12 0.2% Egyptian10 0.2% Serbian10 0.2% Swedish9 0.2% Guyanese9 0.2% Ukrainian7 0.1% Scottish6 0.1% French6 0.1% Haitian6 0.1% Yugoslavian5 0.09% British4 0.08% Moroccan1 0.02% Nigerian1 0.02% British West Indian
Children Nativity (place of birth) in St. James
Children under 6 years - Living with two parents Both parents native 396 100.0% NativeBoth parents foreign-born 19 100.0% NativeOne native, one foreign-born parent 87 100.0% NativeChildren under 6 years - Living with one parent Native parent 51 100.0% Native
Children 6 to 17 years - Living with two parents Both parents native 1,308 98.5% Native19 1.5% Foreign-bornBoth parents foreign-born 152 100.0% NativeOne native, one foreign-born parent 118 100.0% NativeChildren 6 to 17 years - Living with one parent Native parent 456 100.0% Native
Grandparents responsible for own grandchildren in St. James
Grandparents (30 to 59 years) White / Caucasian 66 100.0% Responsible for grandchildrenBlack or African American 21 100.0% Responsible for grandchildrenOther race 31 100.0% Responsible for grandchildrenWhite alone, not Hispanic / Latino 64 100.0% Responsible for grandchildrenHispanic or Latino 53 100.0% Responsible for grandchildrenGrandparents (60 years and over) White / Caucasian 54 51.3% Responsible for grandchildren51 48.7% Not responsible for grandchildrenWhite alone, not Hispanic / Latino 37 40.2% Responsible for grandchildren56 59.8% Not responsible for grandchildrenHispanic or Latino 17 100.0% Responsible for grandchildren