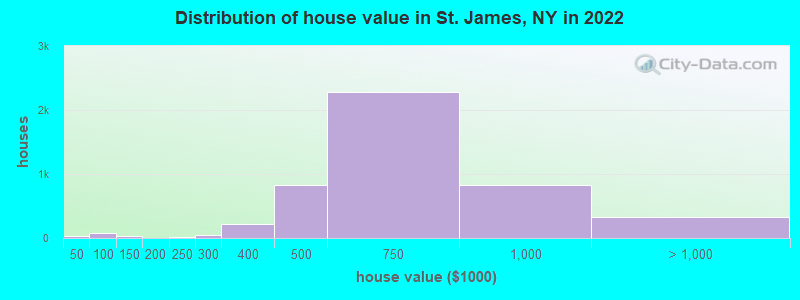
Estimated median house or condo value in 2022: $663,891 (it was $225,600 in 2000)
St. James:
$663,891
NY:
$400,400
Mean prices in 2022:all housing units: $642,799; detached houses: $700,465; townhouses or other attached units: $447,483; in 2-unit structures: $398,608; in 3-to-4-unit structures: $293,860; in 5-or-more-unit structures: $334,235
Median gross rent in 2022: $2,056.
March 2022 cost of living index in St. James: 150.9 (very high, U.S. average is 100)
Percentage of residents living in poverty in 2022: 1.7%
(1.6% for White Non-Hispanic residents, 0.8% for Black residents, 3.0% for Hispanic or Latino residents, 0.6% for other race residents, 1.6% for two or more races residents)
According to our research of New York and other state lists, there were 4 registered sex offenders living in St. James, New York as of April 25, 2024. The ratio of all residents to sex offenders in St. James is 3,365 to 1. The ratio of registered sex offenders to all residents in this city is much lower than the state average.
Recent articles from our blog. Our writers, many of them Ph.D. graduates or candidates, create easy-to-read articles on a wide variety of topics.
Latest news from St. James, NY collected exclusively by city-data.com from local newspapers, TV, and radio stations
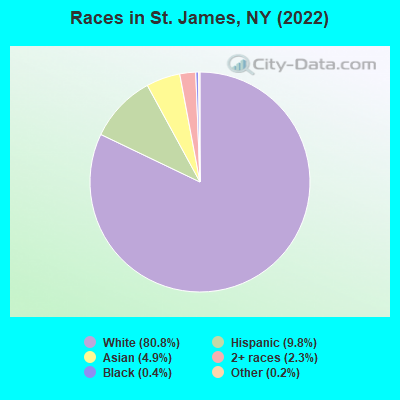
Ancestries: Italian (30.6%), American (11.5%), Irish (11.2%), Polish (4.3%), German (4.0%), Russian (2.4%).
Current Local Time: EST time zone
Land area: 4.54 square miles.
Population density: 2,940 people per square mile (average).
924 residents are foreign born (2.6% Latin America, 2.0% Asia, 1.5% Europe).
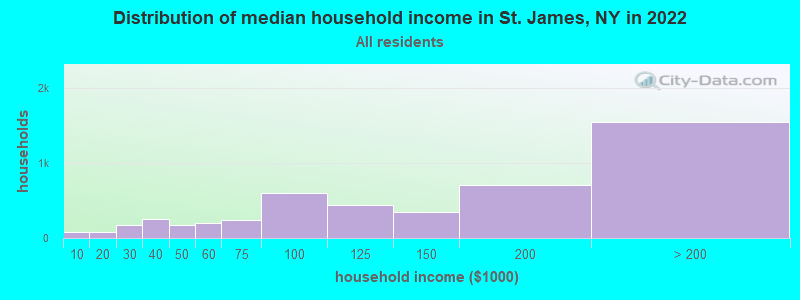
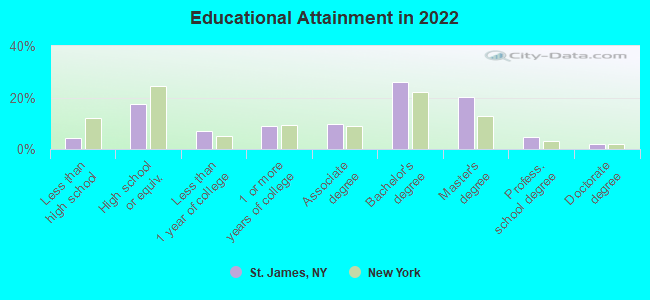
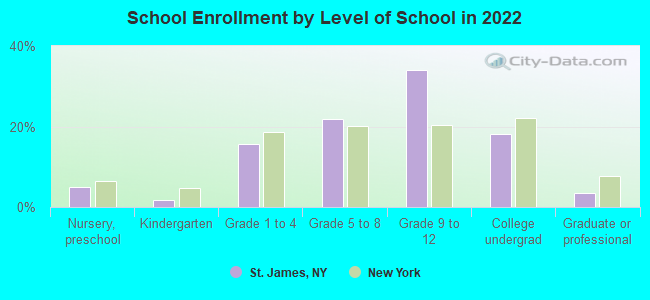
This place:
6.7%
New York:
22.6%
Median real estate property taxes paid for housing units with mortgages in 2022: $10,001 (1.4%) Median real estate property taxes paid for housing units with no mortgage in 2022: $9,738 (1.6%)
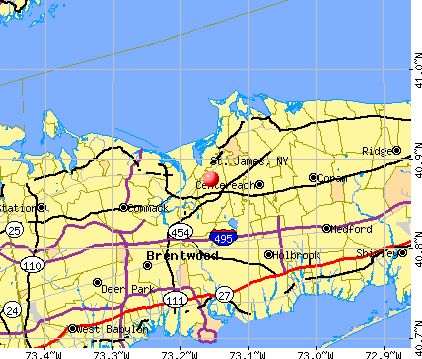
Nearest city with pop. 50,000+: Brentwood, NY (8.1 miles , pop. 53,917).
Nearest city with pop. 200,000+: North Hempstead, NY (27.7 miles , pop. 222,611).
Nearest city with pop. 1,000,000+: Queens, NY (36.6 miles , pop. 2,229,379).
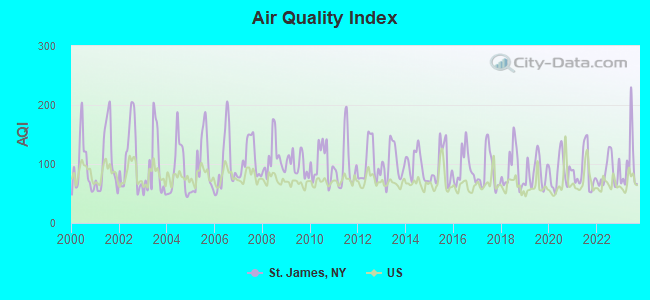
Air Quality Index (AQI) level in 2023 was 98.3. This is worse than average.
City:
98.3
U.S.:
72.6
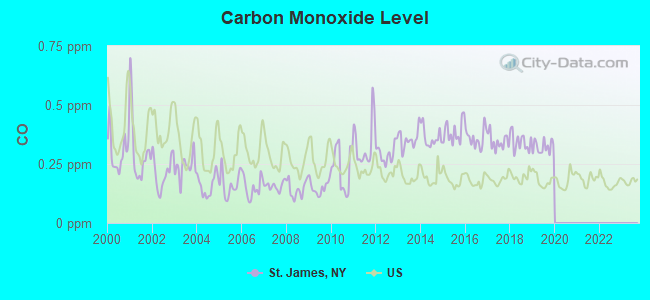
Carbon Monoxide (CO) [ppm] level in 2019 was 0.322. This is worse than average.Closest monitor was 6.1 miles away from the city center.
City:
0.322
U.S.:
0.251
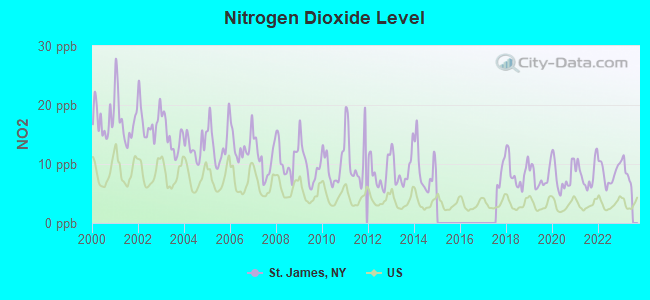
Nitrogen Dioxide (NO2) [ppb] level in 2022 was 8.39. This is significantly worse than average.Closest monitor was 6.1 miles away from the city center.
City:
8.39
U.S.:
5.11
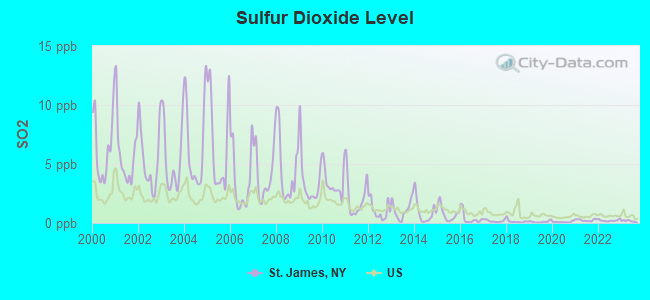
Sulfur Dioxide (SO2) [ppb] level in 2023 was 0.174. This is significantly better than average.Closest monitor was 4.0 miles away from the city center.
City:
0.174
U.S.:
1.515
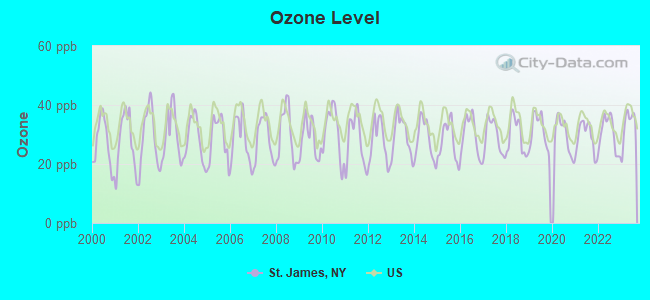
Ozone [ppb] level in 2023 was 33.4. This is about average.Closest monitor was 2.8 miles away from the city center.
City:
33.4
U.S.:
33.3
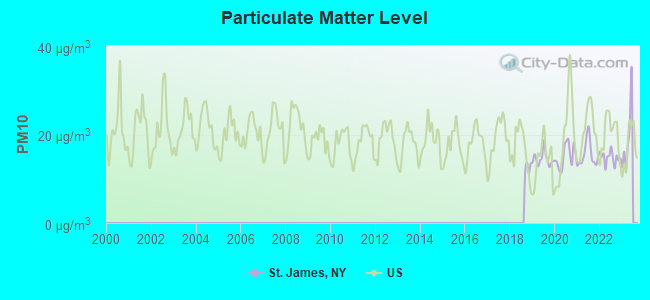
Particulate Matter (PM10) [µg/m3] level in 2022 was 14.8. This is better than average.Closest monitor was 16.6 miles away from the city center.
City:
14.8
U.S.:
19.2
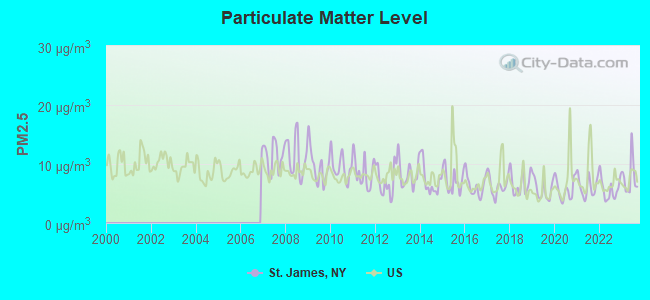
Particulate Matter (PM2.5) [µg/m3] level in 2023 was 7.76. This is about average.Closest monitor was 16.6 miles away from the city center.
City:
7.76
U.S.:
8.11
Tornado activity:
St. James-area historical tornado activity is slightly above New York state average. It is 56% smaller than the overall U.S. average.
On 7/10/1989, a category F4 (max. wind speeds 207-260 mph) tornado 33.0 miles away from the St. James place center injured 40 peopleand causedbetween $50,000,000 and $500,000,000 in damages.
On 7/10/1989, a category F2 (max. wind speeds 113-157 mph) tornado 20.0 miles away from the place center injured one person.
Earthquake activity:
St. James-area historical earthquake activity is significantly above New York state average. It is 71% smaller than the overall U.S. average.
On 10/7/1983 at 10:18:46, a magnitude 5.3 (5.1 MB, 5.3 LG, 5.1 ML, Class: Moderate, Intensity: VI - VII) earthquake occurred 221.2 miles away from the city center On 8/23/2011 at 17:51:04, a magnitude 5.8 (5.8 MW, Depth: 3.7 mi) earthquake occurred 327.7 miles away from the city center On 4/20/2002 at 10:50:47, a magnitude 5.3 (5.3 ML, Depth: 3.0 mi) earthquake occurred 252.9 miles away from the city center On 4/20/2002 at 10:50:47, a magnitude 5.2 (5.2 MB, 4.2 MS, 5.2 MW, 5.0 MW) earthquake occurred 251.3 miles away from the city center On 8/22/1992 at 12:20:32, a magnitude 4.8 (4.8 MB, 3.8 MS, 4.7 LG, Depth: 6.2 mi, Class: Light, Intensity: IV - V) earthquake occurred 193.9 miles away from St. James center On 1/16/1994 at 01:49:16, a magnitude 4.6 (4.6 MB, 4.6 LG, Depth: 3.1 mi) earthquake occurred 156.0 miles away from St. James center Magnitude types: regional Lg-wave magnitude (LG), body-wave magnitude (MB), local magnitude (ML), surface-wave magnitude (MS), moment magnitude (MW)
Natural disasters:
The number of natural disasters in Suffolk County (28) is a lot greater than the US average (15). Major Disasters (Presidential) Declared: 19 Emergencies Declared: 7
Causes of natural disasters: Hurricanes: 9, Floods: 7, Storms: 7, Snowstorms: 4, Winter Storms: 3, Blizzards: 2, Heavy Rain: 1, Power Outage: 1, Tropical Depression: 1, Tropical Storm: 1, Water Shortage: 1, Other: 3 (Note: some incidents may be assigned to more than one category).
Hospitals and medical centers near St. James:
ST JAMES HEALTHCARE CENTER (Nursing Home, about 1 miles away; ST JAMES, NY)
ST JAMES HRF (Nursing Home, about 1 miles away; SAINT JAMES, NY)
MILLS POND NURSING AND REHABILITATION CENTER (Nursing Home, about 1 miles away; ST JAMES, NY)
UCPA OF GREATER SUFFOLK (Hospital, about 1 miles away; SAINT JAMES, NY)
SMITHTOWN CENTER FOR REHAB AND NURSING CARE (Nursing Home, about 1 miles away; SMITHTOWN, NY)
CHRISTIAN NURSING HOSPICE (Hospital, about 2 miles away; NESCONSET, NY)
UCPA OF GREATER SUFFOLK (Hospital, about 2 miles away; STONY BROOK, NY)
Colleges/universities with over 2000 students nearest to St. James:
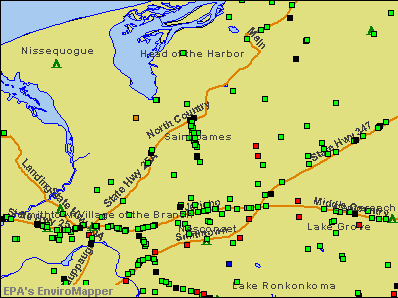
Notable locations in St. James: Saint James Station (A), Saint James Healthcare Center (B), Saint James Fire Department (C). Display/hide their locations on the map
Birthplace of: Soledad O'Brien - Broadcast journalist, Salvatore Avellino - Mobster, Robert White (sculptor) - Artist.
Suffolk County has a predicted average indoor radon screening level less than 2 pCi/L (pico curies per liter) - Low Potential
Average household size:
This place:
2.8 people
New York:
2.6 people
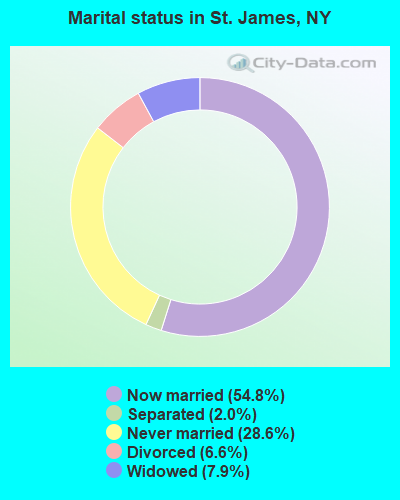
Percentage of family households:
This place:
74.9%
Whole state:
63.5%
Percentage of households with unmarried partners:
This place:
3.6%
Whole state:
6.8%
Likely homosexual households (counted as self-reported same-sex unmarried-partner households)
Lesbian couples: 0.4% of all households
Gay men: 0.4% of all households
People in group quarters in St. James in 2010:
435 people in nursing facilities/skilled-nursing facilities
22 people in group homes intended for adults
3 people in other noninstitutional facilities
People in group quarters in St. James in 2000:
454 people in nursing homes
5 people in homes for the mentally retarded
5 people in religious group quarters
Banks with branches in St. James (2011 data):
Capital One, National Association: Saint James Branch at 245 Lake Avenue, branch established on 1934/01/01. Info updated 2011/07/01: Bank assets: $133,477.8 mil, Deposits: $97,063.7 mil, headquarters in Mclean, VA, positive income, 984 total offices, Holding Company: Capital One Financial Corporation
Religion statistics for St. James, NY (based on Suffolk County data)
Religion
Adherents
Congregations
Catholic
879,457
75
Mainline Protestant
69,205
182
Evangelical Protestant
58,909
264
Other
50,771
124
Orthodox
10,190
10
Black Protestant
8,298
49
None
416,520
-
Source: Clifford Grammich, Kirk Hadaway, Richard Houseal, Dale E.Jones, Alexei Krindatch, Richie Stanley and Richard H.Taylor. 2012. 2010 U.S.Religion Census: Religious Congregations & Membership Study. Association of Statisticians of American Religious Bodies. Jones, Dale E., et al. 2002. Congregations and Membership in the United States 2000. Nashville, TN: Glenmary Research Center. Graphs represent county-level data
Lat: 40.874306 Lon: -73.171444, Call Sign: WQDC724, Assigned Frequencies: 72.2600 MHz, 72.3400 MHz, Grant Date: 07/25/2005, Expiration Date: 07/25/2015, Cancellation Date: 09/26/2015, Certifier: Joseph Piro, Registrant: Primex Wireless, Inc., N3211 County Road H, Lake Geneva, WI 53147, Phone: (262) 248-3000, Fax: (262) 248-0061
FCC Registered Microwave Towers:
2
HQ, 533 Ny-25a (Lat: 40.887306 Lon: -73.158556), Type: Pole, Structure height: 28 m, Overall height: 29 m, Call Sign: WRMF695, Assigned Frequencies: 23470.0 MHz, 23470.0 MHz, 23470.0 MHz, 23470.0 MHz, Grant Date: 04/01/2021, Expiration Date: 04/01/2031, Certifier: Donna Gruner, Registrant: Intelpath, Hinsdale, IL 60522, Phone: (312) 841-9188, Email:
Substation, 216-206 Jefferson Ave (Lat: 40.874500 Lon: -73.158833), Type: Pole, Structure height: 33 m, Overall height: 34 m, Call Sign: WRMF712, Assigned Frequencies: 22270.0 MHz, 22270.0 MHz, 22270.0 MHz, 22270.0 MHz, Grant Date: 04/01/2021, Expiration Date: 04/01/2031, Certifier: Donna Gruner, Registrant: Intelpath, Hinsdale, IL 60522, Phone: (312) 841-9188, Email:
FCC Registered Amateur Radio Licenses:
2
Call Sign: K2YAR, Licensee ID: L00109664, Grant Date: 08/30/1995, Expiration Date: 08/30/2005, Cancellation Date: 02/03/2004, Registrant: Stephen B Auerbach, 13 Meadow Gate East, St. James, NY 11780
Call Sign: K2SBA, Previous Call Sign: K2YAR, Licensee ID: L00109664, Grant Date: 01/04/2014, Expiration Date: 02/03/2024, Certifier: Stephen B Auerbach, Registrant: Stephen B Auerbach, 13 Meadow Gate East, St. James, NY 11780
Home Mortgage Disclosure Act Aggregated Statistics For Year 2009 (Based on 3 full tracts)
A) FHA, FSA/RHS & VA Home Purchase Loans
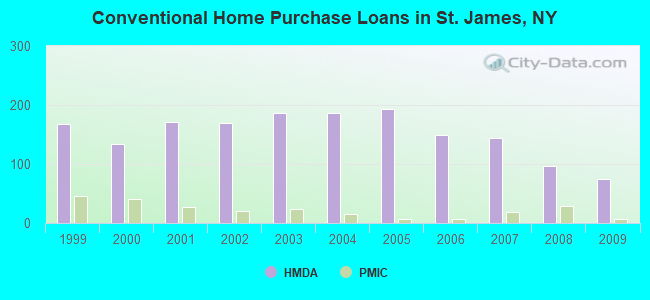
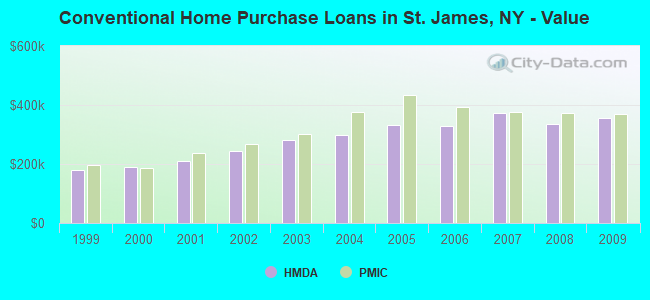
B) Conventional Home Purchase Loans
C) Refinancings
D) Home Improvement Loans
F) Non-occupant Loans on < 5 Family Dwellings (A B C & D)
G) Loans On Manufactured Home Dwelling (A B C & D)
Number
Average Value
Number
Average Value
Number
Average Value
Number
Average Value
Number
Average Value
Number
Average Value
LOANS ORIGINATED
24
$347,083
74
$357,351
213
$279,704
11
$146,727
3
$228,333
1
$320,000
APPLICATIONS APPROVED, NOT ACCEPTED
0
$0
13
$346,846
31
$323,484
9
$77,222
0
$0
0
$0
APPLICATIONS DENIED
5
$424,000
9
$421,778
65
$332,308
16
$109,000
1
$336,000
0
$0
APPLICATIONS WITHDRAWN
3
$351,667
9
$308,333
71
$314,437
3
$418,667
2
$190,000
0
$0
FILES CLOSED FOR INCOMPLETENESS
1
$410,000
2
$360,000
14
$390,214
3
$82,667
0
$0
0
$0
Aggregated Statistics For Year 2008 (Based on 3 full tracts)
A) FHA, FSA/RHS & VA Home Purchase Loans
B) Conventional Home Purchase Loans
C) Refinancings
D) Home Improvement Loans
F) Non-occupant Loans on < 5 Family Dwellings (A B C & D)
Number
Average Value
Number
Average Value
Number
Average Value
Number
Average Value
Number
Average Value
LOANS ORIGINATED
8
$423,250
97
$336,876
107
$264,280
20
$139,650
7
$260,571
APPLICATIONS APPROVED, NOT ACCEPTED
0
$0
10
$320,300
25
$246,480
5
$68,400
1
$260,000
APPLICATIONS DENIED
0
$0
14
$466,571
58
$365,759
14
$86,286
2
$376,000
APPLICATIONS WITHDRAWN
1
$334,000
6
$376,667
47
$351,191
3
$109,333
1
$200,000
FILES CLOSED FOR INCOMPLETENESS
0
$0
3
$355,667
16
$271,812
3
$189,333
0
$0
Aggregated Statistics For Year 2007 (Based on 3 full tracts)
B) Conventional Home Purchase Loans
C) Refinancings
D) Home Improvement Loans
F) Non-occupant Loans on < 5 Family Dwellings (A B C & D)
G) Loans On Manufactured Home Dwelling (A B C & D)
Number
Average Value
Number
Average Value
Number
Average Value
Number
Average Value
Number
Average Value
LOANS ORIGINATED
144
$373,917
194
$276,371
61
$121,311
14
$334,857
0
$0
APPLICATIONS APPROVED, NOT ACCEPTED
14
$296,000
34
$281,647
8
$40,125
2
$240,000
0
$0
APPLICATIONS DENIED
33
$447,576
115
$360,722
26
$197,923
9
$290,444
1
$104,000
APPLICATIONS WITHDRAWN
24
$398,542
52
$379,788
3
$308,000
2
$880,000
0
$0
FILES CLOSED FOR INCOMPLETENESS
9
$413,778
25
$369,440
3
$172,000
0
$0
0
$0
Aggregated Statistics For Year 2006 (Based on 3 full tracts)
B) Conventional Home Purchase Loans
C) Refinancings
D) Home Improvement Loans
F) Non-occupant Loans on < 5 Family Dwellings (A B C & D)
Number
Average Value
Number
Average Value
Number
Average Value
Number
Average Value
LOANS ORIGINATED
150
$328,333
215
$297,623
51
$150,510
7
$334,857
APPLICATIONS APPROVED, NOT ACCEPTED
22
$309,545
40
$256,150
13
$110,308
1
$473,000
APPLICATIONS DENIED
25
$327,320
105
$336,010
17
$146,529
2
$430,000
APPLICATIONS WITHDRAWN
15
$283,267
81
$354,988
10
$358,200
1
$126,000
FILES CLOSED FOR INCOMPLETENESS
7
$369,143
38
$293,579
4
$253,000
0
$0
Aggregated Statistics For Year 2005 (Based on 3 full tracts)
A) FHA, FSA/RHS & VA Home Purchase Loans
B) Conventional Home Purchase Loans
C) Refinancings
D) Home Improvement Loans
F) Non-occupant Loans on < 5 Family Dwellings (A B C & D)
Number
Average Value
Number
Average Value
Number
Average Value
Number
Average Value
Number
Average Value
LOANS ORIGINATED
0
$0
194
$333,613
261
$268,640
39
$144,308
10
$292,900
APPLICATIONS APPROVED, NOT ACCEPTED
1
$150,000
20
$373,250
39
$293,333
12
$111,667
3
$426,333
APPLICATIONS DENIED
0
$0
24
$317,917
85
$297,082
19
$164,421
3
$293,000
APPLICATIONS WITHDRAWN
0
$0
19
$330,947
101
$301,802
7
$514,714
3
$205,000
FILES CLOSED FOR INCOMPLETENESS
0
$0
10
$302,900
75
$360,213
4
$195,000
1
$165,000
Aggregated Statistics For Year 2004 (Based on 3 full tracts)
B) Conventional Home Purchase Loans
C) Refinancings
D) Home Improvement Loans
F) Non-occupant Loans on < 5 Family Dwellings (A B C & D)
G) Loans On Manufactured Home Dwelling (A B C & D)
Number
Average Value
Number
Average Value
Number
Average Value
Number
Average Value
Number
Average Value
LOANS ORIGINATED
186
$299,796
285
$245,979
65
$70,938
18
$213,778
1
$15,000
APPLICATIONS APPROVED, NOT ACCEPTED
22
$296,727
50
$245,860
17
$137,294
3
$144,333
0
$0
APPLICATIONS DENIED
34
$289,529
81
$308,210
31
$97,129
5
$272,000
0
$0
APPLICATIONS WITHDRAWN
19
$260,053
90
$274,211
13
$113,692
2
$478,500
0
$0
FILES CLOSED FOR INCOMPLETENESS
12
$302,833
32
$274,969
6
$52,333
3
$277,667
0
$0
Aggregated Statistics For Year 2003 (Based on 3 full tracts)
A) FHA, FSA/RHS & VA Home Purchase Loans
B) Conventional Home Purchase Loans
C) Refinancings
D) Home Improvement Loans
E) Loans on Dwellings For 5+ Families
F) Non-occupant Loans on < 5 Family Dwellings (A B C & D)
Number
Average Value
Number
Average Value
Number
Average Value
Number
Average Value
Number
Average Value
Number
Average Value
LOANS ORIGINATED
5
$267,600
186
$281,591
781
$202,008
38
$67,395
1
$1,225,000
28
$214,607
APPLICATIONS APPROVED, NOT ACCEPTED
0
$0
31
$291,581
128
$218,641
11
$43,000
0
$0
1
$205,000
APPLICATIONS DENIED
0
$0
19
$324,947
150
$233,747
14
$65,857
0
$0
5
$288,400
APPLICATIONS WITHDRAWN
0
$0
17
$268,471
111
$213,505
8
$72,000
0
$0
2
$248,500
FILES CLOSED FOR INCOMPLETENESS
0
$0
4
$271,500
20
$211,100
2
$100,000
0
$0
0
$0
Aggregated Statistics For Year 2002 (Based on 3 full tracts)
A) FHA, FSA/RHS & VA Home Purchase Loans
B) Conventional Home Purchase Loans
C) Refinancings
D) Home Improvement Loans
F) Non-occupant Loans on < 5 Family Dwellings (A B C & D)
Number
Average Value
Number
Average Value
Number
Average Value
Number
Average Value
Number
Average Value
LOANS ORIGINATED
0
$0
170
$244,471
553
$213,779
57
$72,526
9
$211,889
APPLICATIONS APPROVED, NOT ACCEPTED
1
$192,000
22
$238,000
67
$192,388
23
$47,043
3
$188,667
APPLICATIONS DENIED
0
$0
13
$292,077
91
$201,242
24
$59,250
0
$0
APPLICATIONS WITHDRAWN
1
$189,000
20
$261,750
94
$177,511
14
$88,857
0
$0
FILES CLOSED FOR INCOMPLETENESS
0
$0
6
$254,833
34
$223,824
3
$78,333
1
$250,000
Aggregated Statistics For Year 2001 (Based on 3 full tracts)
A) FHA, FSA/RHS & VA Home Purchase Loans
B) Conventional Home Purchase Loans
C) Refinancings
D) Home Improvement Loans
E) Loans on Dwellings For 5+ Families
F) Non-occupant Loans on < 5 Family Dwellings (A B C & D)
Number
Average Value
Number
Average Value
Number
Average Value
Number
Average Value
Number
Average Value
Number
Average Value
LOANS ORIGINATED
8
$202,750
171
$209,246
366
$173,355
50
$68,420
1
$125,000
8
$141,250
APPLICATIONS APPROVED, NOT ACCEPTED
0
$0
12
$188,083
61
$122,541
28
$41,214
0
$0
1
$100,000
APPLICATIONS DENIED
0
$0
13
$221,462
75
$169,267
17
$67,412
0
$0
2
$230,000
APPLICATIONS WITHDRAWN
1
$236,000
12
$274,333
74
$151,622
21
$48,905
0
$0
0
$0
FILES CLOSED FOR INCOMPLETENESS
0
$0
7
$235,286
17
$138,294
4
$60,000
0
$0
1
$240,000
Aggregated Statistics For Year 2000 (Based on 3 full tracts)
A) FHA, FSA/RHS & VA Home Purchase Loans
B) Conventional Home Purchase Loans
C) Refinancings
D) Home Improvement Loans
E) Loans on Dwellings For 5+ Families
F) Non-occupant Loans on < 5 Family Dwellings (A B C & D)
Number
Average Value
Number
Average Value
Number
Average Value
Number
Average Value
Number
Average Value
Number
Average Value
LOANS ORIGINATED
7
$188,857
134
$191,507
120
$131,483
68
$44,618
1
$27,000
7
$113,000
APPLICATIONS APPROVED, NOT ACCEPTED
2
$158,500
22
$198,773
36
$157,639
25
$43,840
0
$0
2
$137,500
APPLICATIONS DENIED
1
$152,000
19
$188,684
52
$126,654
22
$51,682
0
$0
0
$0
APPLICATIONS WITHDRAWN
0
$0
13
$224,308
67
$100,179
10
$50,700
0
$0
1
$124,000
FILES CLOSED FOR INCOMPLETENESS
0
$0
8
$200,375
14
$188,071
3
$63,000
0
$0
0
$0
Aggregated Statistics For Year 1999 (Based on 3 full tracts)
A) FHA, FSA/RHS & VA Home Purchase Loans
B) Conventional Home Purchase Loans
C) Refinancings
D) Home Improvement Loans
F) Non-occupant Loans on < 5 Family Dwellings (A B C & D)


 Recent articles from our blog. Our writers, many of them Ph.D. graduates or candidates, create easy-to-read articles on a wide variety of topics.


 (8.1 miles