Races in Stanford, California (CA) Detailed Stats
Data:
Races - White alone (%)
Races - White alone (% change since 2000)
Races - Black alone (%)
Races - Black alone (% change since 2000)
Races - American Indian alone (%)
Races - American Indian alone (% change since 2000)
Races - Asian alone (%)
Races - Asian alone (% change since 2000)
Races - Hispanic (%)
Races - Hispanic (% change since 2000)
Races - Native Hawaiian and Other Pacific Islander alone (%)
Races - Native Hawaiian and Other Pacific Islander alone (% change since 2000)
Races - Two or more races(%)
Races - Two or more races(% change since 2000)
Races - Other race alone (%)
Races - Other race alone (% change since 2000)
Racial diversity
Place of birth - Born in state of residence (%)
Place of birth - Born in state of residence (%) - White
Place of birth - Born in state of residence (%) - Black or African American
Place of birth - Born in state of residence (%) - Asian
Place of birth - Born in state of residence (%) - Hispanic or Latino
Place of birth - Born in state of residence (%) - American Indian and Alaska Native
Place of birth - Born in state of residence (%) - Multirace
Place of birth - Born in state of residence (%) - Other Race
Place of birth - Born in other state (%)
Place of birth - Born in other state (%) - White
Place of birth - Born in other state (%) - Black or African American
Place of birth - Born in other state (%) - Asian
Place of birth - Born in other state (%) - Hispanic or Latino
Place of birth - Born in other state (%) - American Indian and Alaska Native
Place of birth - Born in other state (%) - Multirace
Place of birth - Born in other state (%) - Other Race
Place of birth - Native, outside of US (%)
Place of birth - Native, outside of US (%) - White
Place of birth - Native, outside of US (%) - Black or African American
Place of birth - Native, outside of US (%) - Asian
Place of birth - Native, outside of US (%) - Hispanic or Latino
Place of birth - Native, outside of US (%) - American Indian and Alaska Native
Place of birth - Native, outside of US (%) - Multirace
Place of birth - Native, outside of US (%) - Other Race
Place of birth - Foreign born (%)
Place of birth - Foreign born (%) - White
Place of birth - Foreign born (%) - Black or African American
Place of birth - Foreign born (%) - Asian
Place of birth - Foreign born (%) - Hispanic or Latino
Place of birth - Foreign born (%) - American Indian and Alaska Native
Place of birth - Foreign born (%) - Multirace
Place of birth - Foreign born (%) - Other Race
Residents speaking English at home (%)
Residents speaking English at home - Born in the United States (%)
Residents speaking English at home - Native, born elsewhere (%)
Residents speaking English at home - Foreign born (%)
Residents speaking Spanish at home (%)
Residents speaking Spanish at home - Born in the United States (%)
Residents speaking Spanish at home - Native, born elsewhere (%)
Residents speaking Spanish at home - Foreign born (%)
Residents speaking other language at home (%)
Residents speaking other language at home - Born in the United States (%)
Residents speaking other language at home - Native, born elsewhere (%)
Residents speaking other language at home - Foreign born (%)
Marital status - Never married (%)
Marital status - Now married (%)
Marital status - Separated (%)
Marital status - Widowed (%)
Marital status - Divorced (%)
Ancestries Reported - Arab (%)
Ancestries Reported - Czech (%)
Ancestries Reported - Danish (%)
Ancestries Reported - Dutch (%)
Ancestries Reported - English (%)
Ancestries Reported - French (%)
Ancestries Reported - French Canadian (%)
Ancestries Reported - German (%)
Ancestries Reported - Greek (%)
Ancestries Reported - Hungarian (%)
Ancestries Reported - Irish (%)
Ancestries Reported - Italian (%)
Ancestries Reported - Lithuanian (%)
Ancestries Reported - Norwegian (%)
Ancestries Reported - Polish (%)
Ancestries Reported - Portuguese (%)
Ancestries Reported - Russian (%)
Ancestries Reported - Scotch-Irish (%)
Ancestries Reported - Scottish (%)
Ancestries Reported - Slovak (%)
Ancestries Reported - Subsaharan African (%)
Ancestries Reported - Swedish (%)
Ancestries Reported - Swiss (%)
Ancestries Reported - Ukrainian (%)
Ancestries Reported - United States (%)
Ancestries Reported - Welsh (%)
Ancestries Reported - West Indian (%)
Ancestries Reported - Other (%)
Geographical mobility - Same house 1 year ago (%)
Geographical mobility - Same house 1 year ago (%) - White
Geographical mobility - Same house 1 year ago (%) - Black or African American
Geographical mobility - Same house 1 year ago (%) - Asian
Geographical mobility - Same house 1 year ago (%) - Hispanic or Latino
Geographical mobility - Same house 1 year ago (%) - American Indian and Alaska Native
Geographical mobility - Same house 1 year ago (%) - Multirace
Geographical mobility - Same house 1 year ago (%) - Other Race
Geographical mobility - Moved within same county (%)
Geographical mobility - Moved within same county (%) - White
Geographical mobility - Moved within same county (%) - Black or African American
Geographical mobility - Moved within same county (%) - Asian
Geographical mobility - Moved within same county (%) - Hispanic or Latino
Geographical mobility - Moved within same county (%) - American Indian and Alaska Native
Geographical mobility - Moved within same county (%) - Multirace
Geographical mobility - Moved within same county (%) - Other Race
Geographical mobility - Moved from different county within same state (%)
Geographical mobility - Moved from different county within same state (%) - White
Geographical mobility - Moved from different county within same state (%) - Black or African American
Geographical mobility - Moved from different county within same state (%) - Asian
Geographical mobility - Moved from different county within same state (%) - Hispanic or Latino
Geographical mobility - Moved from different county within same state (%) - American Indian and Alaska Native
Geographical mobility - Moved from different county within same state (%) - Multirace
Geographical mobility - Moved from different county within same state (%) - Other Race
Geographical mobility - Moved from different state (%)
Geographical mobility - Moved from different state (%) - White
Geographical mobility - Moved from different state (%) - Black or African American
Geographical mobility - Moved from different state (%) - Asian
Geographical mobility - Moved from different state (%) - Hispanic or Latino
Geographical mobility - Moved from different state (%) - American Indian and Alaska Native
Geographical mobility - Moved from different state (%) - Multirace
Geographical mobility - Moved from different state (%) - Other Race
Geographical mobility - Moved from abroad (%)
Geographical mobility - Moved from abroad (%) - White
Geographical mobility - Moved from abroad (%) - Black or African American
Geographical mobility - Moved from abroad (%) - Asian
Geographical mobility - Moved from abroad (%) - Hispanic or Latino
Geographical mobility - Moved from abroad (%) - American Indian and Alaska Native
Geographical mobility - Moved from abroad (%) - Multirace
Geographical mobility - Moved from abroad (%) - Other Race
Place of birth for the foreign-born population - Ireland (%)
Place of birth for the foreign-born population - Denmark (%)
Place of birth for the foreign-born population - Norway (%)
Place of birth for the foreign-born population - Sweden (%)
Place of birth for the foreign-born population - United Kingdom (%)
Place of birth for the foreign-born population - England (%)
Place of birth for the foreign-born population - Scotland (%)
Place of birth for the foreign-born population - Other Northern Europe (%)
Place of birth for the foreign-born population - Austria (%)
Place of birth for the foreign-born population - Belgium (%)
Place of birth for the foreign-born population - France (%)
Place of birth for the foreign-born population - Germany (%)
Place of birth for the foreign-born population - Netherlands (%)
Place of birth for the foreign-born population - Switzerland (%)
Place of birth for the foreign-born population - Other Western Europe (%)
Place of birth for the foreign-born population - Greece (%)
Place of birth for the foreign-born population - Italy (%)
Place of birth for the foreign-born population - Portugal (%)
Place of birth for the foreign-born population - Spain (%)
Place of birth for the foreign-born population - Other Southern Europe (%)
Place of birth for the foreign-born population - Albania (%)
Place of birth for the foreign-born population - Belarus (%)
Place of birth for the foreign-born population - Bosnia and Herzegovina (%)
Place of birth for the foreign-born population - Bulgaria (%)
Place of birth for the foreign-born population - Croatia (%)
Place of birth for the foreign-born population - Czechoslovakia (%)
Place of birth for the foreign-born population - Hungary (%)
Place of birth for the foreign-born population - Latvia (%)
Place of birth for the foreign-born population - Lithuania (%)
Place of birth for the foreign-born population - North Macedonia (Macedonia) (%)
Place of birth for the foreign-born population - Moldova (%)
Place of birth for the foreign-born population - Poland (%)
Place of birth for the foreign-born population - Romania (%)
Place of birth for the foreign-born population - Russia (%)
Place of birth for the foreign-born population - Serbia (%)
Place of birth for the foreign-born population - Ukraine (%)
Place of birth for the foreign-born population - Other Eastern Europe (%)
Place of birth for the foreign-born population - China (%)
Place of birth for the foreign-born population - Hong Kong (%)
Place of birth for the foreign-born population - Taiwan (%)
Place of birth for the foreign-born population - Japan (%)
Place of birth for the foreign-born population - Korea (%)
Place of birth for the foreign-born population - Other Eastern Asia (%)
Place of birth for the foreign-born population - Afghanistan (%)
Place of birth for the foreign-born population - Bangladesh (%)
Place of birth for the foreign-born population - India (%)
Place of birth for the foreign-born population - Iran (%)
Place of birth for the foreign-born population - Kazakhstan (%)
Place of birth for the foreign-born population - Nepal (%)
Place of birth for the foreign-born population - Pakistan (%)
Place of birth for the foreign-born population - Sri Lanka (%)
Place of birth for the foreign-born population - Uzbekistan (%)
Place of birth for the foreign-born population - Other South Central Asia (%)
Place of birth for the foreign-born population - Burma (%)
Place of birth for the foreign-born population - Cambodia (%)
Place of birth for the foreign-born population - Indonesia (%)
Place of birth for the foreign-born population - Laos (%)
Place of birth for the foreign-born population - Malaysia (%)
Place of birth for the foreign-born population - Philippines (%)
Place of birth for the foreign-born population - Singapore (%)
Place of birth for the foreign-born population - Thailand (%)
Place of birth for the foreign-born population - Vietnam (%)
Place of birth for the foreign-born population - Other South Eastern Asia (%)
Place of birth for the foreign-born population - Armenia (%)
Place of birth for the foreign-born population - Iraq (%)
Place of birth for the foreign-born population - Israel (%)
Place of birth for the foreign-born population - Jordan (%)
Place of birth for the foreign-born population - Kuwait (%)
Place of birth for the foreign-born population - Lebanon (%)
Place of birth for the foreign-born population - Saudi Arabia (%)
Place of birth for the foreign-born population - Syria (%)
Place of birth for the foreign-born population - Turkey (%)
Place of birth for the foreign-born population - Yemen (%)
Place of birth for the foreign-born population - Other Western Asia (%)
Place of birth for the foreign-born population - Eritrea (%)
Place of birth for the foreign-born population - Ethiopia (%)
Place of birth for the foreign-born population - Kenya (%)
Place of birth for the foreign-born population - Somalia (%)
Place of birth for the foreign-born population - Uganda (%)
Place of birth for the foreign-born population - Zimbabwe (%)
Place of birth for the foreign-born population - Other Eastern Africa (%)
Place of birth for the foreign-born population - Cameroon (%)
Place of birth for the foreign-born population - Congo (%)
Place of birth for the foreign-born population - Democratic Republic of Congo (Zaire) (%)
Place of birth for the foreign-born population - Other Middle Africa (%)
Place of birth for the foreign-born population - Egypt (%)
Place of birth for the foreign-born population - Morocco (%)
Place of birth for the foreign-born population - Sudan (%)
Place of birth for the foreign-born population - Other Northern Africa (%)
Place of birth for the foreign-born population - South Africa (%)
Place of birth for the foreign-born population - Other Southern Africa (%)
Place of birth for the foreign-born population - Cabo Verde (%)
Place of birth for the foreign-born population - Ghana (%)
Place of birth for the foreign-born population - Liberia (%)
Place of birth for the foreign-born population - Nigeria (%)
Place of birth for the foreign-born population - Senegal (%)
Place of birth for the foreign-born population - Sierra Leone (%)
Place of birth for the foreign-born population - Other Western Africa (%)
Place of birth for the foreign-born population - Australia (%)
Place of birth for the foreign-born population - New Zealand (%)
Place of birth for the foreign-born population - Fiji (%)
Place of birth for the foreign-born population - Micronesia (%)
Place of birth for the foreign-born population - Bahamas (%)
Place of birth for the foreign-born population - Barbados (%)
Place of birth for the foreign-born population - Cuba (%)
Place of birth for the foreign-born population - Dominica (%)
Place of birth for the foreign-born population - Dominican Republic (%)
Place of birth for the foreign-born population - Grenada (%)
Place of birth for the foreign-born population - Haiti (%)
Place of birth for the foreign-born population - Jamaica (%)
Place of birth for the foreign-born population - St. Vincent and the Grenadines (%)
Place of birth for the foreign-born population - Trinidad and Tobago (%)
Place of birth for the foreign-born population - West Indies (%)
Place of birth for the foreign-born population - Other Caribbean (%)
Place of birth for the foreign-born population - Belize (%)
Place of birth for the foreign-born population - Costa Rica (%)
Place of birth for the foreign-born population - El Salvador (%)
Place of birth for the foreign-born population - Guatemala (%)
Place of birth for the foreign-born population - Honduras (%)
Place of birth for the foreign-born population - Mexico (%)
Place of birth for the foreign-born population - Nicaragua (%)
Place of birth for the foreign-born population - Panama (%)
Place of birth for the foreign-born population - Other Central America (%)
Place of birth for the foreign-born population - Argentina (%)
Place of birth for the foreign-born population - Bolivia (%)
Place of birth for the foreign-born population - Brazil (%)
Place of birth for the foreign-born population - Chile (%)
Place of birth for the foreign-born population - Colombia (%)
Place of birth for the foreign-born population - Ecuador (%)
Place of birth for the foreign-born population - Guyana (%)
Place of birth for the foreign-born population - Peru (%)
Place of birth for the foreign-born population - Uruguay (%)
Place of birth for the foreign-born population - Venezuela (%)
Place of birth for the foreign-born population - Other South America (%)
Place of birth for the foreign-born population - Canada (%)
Place of birth for the foreign-born population - Other Northern America (%)
Place of birth for the foreign-born population - Other (%)
Latest news about races in Stanford, CA collected exclusively by city-data.com from local newspapers, TV, and radio stations
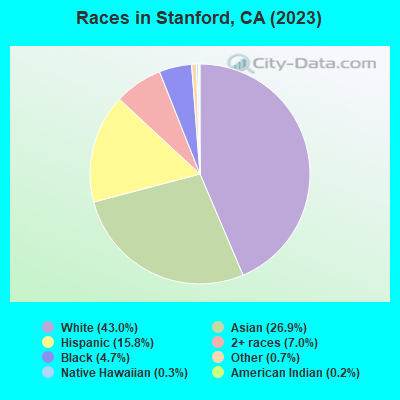
According to 2022 data, the most numerous races in Stanford, CA are Hispanic (2,617 residents), White alone (6,856 residents), and Asian alone (4,918 residents). 57.8% of Stanford residents speak English at home. 27.6% of Stanford, CA residents are foreign-born (17.5% born in Asia, 4.3% born in Latin America, 4.2% born in Europe), which is 5.8% greater than the foreign-born rate of 26.0% across the entire state of California.
Race distribution in Stanford
2000 2022
15,816,790 46.7% White alone 10,966,556 32.4% Hispanic 3,648,860 10.8% Asian alone 2,181,926 6.4% Black alone 903,115 2.7% Two or more races 178,984 0.5% American Indian alone 103,736 0.3% Native Hawaiian and Other 71,681 0.2% Other race alone
15,732,184 40.3% Hispanic 13,160,426 33.7% White alone 5,957,867 15.3% Asian alone 2,025,218 5.2% Black alone 1,663,222 4.3% Two or more races 251,618 0.6% Other race alone 135,777 0.3% Native Hawaiian and Other 103,030 0.3% American Indian alone
Income and house value in Stanford Median household income in 2022 $100,750 White non-Hispanic householders$60,395 Black householders$63,348 American Indian and Alaska Native householders$50,734 Asian householders$27,188 Some other race householders$52,784 Two or more races householders$69,366 Hispanic or Latino race householdersMedian 2022 house value over $1,000,000 White Non-Hispanic householders over $1,000,000 Asian householdersover $1,000,000 Two or more races householdersover $1,000,000 Hispanic or Latino householders
Median age by race in Stanford
23.3 Median age for White residents23.8 23.0 20.9 Median age for Black or African American residents21.1 21.3 22.6 Median age for American Indian / Alaska Native residents17.7 22.3 24.4 Median age for Asian residents24.7 23.9 25.1 Median age for Native Hawaiian / Pacific Islander residents22.9 Median age for Other race residents24.3 22.8 30.2 Median age for Two or more races residents31.1 29.4 23.2 Median age for White alone residents23.6 23.1 21.7 Median age for Hispanic or Latino residents22.0 21.3
Owner/renter occupied households by race in Stanford
House owners and renters - White residents 630 37.0% Owner occupied1,072 63.0% Renter occupiedHouse owners and renters - Black or African American residents 62 100.0% Renter occupiedHouse owners and renters - Asian residents 155 11.9% Owner occupied1,148 88.1% Renter occupiedHouse owners and renters - Native Hawaiian / Pacific Islander residents 18 100.0% Renter occupiedHouse owners and renters - Other race residents 146 100.0% Renter occupiedHouse owners and renters - Two or more races residents 188 31.1% Owner occupied416 68.9% Renter occupiedHouse owners and renters - White alone residents 613 37.2% Owner occupied1,036 62.8% Renter occupiedHouse owners and renters - Hispanic or Latino residents 78 16.9% Owner occupied386 83.1% Renter occupied
Language usage in Stanford
English speakers - Total 57.8% of residents of Stanford speak English at home.
10.8% of residents speak Spanish at home 1,600 92.3% Speak English very well133 7.7% Speak English less than very well32.4% of residents speak other language at home 4,344 83.6% Speak English very well852 16.4% Speak English less than very well
English speakers - Born in the United States 75.5% of residents of Stanford speak English at home.
6.6% of residents speak Spanish at home 384 95.8% Speak English very well17 4.2% Speak English less than very well19.2% of residents speak other language at home 1,107 95.2% Speak English very well56 4.8% Speak English less than very well
English speakers - Native, born elsewhere 64.8% of residents of Stanford speak English at home.
20.4% of residents speak Spanish at home 119 100.0% Speak English very well14.8% of residents speak other language at home 84 97.7% Speak English very well2 2.3% Speak English less than very well
English speakers - Foreign-born 16.2% of residents of Stanford speak English at home.
12.6% of residents speak Spanish at home 468 84.6% Speak English very well85 15.4% Speak English less than very well74.6% of residents speak other language at home 2,540 77.7% Speak English very well731 22.3% Speak English less than very well
White (Caucasian) - Speak only English Native:
86.1% (5,333)Foreign-born:
17.6% (204)
White (Caucasian) - Speak another language Native:
14.3% (885)Foreign-born:
82.9% (960)
Black or African American - Speak only English Native:
92.7% (483)Foreign-born:
37.4% (39)
Black or African American - Speak another language Native:
7.2% (37)Foreign-born:
62.2% (64)
Asian - Speak only English Native:
42.4% (981)Foreign-born:
15.8% (415)
Asian - Speak another language Native:
56.2% (1,299)Foreign-born:
85.0% (2,231)
Other race - Speak only English Native:
40.1% (144)Foreign-born:
4.4% (4)
Other race - Speak another language Native:
61.2% (220)Foreign-born:
95.2% (95)
Two or more races - Speak only English Native:
56.6% (1,702)Foreign-born:
14.3% (123)
Two or more races - Speak another language Native:
56.7% (1,704)Foreign-born:
82.1% (706)
White alone - Speak only English Native:
91.6% (5,039)Foreign-born:
18.5% (228)
White alone - Speak another language Native:
8.6% (476)Foreign-born:
83.0% (1,025)
Hispanic or Latino - Speak only English Native:
46.8% (972)Foreign-born:
2.3% (11)
Hispanic or Latino - Speak another language Native:
53.6% (1,113)Foreign-born:
97.2% (486)
Foreign-born residents in Stanford 4,517 residents are foreign born (17.5% Asia , 4.3% Latin America , 4.2% Europe ).
This city:
27.6%California:
100.0%
Marital status for residents in Stanford Marital status - White (Caucasian) population 15 years and over
Males 78.8% Never married18.0% Now married0.0% Separated0.7% Widowed2.5% DivorcedFemales 77.0% Never married18.9% Now married0.0% Separated4.0% Widowed0.1% DivorcedWomen who gave birth in the past 12 months Now married:
51.3% (16)Unmarried:
48.7% (15)
Women who did not give birth in the past 12 months Now married:
11.5% (320)Unmarried:
88.5% (2,470)
Marital status - Black or African American population 15 years and over
Males 100.0% Never married0.0% Now married0.0% Separated0.0% Widowed0.0% DivorcedFemales 100.0% Never married0.0% Now married0.0% Separated0.0% Widowed0.0% DivorcedWomen who did not give birth in the past 12 months Now married:
0.0% (0)Unmarried:
100.0% (337)
Marital status - American Indian / Alaska Native population 15 years and over
Males 100.0% Never married0.0% Now married0.0% Separated0.0% Widowed0.0% DivorcedFemales 100.0% Never married0.0% Now married0.0% Separated0.0% Widowed0.0% DivorcedWomen who did not give birth in the past 12 months Now married:
0.0% (0)Unmarried:
100.0% (30)
Marital status - Asian population 15 years and over
Males 89.4% Never married10.6% Now married0.0% Separated0.0% Widowed0.0% DivorcedFemales 85.2% Never married14.8% Now married0.0% Separated0.0% Widowed0.0% DivorcedWomen who gave birth in the past 12 months Now married:
0.0% (0)Unmarried:
100.0% (4)
Women who did not give birth in the past 12 months Now married:
10.1% (178)Unmarried:
89.9% (1,591)
Marital status - Native Hawaiian / Pacific Islander population 15 years and over
Males 33.3% Never married66.7% Now married0.0% Separated0.0% Widowed0.0% DivorcedFemales 100.0% Never married0.0% Now married0.0% Separated0.0% Widowed0.0% DivorcedWomen who did not give birth in the past 12 months Now married:
0.0% (0)Unmarried:
100.0% (10)
Marital status - Other race population 15 years and over
Males 98.8% Never married0.0% Now married1.2% Separated0.0% Widowed0.0% DivorcedFemales 91.6% Never married8.4% Now married0.0% Separated0.0% Widowed0.0% DivorcedWomen who did not give birth in the past 12 months Now married:
8.4% (17)Unmarried:
91.6% (186)
Marital status - Two or more races population 15 years and over
Males 83.6% Never married16.4% Now married0.0% Separated0.0% Widowed0.0% DivorcedFemales 86.9% Never married13.1% Now married0.0% Separated0.0% Widowed0.0% DivorcedWomen who did not give birth in the past 12 months Now married:
10.5% (240)Unmarried:
89.5% (2,050)
Marital status - White alone, not Hispanic / Latino population 15 years and over
Males 78.7% Never married17.5% Now married0.0% Separated0.8% Widowed3.1% DivorcedFemales 76.0% Never married19.6% Now married0.0% Separated4.4% Widowed0.0% DivorcedWomen who gave birth in the past 12 months Now married:
100.0% (18)Unmarried:
0.0% (0)
Women who did not give birth in the past 12 months Now married:
10.8% (270)Unmarried:
89.2% (2,240)
Marital status - Hispanic or Latino population 15 years and over
Males 84.4% Never married15.4% Now married0.2% Separated0.0% Widowed0.0% DivorcedFemales 85.9% Never married12.3% Now married0.0% Separated1.4% Widowed0.3% DivorcedWomen who gave birth in the past 12 months Now married:
0.0% (0)Unmarried:
100.0% (19)
Women who did not give birth in the past 12 months Now married:
10.8% (118)Unmarried:
89.2% (975)
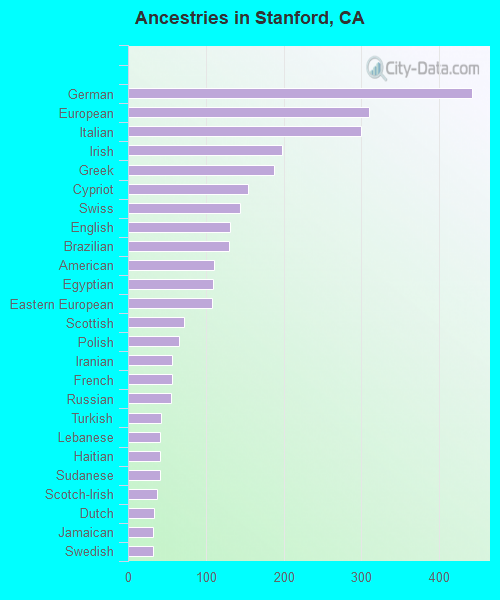
Ancestries in Stanford
731 8.5% European260 3.0% German207 2.4% Irish166 1.9% Italian121 1.4% Swiss105 1.2% American103 1.2% Russian101 1.2% Portuguese100 1.2% English96 1.1% Eastern European78 0.9% Polish71 0.8% British68 0.8% Lebanese67 0.8% Greek54 0.6% Armenian54 0.6% Sudanese48 0.6% Norwegian45 0.5% Scottish42 0.5% Serbian41 0.5% Palestinian40 0.5% French39 0.5% Northern European37 0.4% Brazilian26 0.3% Israeli25 0.3% Nigerian25 0.3% Jamaican24 0.3% Iranian23 0.3% Scotch-Irish23 0.3% Danish22 0.3% Turkish20 0.2% Haitian19 0.2% Albanian19 0.2% Moroccan17 0.2% Romanian16 0.2% Kenyan15 0.2% South African15 0.2% Swedish14 0.2% Ethiopian13 0.2% Austrian13 0.2% Ukrainian9 0.1% Dutch8 0.09% Czech8 0.09% African8 0.09% Finnish7 0.08% Australian7 0.08% Czechoslovakian5 0.06% Egyptian5 0.06% Bahamian4 0.05% Yugoslavian3 0.03% Croatian2 0.02% French Canadian
Geographical mobility in Stanford Same house 1 year ago 4,520 60.0% White (Caucasian)259 42.2% Black or African American30 42.4% American Indian / Alaska Native2,837 56.9% Asian26 83.8% Native Hawaiian / Pacific Islander243 55.9% Other race1,990 53.1% Two or more races4,306 60.8% White alone, not Hispanic / Latino1,467 54.9% Hispanic or LatinoMoved within same county 715 9.5% White / Caucasian73 11.8% Black or African American10 14.0% American Indian / Alaska Native591 11.9% Asian26 6.1% Other race621 16.6% Two or more races655 9.3% White alone, not Hispanic / Latino243 9.1% Hispanic or LatinoMoved within same state 716 9.5% White / Caucasian51 8.4% Black or African American453 9.1% Asian38 8.8% Other race253 6.8% Two or more races679 9.6% White alone, not Hispanic / Latino310 11.6% Hispanic or LatinoMoved from different state 1,034 13.7% White / Caucasian193 31.5% Black or African American12 17.0% American Indian / Alaska Native524 10.5% Asian57 13.0% Other race270 7.2% Two or more races936 13.2% White alone, not Hispanic / Latino458 17.1% Hispanic or LatinoMoved from abroad 274 3.6% White3 0.5% Black or African American330 6.6% Asian6 17.8% Native Hawaiian / Pacific Islander48 11.0% Other race95 2.5% Two or more races325 4.6% White alone, not Hispanic / Latino145 5.4% Hispanic or Latino
Children Nativity (place of birth) in Stanford
Children under 6 years - Living with two parents Both parents native 102 100.0% NativeBoth parents foreign-born 186 91.7% Native17 8.3% Foreign-bornOne native, one foreign-born parent 48 100.0% NativeChildren under 6 years - Living with one parent Native parent 12 99.3% Native0 0.7% Foreign-bornForeign-born parent 8 100.0% Foreign-bornChildren 6 to 17 years - Living with two parents Both parents native 190 100.0% NativeBoth parents foreign-born 168 87.2% Native25 12.8% Foreign-bornOne native, one foreign-born parent 57 100.0% NativeChildren 6 to 17 years - Living with one parent Native parent 32 100.0% Foreign-bornForeign-born parent 30 100.0% Native