Races in Strongsville, Ohio (OH) Detailed Stats
Data:
Races - White alone (%)
Races - White alone (% change since 2000)
Races - Black alone (%)
Races - Black alone (% change since 2000)
Races - American Indian alone (%)
Races - American Indian alone (% change since 2000)
Races - Asian alone (%)
Races - Asian alone (% change since 2000)
Races - Hispanic (%)
Races - Hispanic (% change since 2000)
Races - Native Hawaiian and Other Pacific Islander alone (%)
Races - Native Hawaiian and Other Pacific Islander alone (% change since 2000)
Races - Two or more races(%)
Races - Two or more races(% change since 2000)
Races - Other race alone (%)
Races - Other race alone (% change since 2000)
Racial diversity
Place of birth - Born in state of residence (%)
Place of birth - Born in state of residence (%) - White
Place of birth - Born in state of residence (%) - Black or African American
Place of birth - Born in state of residence (%) - Asian
Place of birth - Born in state of residence (%) - Hispanic or Latino
Place of birth - Born in state of residence (%) - American Indian and Alaska Native
Place of birth - Born in state of residence (%) - Multirace
Place of birth - Born in state of residence (%) - Other Race
Place of birth - Born in other state (%)
Place of birth - Born in other state (%) - White
Place of birth - Born in other state (%) - Black or African American
Place of birth - Born in other state (%) - Asian
Place of birth - Born in other state (%) - Hispanic or Latino
Place of birth - Born in other state (%) - American Indian and Alaska Native
Place of birth - Born in other state (%) - Multirace
Place of birth - Born in other state (%) - Other Race
Place of birth - Native, outside of US (%)
Place of birth - Native, outside of US (%) - White
Place of birth - Native, outside of US (%) - Black or African American
Place of birth - Native, outside of US (%) - Asian
Place of birth - Native, outside of US (%) - Hispanic or Latino
Place of birth - Native, outside of US (%) - American Indian and Alaska Native
Place of birth - Native, outside of US (%) - Multirace
Place of birth - Native, outside of US (%) - Other Race
Place of birth - Foreign born (%)
Place of birth - Foreign born (%) - White
Place of birth - Foreign born (%) - Black or African American
Place of birth - Foreign born (%) - Asian
Place of birth - Foreign born (%) - Hispanic or Latino
Place of birth - Foreign born (%) - American Indian and Alaska Native
Place of birth - Foreign born (%) - Multirace
Place of birth - Foreign born (%) - Other Race
Residents speaking English at home (%)
Residents speaking English at home - Born in the United States (%)
Residents speaking English at home - Native, born elsewhere (%)
Residents speaking English at home - Foreign born (%)
Residents speaking Spanish at home (%)
Residents speaking Spanish at home - Born in the United States (%)
Residents speaking Spanish at home - Native, born elsewhere (%)
Residents speaking Spanish at home - Foreign born (%)
Residents speaking other language at home (%)
Residents speaking other language at home - Born in the United States (%)
Residents speaking other language at home - Native, born elsewhere (%)
Residents speaking other language at home - Foreign born (%)
Marital status - Never married (%)
Marital status - Now married (%)
Marital status - Separated (%)
Marital status - Widowed (%)
Marital status - Divorced (%)
Ancestries Reported - Arab (%)
Ancestries Reported - Czech (%)
Ancestries Reported - Danish (%)
Ancestries Reported - Dutch (%)
Ancestries Reported - English (%)
Ancestries Reported - French (%)
Ancestries Reported - French Canadian (%)
Ancestries Reported - German (%)
Ancestries Reported - Greek (%)
Ancestries Reported - Hungarian (%)
Ancestries Reported - Irish (%)
Ancestries Reported - Italian (%)
Ancestries Reported - Lithuanian (%)
Ancestries Reported - Norwegian (%)
Ancestries Reported - Polish (%)
Ancestries Reported - Portuguese (%)
Ancestries Reported - Russian (%)
Ancestries Reported - Scotch-Irish (%)
Ancestries Reported - Scottish (%)
Ancestries Reported - Slovak (%)
Ancestries Reported - Subsaharan African (%)
Ancestries Reported - Swedish (%)
Ancestries Reported - Swiss (%)
Ancestries Reported - Ukrainian (%)
Ancestries Reported - United States (%)
Ancestries Reported - Welsh (%)
Ancestries Reported - West Indian (%)
Ancestries Reported - Other (%)
Geographical mobility - Same house 1 year ago (%)
Geographical mobility - Same house 1 year ago (%) - White
Geographical mobility - Same house 1 year ago (%) - Black or African American
Geographical mobility - Same house 1 year ago (%) - Asian
Geographical mobility - Same house 1 year ago (%) - Hispanic or Latino
Geographical mobility - Same house 1 year ago (%) - American Indian and Alaska Native
Geographical mobility - Same house 1 year ago (%) - Multirace
Geographical mobility - Same house 1 year ago (%) - Other Race
Geographical mobility - Moved within same county (%)
Geographical mobility - Moved within same county (%) - White
Geographical mobility - Moved within same county (%) - Black or African American
Geographical mobility - Moved within same county (%) - Asian
Geographical mobility - Moved within same county (%) - Hispanic or Latino
Geographical mobility - Moved within same county (%) - American Indian and Alaska Native
Geographical mobility - Moved within same county (%) - Multirace
Geographical mobility - Moved within same county (%) - Other Race
Geographical mobility - Moved from different county within same state (%)
Geographical mobility - Moved from different county within same state (%) - White
Geographical mobility - Moved from different county within same state (%) - Black or African American
Geographical mobility - Moved from different county within same state (%) - Asian
Geographical mobility - Moved from different county within same state (%) - Hispanic or Latino
Geographical mobility - Moved from different county within same state (%) - American Indian and Alaska Native
Geographical mobility - Moved from different county within same state (%) - Multirace
Geographical mobility - Moved from different county within same state (%) - Other Race
Geographical mobility - Moved from different state (%)
Geographical mobility - Moved from different state (%) - White
Geographical mobility - Moved from different state (%) - Black or African American
Geographical mobility - Moved from different state (%) - Asian
Geographical mobility - Moved from different state (%) - Hispanic or Latino
Geographical mobility - Moved from different state (%) - American Indian and Alaska Native
Geographical mobility - Moved from different state (%) - Multirace
Geographical mobility - Moved from different state (%) - Other Race
Geographical mobility - Moved from abroad (%)
Geographical mobility - Moved from abroad (%) - White
Geographical mobility - Moved from abroad (%) - Black or African American
Geographical mobility - Moved from abroad (%) - Asian
Geographical mobility - Moved from abroad (%) - Hispanic or Latino
Geographical mobility - Moved from abroad (%) - American Indian and Alaska Native
Geographical mobility - Moved from abroad (%) - Multirace
Geographical mobility - Moved from abroad (%) - Other Race
Place of birth for the foreign-born population - Ireland (%)
Place of birth for the foreign-born population - Denmark (%)
Place of birth for the foreign-born population - Norway (%)
Place of birth for the foreign-born population - Sweden (%)
Place of birth for the foreign-born population - United Kingdom (%)
Place of birth for the foreign-born population - England (%)
Place of birth for the foreign-born population - Scotland (%)
Place of birth for the foreign-born population - Other Northern Europe (%)
Place of birth for the foreign-born population - Austria (%)
Place of birth for the foreign-born population - Belgium (%)
Place of birth for the foreign-born population - France (%)
Place of birth for the foreign-born population - Germany (%)
Place of birth for the foreign-born population - Netherlands (%)
Place of birth for the foreign-born population - Switzerland (%)
Place of birth for the foreign-born population - Other Western Europe (%)
Place of birth for the foreign-born population - Greece (%)
Place of birth for the foreign-born population - Italy (%)
Place of birth for the foreign-born population - Portugal (%)
Place of birth for the foreign-born population - Spain (%)
Place of birth for the foreign-born population - Other Southern Europe (%)
Place of birth for the foreign-born population - Albania (%)
Place of birth for the foreign-born population - Belarus (%)
Place of birth for the foreign-born population - Bosnia and Herzegovina (%)
Place of birth for the foreign-born population - Bulgaria (%)
Place of birth for the foreign-born population - Croatia (%)
Place of birth for the foreign-born population - Czechoslovakia (%)
Place of birth for the foreign-born population - Hungary (%)
Place of birth for the foreign-born population - Latvia (%)
Place of birth for the foreign-born population - Lithuania (%)
Place of birth for the foreign-born population - North Macedonia (Macedonia) (%)
Place of birth for the foreign-born population - Moldova (%)
Place of birth for the foreign-born population - Poland (%)
Place of birth for the foreign-born population - Romania (%)
Place of birth for the foreign-born population - Russia (%)
Place of birth for the foreign-born population - Serbia (%)
Place of birth for the foreign-born population - Ukraine (%)
Place of birth for the foreign-born population - Other Eastern Europe (%)
Place of birth for the foreign-born population - China (%)
Place of birth for the foreign-born population - Hong Kong (%)
Place of birth for the foreign-born population - Taiwan (%)
Place of birth for the foreign-born population - Japan (%)
Place of birth for the foreign-born population - Korea (%)
Place of birth for the foreign-born population - Other Eastern Asia (%)
Place of birth for the foreign-born population - Afghanistan (%)
Place of birth for the foreign-born population - Bangladesh (%)
Place of birth for the foreign-born population - India (%)
Place of birth for the foreign-born population - Iran (%)
Place of birth for the foreign-born population - Kazakhstan (%)
Place of birth for the foreign-born population - Nepal (%)
Place of birth for the foreign-born population - Pakistan (%)
Place of birth for the foreign-born population - Sri Lanka (%)
Place of birth for the foreign-born population - Uzbekistan (%)
Place of birth for the foreign-born population - Other South Central Asia (%)
Place of birth for the foreign-born population - Burma (%)
Place of birth for the foreign-born population - Cambodia (%)
Place of birth for the foreign-born population - Indonesia (%)
Place of birth for the foreign-born population - Laos (%)
Place of birth for the foreign-born population - Malaysia (%)
Place of birth for the foreign-born population - Philippines (%)
Place of birth for the foreign-born population - Singapore (%)
Place of birth for the foreign-born population - Thailand (%)
Place of birth for the foreign-born population - Vietnam (%)
Place of birth for the foreign-born population - Other South Eastern Asia (%)
Place of birth for the foreign-born population - Armenia (%)
Place of birth for the foreign-born population - Iraq (%)
Place of birth for the foreign-born population - Israel (%)
Place of birth for the foreign-born population - Jordan (%)
Place of birth for the foreign-born population - Kuwait (%)
Place of birth for the foreign-born population - Lebanon (%)
Place of birth for the foreign-born population - Saudi Arabia (%)
Place of birth for the foreign-born population - Syria (%)
Place of birth for the foreign-born population - Turkey (%)
Place of birth for the foreign-born population - Yemen (%)
Place of birth for the foreign-born population - Other Western Asia (%)
Place of birth for the foreign-born population - Eritrea (%)
Place of birth for the foreign-born population - Ethiopia (%)
Place of birth for the foreign-born population - Kenya (%)
Place of birth for the foreign-born population - Somalia (%)
Place of birth for the foreign-born population - Uganda (%)
Place of birth for the foreign-born population - Zimbabwe (%)
Place of birth for the foreign-born population - Other Eastern Africa (%)
Place of birth for the foreign-born population - Cameroon (%)
Place of birth for the foreign-born population - Congo (%)
Place of birth for the foreign-born population - Democratic Republic of Congo (Zaire) (%)
Place of birth for the foreign-born population - Other Middle Africa (%)
Place of birth for the foreign-born population - Egypt (%)
Place of birth for the foreign-born population - Morocco (%)
Place of birth for the foreign-born population - Sudan (%)
Place of birth for the foreign-born population - Other Northern Africa (%)
Place of birth for the foreign-born population - South Africa (%)
Place of birth for the foreign-born population - Other Southern Africa (%)
Place of birth for the foreign-born population - Cabo Verde (%)
Place of birth for the foreign-born population - Ghana (%)
Place of birth for the foreign-born population - Liberia (%)
Place of birth for the foreign-born population - Nigeria (%)
Place of birth for the foreign-born population - Senegal (%)
Place of birth for the foreign-born population - Sierra Leone (%)
Place of birth for the foreign-born population - Other Western Africa (%)
Place of birth for the foreign-born population - Australia (%)
Place of birth for the foreign-born population - New Zealand (%)
Place of birth for the foreign-born population - Fiji (%)
Place of birth for the foreign-born population - Micronesia (%)
Place of birth for the foreign-born population - Bahamas (%)
Place of birth for the foreign-born population - Barbados (%)
Place of birth for the foreign-born population - Cuba (%)
Place of birth for the foreign-born population - Dominica (%)
Place of birth for the foreign-born population - Dominican Republic (%)
Place of birth for the foreign-born population - Grenada (%)
Place of birth for the foreign-born population - Haiti (%)
Place of birth for the foreign-born population - Jamaica (%)
Place of birth for the foreign-born population - St. Vincent and the Grenadines (%)
Place of birth for the foreign-born population - Trinidad and Tobago (%)
Place of birth for the foreign-born population - West Indies (%)
Place of birth for the foreign-born population - Other Caribbean (%)
Place of birth for the foreign-born population - Belize (%)
Place of birth for the foreign-born population - Costa Rica (%)
Place of birth for the foreign-born population - El Salvador (%)
Place of birth for the foreign-born population - Guatemala (%)
Place of birth for the foreign-born population - Honduras (%)
Place of birth for the foreign-born population - Mexico (%)
Place of birth for the foreign-born population - Nicaragua (%)
Place of birth for the foreign-born population - Panama (%)
Place of birth for the foreign-born population - Other Central America (%)
Place of birth for the foreign-born population - Argentina (%)
Place of birth for the foreign-born population - Bolivia (%)
Place of birth for the foreign-born population - Brazil (%)
Place of birth for the foreign-born population - Chile (%)
Place of birth for the foreign-born population - Colombia (%)
Place of birth for the foreign-born population - Ecuador (%)
Place of birth for the foreign-born population - Guyana (%)
Place of birth for the foreign-born population - Peru (%)
Place of birth for the foreign-born population - Uruguay (%)
Place of birth for the foreign-born population - Venezuela (%)
Place of birth for the foreign-born population - Other South America (%)
Place of birth for the foreign-born population - Canada (%)
Place of birth for the foreign-born population - Other Northern America (%)
Place of birth for the foreign-born population - Other (%)
Latest news about races in Strongsville, OH collected exclusively by city-data.com from local newspapers, TV, and radio stations
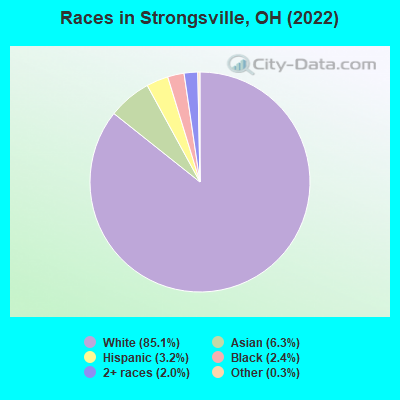
According to 2022 data, the most numerous races in Strongsville, OH are White alone (38,635 residents), Black alone (1,111 residents), and Two or more races (902 residents). 87.3% of Strongsville residents speak English at home. 11.1% of Strongsville, OH residents are foreign-born (5.2% born in Asia, 3.7% born in Europe), which is 63.8% greater than the foreign-born rate of 4.0% across the entire state of Ohio.
Race distribution in Strongsville
2000 2022
9,538,111 84.0% White alone 1,290,662 11.4% Black alone 217,123 1.9% Hispanic 137,770 1.2% Two or more races 131,670 1.2% Asian alone 21,985 0.2% American Indian alone 13,483 0.1% Other race alone 2,336 0.02% Native Hawaiian and Other
8,948,793 76.1% White alone 1,401,403 11.9% Black alone 529,291 4.5% Two or more races 517,232 4.4% Hispanic 293,387 2.5% Asian alone 52,805 0.4% Other race alone 9,785 0.08% American Indian alone 3,362 0.03% Native Hawaiian and Other
Income and house value in Strongsville Median household income in 2022 $99,895 White non-Hispanic householders$41,736 Black householders$146,890 Asian householders$99,517 Two or more races householders$104,833 Hispanic or Latino race householdersMedian 2022 house value $284,713 White Non-Hispanic householders$315,320 Black or African American householders$92,494 American Indian or Alaska Native householders $367,453 Asian householders$315,320 Some other race householders$297,494 Two or more races householders$250,238 Hispanic or Latino householders
Median age by race in Strongsville
49.3 Median age for White residents47.6 50.8 27.9 Median age for Black or African American residents24.9 29.6 24.3 Median age for American Indian / Alaska Native residents-734,374,999.3 22.0 37.0 Median age for Asian residents39.7 31.5 -706,093,189.3 Median age for Native Hawaiian / Pacific Islander residents-750,242,953.6 -805,394,989.6 49.1 Median age for Other race residents51.3 49.1 26.7 Median age for Two or more races residents22.5 31.2 49.4 Median age for White alone residents47.2 51.6 40.4 Median age for Hispanic or Latino residents34.6 40.4
Owner/renter occupied households by race in Strongsville
House owners and renters - White residents 14,452 85.7% Owner occupied2,418 14.3% Renter occupiedHouse owners and renters - Black or African American residents 126 37.5% Owner occupied210 62.5% Renter occupiedHouse owners and renters - American Indian / Alaska Native residents 11 35.4% Owner occupied20 64.6% Renter occupiedHouse owners and renters - Asian residents 543 70.4% Owner occupied228 29.6% Renter occupiedHouse owners and renters - Other race residents 40 65.5% Owner occupied21 34.5% Renter occupiedHouse owners and renters - Two or more races residents 442 58.4% Owner occupied315 41.6% Renter occupiedHouse owners and renters - White alone residents 14,329 85.4% Owner occupied2,457 14.6% Renter occupiedHouse owners and renters - Hispanic or Latino residents 320 60.1% Owner occupied213 39.9% Renter occupied
Language usage in Strongsville
English speakers - Total 87.3% of residents of Strongsville speak English at home.
1.7% of residents speak Spanish at home 410 56.8% Speak English very well312 43.2% Speak English less than very well11.3% of residents speak other language at home 3,445 71.2% Speak English very well1,396 28.8% Speak English less than very well
English speakers - Born in the United States 96.4% of residents of Strongsville speak English at home.
1.2% of residents speak Spanish at home 65 75.6% Speak English very well21 24.4% Speak English less than very well2.0% of residents speak other language at home 147 100.0% Speak English very well
English speakers - Native, born elsewhere 31.9% of residents of Strongsville speak English at home.
13.3% of residents speak Spanish at home 61 100.0% Speak English very well42.4% of residents speak other language at home 169 87.1% Speak English very well25 12.9% Speak English less than very well
English speakers - Foreign-born 18.1% of residents of Strongsville speak English at home.
7.4% of residents speak Spanish at home 126 35.2% Speak English very well232 64.8% Speak English less than very well74.7% of residents speak other language at home 2,334 64.8% Speak English very well1,270 35.2% Speak English less than very well
White (Caucasian) - Speak only English Native:
98.0% (33,719)Foreign-born:
28.0% (640)
White (Caucasian) - Speak another language Native:
2.3% (806)Foreign-born:
72.1% (1,647)
Black or African American - Speak only English Native:
100.0% (987)Foreign-born:
36.0% (39)
Asian - Speak only English Native:
53.5% (339)Foreign-born:
8.5% (162)
Asian - Speak another language Native:
45.8% (291)Foreign-born:
91.4% (1,739)
Other race - Speak only English Native:
45.8% (73)Foreign-born:
24.3% (34)
Other race - Speak another language Native:
50.1% (80)Foreign-born:
87.4% (123)
Two or more races - Speak another language Native:
19.0% (270)Foreign-born:
100.0% (186)
White alone - Speak only English Native:
97.1% (33,452)Foreign-born:
28.0% (638)
White alone - Speak another language Native:
2.9% (1,000)Foreign-born:
72.0% (1,642)
Hispanic or Latino - Speak only English Native:
77.9% (756)Foreign-born:
4.6% (18)
Hispanic or Latino - Speak another language Native:
23.3% (226)Foreign-born:
96.0% (369)
Foreign-born residents in Strongsville 5,021 residents are foreign born (5.2% Asia , 3.7% Europe ).
Marital status for residents in Strongsville Marital status - White (Caucasian) population 15 years and over
Males 25.7% Never married61.8% Now married0.3% Separated4.2% Widowed8.0% DivorcedFemales 19.6% Never married58.1% Now married0.3% Separated11.8% Widowed10.3% DivorcedWomen who gave birth in the past 12 months Now married:
93.9% (402)Unmarried:
6.1% (26)
Women who did not give birth in the past 12 months Now married:
51.3% (3,286)Unmarried:
48.7% (3,120)
Marital status - Black or African American population 15 years and over
Males 55.3% Never married41.0% Now married0.0% Separated3.1% Widowed0.7% DivorcedFemales 70.3% Never married25.9% Now married0.0% Separated1.2% Widowed2.6% DivorcedWomen who did not give birth in the past 12 months Now married:
31.7% (101)Unmarried:
68.3% (218)
Marital status - American Indian / Alaska Native population 15 years and over
Males 0.0% Never married44.4% Now married55.6% Separated0.0% Widowed0.0% DivorcedFemales 78.0% Never married22.0% Now married0.0% Separated0.0% Widowed0.0% DivorcedWomen who did not give birth in the past 12 months Now married:
22.0% (11)Unmarried:
78.0% (39)
Marital status - Asian population 15 years and over
Males 26.9% Never married73.1% Now married0.0% Separated0.1% Widowed0.0% DivorcedFemales 19.9% Never married72.7% Now married2.2% Separated5.2% Widowed0.0% DivorcedWomen who gave birth in the past 12 months Now married:
100.0% (66)Unmarried:
0.0% (0)
Women who did not give birth in the past 12 months Now married:
68.9% (457)Unmarried:
31.1% (206)
Marital status - Other race population 15 years and over
Males 35.9% Never married53.3% Now married0.0% Separated0.0% Widowed10.9% DivorcedFemales 62.2% Never married27.9% Now married0.0% Separated0.0% Widowed9.9% DivorcedWomen who did not give birth in the past 12 months Now married:
13.2% (13)Unmarried:
86.8% (84)
Marital status - Two or more races population 15 years and over
Males 61.7% Never married38.3% Now married0.0% Separated0.0% Widowed0.0% DivorcedFemales 40.7% Never married33.2% Now married6.2% Separated4.6% Widowed15.4% DivorcedWomen who gave birth in the past 12 months Now married:
0.0% (0)Unmarried:
100.0% (22)
Women who did not give birth in the past 12 months Now married:
23.8% (101)Unmarried:
76.2% (323)
Marital status - White alone, not Hispanic / Latino population 15 years and over
Males 25.7% Never married61.7% Now married0.2% Separated4.2% Widowed8.1% DivorcedFemales 19.8% Never married58.4% Now married0.2% Separated11.9% Widowed9.8% DivorcedWomen who gave birth in the past 12 months Now married:
93.7% (402)Unmarried:
6.3% (27)
Women who did not give birth in the past 12 months Now married:
51.6% (3,285)Unmarried:
48.4% (3,083)
Marital status - Hispanic or Latino population 15 years and over
Males 39.3% Never married53.6% Now married3.2% Separated0.0% Widowed3.9% DivorcedFemales 26.5% Never married28.8% Now married9.6% Separated0.0% Widowed35.1% DivorcedWomen who gave birth in the past 12 months Now married:
100.0% (11)Unmarried:
0.0% (0)
Women who did not give birth in the past 12 months Now married:
35.1% (146)Unmarried:
64.9% (270)
Ancestries in Strongsville
2,985 15.5% German2,089 10.9% Italian1,394 7.2% Polish1,241 6.4% Irish1,202 6.2% American796 4.1% English414 2.2% European414 2.2% Slovak360 1.9% Ukrainian318 1.7% Hungarian263 1.4% Czech242 1.3% Romanian211 1.1% Dutch199 1.0% Scottish190 1.0% Lebanese173 0.9% Russian166 0.9% Palestinian140 0.7% Iranian139 0.7% Greek138 0.7% Eastern European107 0.6% Slovene106 0.6% Scotch-Irish100 0.5% Pennsylvania German98 0.5% Serbian91 0.5% Swedish86 0.4% Welsh79 0.4% Albanian71 0.4% Egyptian58 0.3% Czechoslovakian56 0.3% Jamaican52 0.3% African50 0.3% Yugoslavian42 0.2% Austrian34 0.2% Canadian34 0.2% Bulgarian31 0.2% Ugandan30 0.2% Trinidadian and Tobagonian28 0.1% Syrian27 0.1% Swiss26 0.1% Norwegian26 0.1% Finnish25 0.1% Armenian25 0.1% French Canadian23 0.1% Lithuanian22 0.1% French20 0.1% Macedonian18 0.09% Croatian18 0.09% Slavic14 0.07% Scandinavian14 0.07% Northern European12 0.06% Portuguese10 0.05% Jordanian8 0.04% Brazilian6 0.03% Turkish5 0.03% British
Geographical mobility in Strongsville Same house 1 year ago 35,014 91.7% White (Caucasian)696 61.6% Black or African American28 44.7% American Indian / Alaska Native2,533 89.9% Asian5 100.0% Native Hawaiian / Pacific Islander356 89.2% Other race1,309 81.0% Two or more races34,976 91.5% White alone, not Hispanic / Latino1,178 81.9% Hispanic or LatinoMoved within same county 1,901 5.0% White / Caucasian343 30.3% Black or African American21 33.4% American Indian / Alaska Native38 1.3% Asian12 3.0% Other race237 14.7% Two or more races1,984 5.2% White alone, not Hispanic / Latino117 8.1% Hispanic or LatinoMoved within same state 802 2.1% White / Caucasian1 0.1% Black or African American22 0.8% Asian21 1.3% Two or more races736 1.9% White alone, not Hispanic / Latino79 5.5% Hispanic or LatinoMoved from different state 486 1.3% White / Caucasian83 7.3% Black or African American38 1.4% Asian11 0.7% Two or more races467 1.2% White alone, not Hispanic / Latino69 4.8% Hispanic or LatinoMoved from abroad 20 0.1% White166 5.9% Asian26 0.1% White alone, not Hispanic / Latino
Children Nativity (place of birth) in Strongsville
Children under 6 years - Living with two parents Both parents native 2,078 100.0% NativeBoth parents foreign-born 362 98.3% Native6 1.7% Foreign-bornOne native, one foreign-born parent 142 100.0% NativeChildren under 6 years - Living with one parent Native parent 230 100.0% NativeChildren 6 to 17 years - Living with two parents Both parents native 3,929 99.2% Native33 0.8% Foreign-bornBoth parents foreign-born 673 95.6% Native31 4.4% Foreign-bornOne native, one foreign-born parent 186 100.0% NativeChildren 6 to 17 years - Living with one parent Native parent 864 100.0% NativeForeign-born parent 317 57.7% Native232 42.3% Foreign-born
Grandparents responsible for own grandchildren in Strongsville
Grandparents (30 to 59 years) White / Caucasian 96 68.7% Responsible for grandchildren44 31.3% Not responsible for grandchildrenBlack or African American 58 100.0% Not responsible for grandchildrenTwo or more races 21 100.0% Not responsible for grandchildrenWhite alone, not Hispanic / Latino 101 70.0% Responsible for grandchildren44 30.0% Not responsible for grandchildrenGrandparents (60 years and over) White / Caucasian 158 34.9% Responsible for grandchildren296 65.1% Not responsible for grandchildrenBlack or African American 7 100.0% Not responsible for grandchildrenTwo or more races 43 100.0% Not responsible for grandchildrenWhite alone, not Hispanic / Latino 161 34.4% Responsible for grandchildren308 65.6% Not responsible for grandchildren