Races in Summit, Illinois (IL) Detailed Stats
Data:
Races - White alone (%)
Races - White alone (% change since 2000)
Races - Black alone (%)
Races - Black alone (% change since 2000)
Races - American Indian alone (%)
Races - American Indian alone (% change since 2000)
Races - Asian alone (%)
Races - Asian alone (% change since 2000)
Races - Hispanic (%)
Races - Hispanic (% change since 2000)
Races - Native Hawaiian and Other Pacific Islander alone (%)
Races - Native Hawaiian and Other Pacific Islander alone (% change since 2000)
Races - Two or more races(%)
Races - Two or more races(% change since 2000)
Races - Other race alone (%)
Races - Other race alone (% change since 2000)
Racial diversity
Place of birth - Born in state of residence (%)
Place of birth - Born in state of residence (%) - White
Place of birth - Born in state of residence (%) - Black or African American
Place of birth - Born in state of residence (%) - Asian
Place of birth - Born in state of residence (%) - Hispanic or Latino
Place of birth - Born in state of residence (%) - American Indian and Alaska Native
Place of birth - Born in state of residence (%) - Multirace
Place of birth - Born in state of residence (%) - Other Race
Place of birth - Born in other state (%)
Place of birth - Born in other state (%) - White
Place of birth - Born in other state (%) - Black or African American
Place of birth - Born in other state (%) - Asian
Place of birth - Born in other state (%) - Hispanic or Latino
Place of birth - Born in other state (%) - American Indian and Alaska Native
Place of birth - Born in other state (%) - Multirace
Place of birth - Born in other state (%) - Other Race
Place of birth - Native, outside of US (%)
Place of birth - Native, outside of US (%) - White
Place of birth - Native, outside of US (%) - Black or African American
Place of birth - Native, outside of US (%) - Asian
Place of birth - Native, outside of US (%) - Hispanic or Latino
Place of birth - Native, outside of US (%) - American Indian and Alaska Native
Place of birth - Native, outside of US (%) - Multirace
Place of birth - Native, outside of US (%) - Other Race
Place of birth - Foreign born (%)
Place of birth - Foreign born (%) - White
Place of birth - Foreign born (%) - Black or African American
Place of birth - Foreign born (%) - Asian
Place of birth - Foreign born (%) - Hispanic or Latino
Place of birth - Foreign born (%) - American Indian and Alaska Native
Place of birth - Foreign born (%) - Multirace
Place of birth - Foreign born (%) - Other Race
Residents speaking English at home (%)
Residents speaking English at home - Born in the United States (%)
Residents speaking English at home - Native, born elsewhere (%)
Residents speaking English at home - Foreign born (%)
Residents speaking Spanish at home (%)
Residents speaking Spanish at home - Born in the United States (%)
Residents speaking Spanish at home - Native, born elsewhere (%)
Residents speaking Spanish at home - Foreign born (%)
Residents speaking other language at home (%)
Residents speaking other language at home - Born in the United States (%)
Residents speaking other language at home - Native, born elsewhere (%)
Residents speaking other language at home - Foreign born (%)
Marital status - Never married (%)
Marital status - Now married (%)
Marital status - Separated (%)
Marital status - Widowed (%)
Marital status - Divorced (%)
Ancestries Reported - Arab (%)
Ancestries Reported - Czech (%)
Ancestries Reported - Danish (%)
Ancestries Reported - Dutch (%)
Ancestries Reported - English (%)
Ancestries Reported - French (%)
Ancestries Reported - French Canadian (%)
Ancestries Reported - German (%)
Ancestries Reported - Greek (%)
Ancestries Reported - Hungarian (%)
Ancestries Reported - Irish (%)
Ancestries Reported - Italian (%)
Ancestries Reported - Lithuanian (%)
Ancestries Reported - Norwegian (%)
Ancestries Reported - Polish (%)
Ancestries Reported - Portuguese (%)
Ancestries Reported - Russian (%)
Ancestries Reported - Scotch-Irish (%)
Ancestries Reported - Scottish (%)
Ancestries Reported - Slovak (%)
Ancestries Reported - Subsaharan African (%)
Ancestries Reported - Swedish (%)
Ancestries Reported - Swiss (%)
Ancestries Reported - Ukrainian (%)
Ancestries Reported - United States (%)
Ancestries Reported - Welsh (%)
Ancestries Reported - West Indian (%)
Ancestries Reported - Other (%)
Geographical mobility - Same house 1 year ago (%)
Geographical mobility - Same house 1 year ago (%) - White
Geographical mobility - Same house 1 year ago (%) - Black or African American
Geographical mobility - Same house 1 year ago (%) - Asian
Geographical mobility - Same house 1 year ago (%) - Hispanic or Latino
Geographical mobility - Same house 1 year ago (%) - American Indian and Alaska Native
Geographical mobility - Same house 1 year ago (%) - Multirace
Geographical mobility - Same house 1 year ago (%) - Other Race
Geographical mobility - Moved within same county (%)
Geographical mobility - Moved within same county (%) - White
Geographical mobility - Moved within same county (%) - Black or African American
Geographical mobility - Moved within same county (%) - Asian
Geographical mobility - Moved within same county (%) - Hispanic or Latino
Geographical mobility - Moved within same county (%) - American Indian and Alaska Native
Geographical mobility - Moved within same county (%) - Multirace
Geographical mobility - Moved within same county (%) - Other Race
Geographical mobility - Moved from different county within same state (%)
Geographical mobility - Moved from different county within same state (%) - White
Geographical mobility - Moved from different county within same state (%) - Black or African American
Geographical mobility - Moved from different county within same state (%) - Asian
Geographical mobility - Moved from different county within same state (%) - Hispanic or Latino
Geographical mobility - Moved from different county within same state (%) - American Indian and Alaska Native
Geographical mobility - Moved from different county within same state (%) - Multirace
Geographical mobility - Moved from different county within same state (%) - Other Race
Geographical mobility - Moved from different state (%)
Geographical mobility - Moved from different state (%) - White
Geographical mobility - Moved from different state (%) - Black or African American
Geographical mobility - Moved from different state (%) - Asian
Geographical mobility - Moved from different state (%) - Hispanic or Latino
Geographical mobility - Moved from different state (%) - American Indian and Alaska Native
Geographical mobility - Moved from different state (%) - Multirace
Geographical mobility - Moved from different state (%) - Other Race
Geographical mobility - Moved from abroad (%)
Geographical mobility - Moved from abroad (%) - White
Geographical mobility - Moved from abroad (%) - Black or African American
Geographical mobility - Moved from abroad (%) - Asian
Geographical mobility - Moved from abroad (%) - Hispanic or Latino
Geographical mobility - Moved from abroad (%) - American Indian and Alaska Native
Geographical mobility - Moved from abroad (%) - Multirace
Geographical mobility - Moved from abroad (%) - Other Race
Place of birth for the foreign-born population - Ireland (%)
Place of birth for the foreign-born population - Denmark (%)
Place of birth for the foreign-born population - Norway (%)
Place of birth for the foreign-born population - Sweden (%)
Place of birth for the foreign-born population - United Kingdom (%)
Place of birth for the foreign-born population - England (%)
Place of birth for the foreign-born population - Scotland (%)
Place of birth for the foreign-born population - Other Northern Europe (%)
Place of birth for the foreign-born population - Austria (%)
Place of birth for the foreign-born population - Belgium (%)
Place of birth for the foreign-born population - France (%)
Place of birth for the foreign-born population - Germany (%)
Place of birth for the foreign-born population - Netherlands (%)
Place of birth for the foreign-born population - Switzerland (%)
Place of birth for the foreign-born population - Other Western Europe (%)
Place of birth for the foreign-born population - Greece (%)
Place of birth for the foreign-born population - Italy (%)
Place of birth for the foreign-born population - Portugal (%)
Place of birth for the foreign-born population - Spain (%)
Place of birth for the foreign-born population - Other Southern Europe (%)
Place of birth for the foreign-born population - Albania (%)
Place of birth for the foreign-born population - Belarus (%)
Place of birth for the foreign-born population - Bosnia and Herzegovina (%)
Place of birth for the foreign-born population - Bulgaria (%)
Place of birth for the foreign-born population - Croatia (%)
Place of birth for the foreign-born population - Czechoslovakia (%)
Place of birth for the foreign-born population - Hungary (%)
Place of birth for the foreign-born population - Latvia (%)
Place of birth for the foreign-born population - Lithuania (%)
Place of birth for the foreign-born population - North Macedonia (Macedonia) (%)
Place of birth for the foreign-born population - Moldova (%)
Place of birth for the foreign-born population - Poland (%)
Place of birth for the foreign-born population - Romania (%)
Place of birth for the foreign-born population - Russia (%)
Place of birth for the foreign-born population - Serbia (%)
Place of birth for the foreign-born population - Ukraine (%)
Place of birth for the foreign-born population - Other Eastern Europe (%)
Place of birth for the foreign-born population - China (%)
Place of birth for the foreign-born population - Hong Kong (%)
Place of birth for the foreign-born population - Taiwan (%)
Place of birth for the foreign-born population - Japan (%)
Place of birth for the foreign-born population - Korea (%)
Place of birth for the foreign-born population - Other Eastern Asia (%)
Place of birth for the foreign-born population - Afghanistan (%)
Place of birth for the foreign-born population - Bangladesh (%)
Place of birth for the foreign-born population - India (%)
Place of birth for the foreign-born population - Iran (%)
Place of birth for the foreign-born population - Kazakhstan (%)
Place of birth for the foreign-born population - Nepal (%)
Place of birth for the foreign-born population - Pakistan (%)
Place of birth for the foreign-born population - Sri Lanka (%)
Place of birth for the foreign-born population - Uzbekistan (%)
Place of birth for the foreign-born population - Other South Central Asia (%)
Place of birth for the foreign-born population - Burma (%)
Place of birth for the foreign-born population - Cambodia (%)
Place of birth for the foreign-born population - Indonesia (%)
Place of birth for the foreign-born population - Laos (%)
Place of birth for the foreign-born population - Malaysia (%)
Place of birth for the foreign-born population - Philippines (%)
Place of birth for the foreign-born population - Singapore (%)
Place of birth for the foreign-born population - Thailand (%)
Place of birth for the foreign-born population - Vietnam (%)
Place of birth for the foreign-born population - Other South Eastern Asia (%)
Place of birth for the foreign-born population - Armenia (%)
Place of birth for the foreign-born population - Iraq (%)
Place of birth for the foreign-born population - Israel (%)
Place of birth for the foreign-born population - Jordan (%)
Place of birth for the foreign-born population - Kuwait (%)
Place of birth for the foreign-born population - Lebanon (%)
Place of birth for the foreign-born population - Saudi Arabia (%)
Place of birth for the foreign-born population - Syria (%)
Place of birth for the foreign-born population - Turkey (%)
Place of birth for the foreign-born population - Yemen (%)
Place of birth for the foreign-born population - Other Western Asia (%)
Place of birth for the foreign-born population - Eritrea (%)
Place of birth for the foreign-born population - Ethiopia (%)
Place of birth for the foreign-born population - Kenya (%)
Place of birth for the foreign-born population - Somalia (%)
Place of birth for the foreign-born population - Uganda (%)
Place of birth for the foreign-born population - Zimbabwe (%)
Place of birth for the foreign-born population - Other Eastern Africa (%)
Place of birth for the foreign-born population - Cameroon (%)
Place of birth for the foreign-born population - Congo (%)
Place of birth for the foreign-born population - Democratic Republic of Congo (Zaire) (%)
Place of birth for the foreign-born population - Other Middle Africa (%)
Place of birth for the foreign-born population - Egypt (%)
Place of birth for the foreign-born population - Morocco (%)
Place of birth for the foreign-born population - Sudan (%)
Place of birth for the foreign-born population - Other Northern Africa (%)
Place of birth for the foreign-born population - South Africa (%)
Place of birth for the foreign-born population - Other Southern Africa (%)
Place of birth for the foreign-born population - Cabo Verde (%)
Place of birth for the foreign-born population - Ghana (%)
Place of birth for the foreign-born population - Liberia (%)
Place of birth for the foreign-born population - Nigeria (%)
Place of birth for the foreign-born population - Senegal (%)
Place of birth for the foreign-born population - Sierra Leone (%)
Place of birth for the foreign-born population - Other Western Africa (%)
Place of birth for the foreign-born population - Australia (%)
Place of birth for the foreign-born population - New Zealand (%)
Place of birth for the foreign-born population - Fiji (%)
Place of birth for the foreign-born population - Micronesia (%)
Place of birth for the foreign-born population - Bahamas (%)
Place of birth for the foreign-born population - Barbados (%)
Place of birth for the foreign-born population - Cuba (%)
Place of birth for the foreign-born population - Dominica (%)
Place of birth for the foreign-born population - Dominican Republic (%)
Place of birth for the foreign-born population - Grenada (%)
Place of birth for the foreign-born population - Haiti (%)
Place of birth for the foreign-born population - Jamaica (%)
Place of birth for the foreign-born population - St. Vincent and the Grenadines (%)
Place of birth for the foreign-born population - Trinidad and Tobago (%)
Place of birth for the foreign-born population - West Indies (%)
Place of birth for the foreign-born population - Other Caribbean (%)
Place of birth for the foreign-born population - Belize (%)
Place of birth for the foreign-born population - Costa Rica (%)
Place of birth for the foreign-born population - El Salvador (%)
Place of birth for the foreign-born population - Guatemala (%)
Place of birth for the foreign-born population - Honduras (%)
Place of birth for the foreign-born population - Mexico (%)
Place of birth for the foreign-born population - Nicaragua (%)
Place of birth for the foreign-born population - Panama (%)
Place of birth for the foreign-born population - Other Central America (%)
Place of birth for the foreign-born population - Argentina (%)
Place of birth for the foreign-born population - Bolivia (%)
Place of birth for the foreign-born population - Brazil (%)
Place of birth for the foreign-born population - Chile (%)
Place of birth for the foreign-born population - Colombia (%)
Place of birth for the foreign-born population - Ecuador (%)
Place of birth for the foreign-born population - Guyana (%)
Place of birth for the foreign-born population - Peru (%)
Place of birth for the foreign-born population - Uruguay (%)
Place of birth for the foreign-born population - Venezuela (%)
Place of birth for the foreign-born population - Other South America (%)
Place of birth for the foreign-born population - Canada (%)
Place of birth for the foreign-born population - Other Northern America (%)
Place of birth for the foreign-born population - Other (%)
Latest news about races in Summit, IL collected exclusively by city-data.com from local newspapers, TV, and radio stations
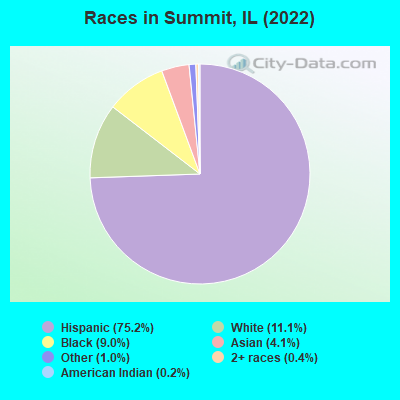
According to 2022 data, the most numerous races in Summit, IL are White alone (1,195 residents), Hispanic (8,115 residents), and Black alone (972 residents). 28.8% of Summit residents speak English at home. 41.1% of Summit, IL residents are foreign-born (33.9% born in Latin America), which is 65.9% greater than the foreign-born rate of 14.0% across the entire state of Illinois.
Race distribution in Summit
2000 2022
8,424,140 67.8% White alone 1,856,152 14.9% Black alone 1,530,262 12.3% Hispanic 419,916 3.4% Asian alone 153,996 1.2% Two or more races 13,479 0.1% Other race alone 18,232 0.1% American Indian alone 3,116 0.03% Native Hawaiian and Other
7,356,301 58.5% White alone 2,299,726 18.3% Hispanic 1,660,423 13.2% Black alone 747,296 5.9% Asian alone 458,599 3.6% Two or more races 45,386 0.4% Other race alone 10,405 0.08% American Indian alone 3,896 0.03% Native Hawaiian and Other
Income and house value in Summit Median household income in 2022 $45,335 White non-Hispanic householders$39,080 Black householders$25,485 Asian householders$73,412 Some other race householders$48,202 Two or more races householders$62,347 Hispanic or Latino race householdersMedian 2022 house value $212,761 White Non-Hispanic householders$169,103 Black or African American householders $214,477 Asian householders$197,319 Some other race householders$256,229 Two or more races householders$212,761 Hispanic or Latino householders
Median age by race in Summit
40.9 Median age for White residents40.9 40.7 39.1 Median age for Black or African American residents50.2 33.3 45.6 Median age for American Indian / Alaska Native residents58.7 42.9 40.1 Median age for Asian residents40.6 36.6 -687,999,999.3 Median age for Native Hawaiian / Pacific Islander residents-918,721,460.3 -610,229,276.3 34.0 Median age for Other race residents35.8 33.0 39.8 Median age for Two or more races residents40.1 36.9 60.8 Median age for White alone residents57.4 67.6 34.6 Median age for Hispanic or Latino residents38.2 32.5
Owner/renter occupied households by race in Summit
House owners and renters - White residents 833 65.7% Owner occupied435 34.3% Renter occupiedHouse owners and renters - Black or African American residents 161 34.0% Owner occupied313 66.0% Renter occupiedHouse owners and renters - American Indian / Alaska Native residents 68 68.9% Owner occupied31 31.1% Renter occupiedHouse owners and renters - Asian residents 51 36.6% Owner occupied89 63.4% Renter occupiedHouse owners and renters - Other race residents 763 65.6% Owner occupied400 34.4% Renter occupiedHouse owners and renters - Two or more races residents 497 53.6% Owner occupied431 46.4% Renter occupiedHouse owners and renters - White alone residents 436 66.0% Owner occupied225 34.0% Renter occupiedHouse owners and renters - Hispanic or Latino residents 1,536 63.3% Owner occupied891 36.7% Renter occupied
Language usage in Summit
English speakers - Total 28.8% of residents of Summit speak English at home.
63.6% of residents speak Spanish at home 3,460 52.6% Speak English very well3,120 47.4% Speak English less than very well8.3% of residents speak other language at home 349 40.5% Speak English very well512 59.5% Speak English less than very well
English speakers - Born in the United States 62.7% of residents of Summit speak English at home.
27.8% of residents speak Spanish at home 96 63.2% Speak English very well56 36.8% Speak English less than very well10.4% of residents speak other language at home 57 100.0% Speak English very well
English speakers - Native, born elsewhere 0.0% of residents of Summit speak English at home.
88.0% of residents speak Spanish at home 43 58.9% Speak English very well30 41.1% Speak English less than very well9.6% of residents speak other language at home 8 100.0% Speak English very well
English speakers - Foreign-born 8.4% of residents of Summit speak English at home.
79.7% of residents speak Spanish at home 864 24.4% Speak English very well2,670 75.6% Speak English less than very well12.6% of residents speak other language at home 153 27.4% Speak English very well405 72.6% Speak English less than very well
White (Caucasian) - Speak only English Native:
49.0% (1,117)Foreign-born:
8.4% (105)
White (Caucasian) - Speak another language Native:
39.5% (901)Foreign-born:
91.2% (1,139)
American Indian / Alaska Native - Speak another language Native:
100.0% (80)Foreign-born:
69.7% (114)
Asian - Speak only English Native:
33.8% (32)Foreign-born:
18.5% (64)
Asian - Speak another language Native:
66.0% (62)Foreign-born:
80.4% (277)
Other race - Speak only English Native:
18.5% (374)Foreign-born:
4.2% (66)
Other race - Speak another language Native:
81.0% (1,641)Foreign-born:
95.8% (1,484)
Two or more races - Speak only English Native:
27.8% (263)Foreign-born:
10.2% (153)
Two or more races - Speak another language Native:
74.7% (705)Foreign-born:
89.8% (1,345)
White alone - Speak only English Native:
83.4% (725)Foreign-born:
21.4% (71)
White alone - Speak another language Native:
17.5% (152)Foreign-born:
77.9% (258)
Hispanic or Latino - Speak only English Native:
23.6% (944)Foreign-born:
6.0% (225)
Hispanic or Latino - Speak another language Native:
75.8% (3,030)Foreign-born:
93.9% (3,534)
Foreign-born residents in Summit 4,434 residents are foreign born (33.9% Latin America ).
This city:
41.1%Illinois:
14.1%
Marital status for residents in Summit Marital status - White (Caucasian) population 15 years and over
Males 42.4% Never married43.3% Now married2.1% Separated2.5% Widowed9.7% DivorcedFemales 40.2% Never married43.0% Now married0.7% Separated10.3% Widowed5.8% DivorcedWomen who gave birth in the past 12 months Now married:
100.0% (19)Unmarried:
0.0% (0)
Women who did not give birth in the past 12 months Now married:
30.1% (263)Unmarried:
69.9% (611)
Marital status - Black or African American population 15 years and over
Males 54.4% Never married7.2% Now married0.0% Separated12.2% Widowed26.2% DivorcedFemales 52.7% Never married12.4% Now married0.0% Separated15.1% Widowed19.8% DivorcedWomen who did not give birth in the past 12 months Now married:
17.6% (41)Unmarried:
82.4% (191)
Marital status - American Indian / Alaska Native population 15 years and over
Males 26.4% Never married26.4% Now married28.7% Separated0.0% Widowed18.4% DivorcedFemales 29.4% Never married70.6% Now married0.0% Separated0.0% Widowed0.0% DivorcedWomen who gave birth in the past 12 months Now married:
0.0% (0)Unmarried:
100.0% (18)
Marital status - Asian population 15 years and over
Males 31.4% Never married68.6% Now married0.0% Separated0.0% Widowed0.0% DivorcedFemales 12.2% Never married86.3% Now married0.0% Separated1.4% Widowed0.0% DivorcedWomen who did not give birth in the past 12 months Now married:
84.6% (89)Unmarried:
15.4% (16)
Marital status - Other race population 15 years and over
Males 39.2% Never married58.3% Now married0.0% Separated0.0% Widowed2.5% DivorcedFemales 36.9% Never married51.7% Now married0.0% Separated6.1% Widowed5.3% DivorcedWomen who gave birth in the past 12 months Now married:
100.0% (20)Unmarried:
0.0% (0)
Women who did not give birth in the past 12 months Now married:
30.9% (257)Unmarried:
69.1% (575)
Marital status - Two or more races population 15 years and over
Males 51.8% Never married41.7% Now married0.0% Separated0.0% Widowed6.4% DivorcedFemales 25.3% Never married61.4% Now married0.0% Separated8.1% Widowed5.2% DivorcedWomen who gave birth in the past 12 months Now married:
100.0% (29)Unmarried:
0.0% (0)
Women who did not give birth in the past 12 months Now married:
49.6% (187)Unmarried:
50.4% (190)
Marital status - White alone, not Hispanic / Latino population 15 years and over
Males 36.1% Never married39.3% Now married1.7% Separated4.4% Widowed18.5% DivorcedFemales 16.1% Never married48.6% Now married0.0% Separated22.7% Widowed12.5% DivorcedWomen who did not give birth in the past 12 months Now married:
0.0% (0)Unmarried:
100.0% (43)
Marital status - Hispanic or Latino population 15 years and over
Males 45.2% Never married48.4% Now married1.5% Separated0.4% Widowed4.5% DivorcedFemales 39.5% Never married49.7% Now married0.4% Separated5.8% Widowed4.5% DivorcedWomen who gave birth in the past 12 months Now married:
86.1% (62)Unmarried:
13.9% (10)
Women who did not give birth in the past 12 months Now married:
34.8% (672)Unmarried:
65.2% (1,261)
Ancestries in Summit
153 2.1% Polish146 2.0% Albanian77 1.0% Italian70 0.9% American63 0.8% German49 0.7% Lithuanian42 0.6% Irish32 0.4% Jordanian32 0.4% Scottish30 0.4% Czech26 0.3% Russian17 0.2% Iranian15 0.2% English12 0.2% Greek9 0.1% Croatian9 0.1% African5 0.07% Slovak
Children Nativity (place of birth) in Summit
Children under 6 years - Living with two parents Both parents native 125 100.0% NativeBoth parents foreign-born 53 100.0% NativeOne native, one foreign-born parent 188 100.0% NativeChildren under 6 years - Living with one parent Native parent 141 100.0% NativeForeign-born parent 15 100.0% NativeChildren 6 to 17 years - Living with two parents Both parents native 217 100.0% NativeBoth parents foreign-born 678 87.9% Native93 12.1% Foreign-bornOne native, one foreign-born parent 138 100.0% NativeChildren 6 to 17 years - Living with one parent Native parent 323 100.0% NativeForeign-born parent 303 50.1% Native302 49.9% Foreign-born
Grandparents responsible for own grandchildren in Summit
Grandparents (30 to 59 years) White / Caucasian 44 71.4% Responsible for grandchildren18 28.6% Not responsible for grandchildrenBlack or African American 97 100.0% Responsible for grandchildrenOther race 46 100.0% Not responsible for grandchildrenTwo or more races 97 77.6% Responsible for grandchildren28 22.4% Not responsible for grandchildrenHispanic or Latino 157 64.7% Responsible for grandchildren85 35.3% Not responsible for grandchildren
Grandparents (60 years and over) White / Caucasian 50 100.0% Not responsible for grandchildrenBlack or African American 9 100.0% Not responsible for grandchildrenOther race 13 100.0% Not responsible for grandchildrenTwo or more races 21 100.0% Not responsible for grandchildrenHispanic or Latino 67 100.0% Not responsible for grandchildren