Races in Tifton, Georgia (GA) Detailed Stats
Ancestries, Foreign-born residents, place of birth
Settings
X


Recent posts about races in Tifton, Georgia on our local forum with over 2,400,000 registered users:
 | Is there any conflicts between Latinos and Blacks ? i n( Georgia or Atlanta) (71 replies) |
| BREAKING: Atlanta police chief resigns (369 replies) |
| Perry/Cordele former Holiday Inn’s (5 replies) |
| New Job in Albany, GA (20 replies) |
| U.S. House okays bill designating Georgia’s first national historic park (0 replies) |
| The ATL toting the load for the rest of the state (47 replies) |
Latest news about races in Tifton, GA collected exclusively by city-data.com from local newspapers, TV, and radio stations
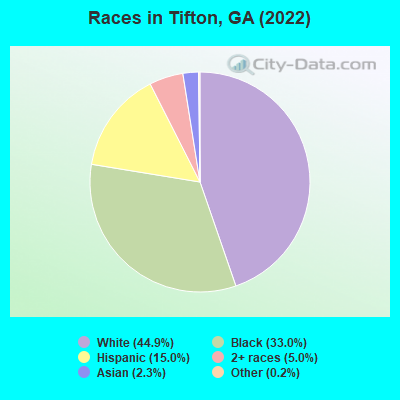
According to 2022 data, the most numerous races in Tifton, GA are White alone (7,788 residents), Black alone (5,722 residents), and Hispanic (2,596 residents). 85.4% of Tifton residents speak English at home. 6.2% of Tifton, GA residents are foreign-born (4.3% born in Latin America, 1.6% born in Asia), which is 62.3% less than the foreign-born rate of 10.0% across the entire state of Georgia.
Race distribution in Tifton
2000
2022

- 8,85258.8%White alone
- 4,71631.3%Black alone
- 1,1397.6%Hispanic
- 2451.6%Asian alone
- 740.5%Two or more races
- 270.2%American Indian alone
- 40.03%Native Hawaiian and Other
Pacific Islander alone - 30.02%Other race alone

-
- 7,78844.9%White alone
- 5,72233.0%Black alone
- 2,59615.0%Hispanic
- 8725.0%Two or more races
- 3972.3%Asian alone
- 360.2%Other race alone
- 80.05%American Indian alone
2000
2022
-
- 5,128,66162.6%White alone
- 2,331,46528.5%Black alone
- 435,2275.3%Hispanic
- 171,5132.1%Asian alone
- 87,3641.1%Two or more races
- 17,6700.2%American Indian alone
- 11,2750.1%Other race alone
- 3,2780.04%Native Hawaiian and Other
Pacific Islander alone

-
- 5,415,65749.6%White alone
- 3,349,24030.7%Black alone
- 1,132,60410.4%Hispanic
- 479,1564.4%Asian alone
- 462,9234.2%Two or more races
- 54,4160.5%Other race alone
- 11,9230.1%American Indian alone
- 6,9570.06%Native Hawaiian and Other
Pacific Islander alone

Income and house value in Tifton
- Median household income in 2022
- $56,737White non-Hispanic householders
- $31,245Black householders
- $120,821Asian householders
- $45,268Two or more races householders
- $58,175Hispanic or Latino race householders
- Median 2022 house value
- $212,707White Non-Hispanic householders
- $119,647Black or African American householders
- $249,830Some other race householders
- $60,200Two or more races householders
- $239,295Hispanic or Latino householders
Household income for White non-Hispanic householders

Household income for Black householders

Household income for Asian householders

Household income for Some other race householders

Household income for Two or more races householders

Household income for Hispanic or Latino race householders

Median age by race in Tifton
- 37.5Median age for White residents
- 35.7Males
- 44.3Females
- 35.8Median age for Black or African American residents
- 35.8Males
- 36.0Females
- 10.9Median age for American Indian / Alaska Native residents
- 7.1Males
- -597,938,143.7Females
- 34.9Median age for Asian residents
- 30.6Males
- 37.4Females
- -657,243,815.6Median age for Native Hawaiian / Pacific Islander residents
- -693,227,090.9Males
- -776,776,776.0Females
- 46.3Median age for Other race residents
- 28.6Males
- 58.6Females
- 27.3Median age for Two or more races residents
- 13.4Males
- 31.4Females
- 40.5Median age for White alone residents
- 32.6Males
- 47.0Females
- 27.2Median age for Hispanic or Latino residents
- 23.9Males
- 29.9Females
Owner/renter occupied households by race in Tifton
- House owners and renters - White residents
- 1,69649.8%Owner occupied
- 1,70850.2%Renter occupied
- House owners and renters - Black or African American residents
- 52623.3%Owner occupied
- 1,72776.7%Renter occupied
- House owners and renters - American Indian / Alaska Native residents
- 7100.0%Owner occupied
- House owners and renters - Asian residents
- 10188.7%Owner occupied
- 1311.3%Renter occupied
- House owners and renters - Other race residents
- 12159.1%Owner occupied
- 8440.9%Renter occupied
- House owners and renters - Two or more races residents
- 27529.5%Owner occupied
- 65770.5%Renter occupied
- House owners and renters - White alone residents
- 1,63951.3%Owner occupied
- 1,55748.7%Renter occupied
- House owners and renters - Hispanic or Latino residents
- 32740.5%Owner occupied
- 48059.5%Renter occupied
Language usage in Tifton
- English speakers - Total
- 85.4% of residents of Tifton speak English at home.
- 11.6% of residents speak Spanish at home
- 1,12460.3%Speak English very well
- 74039.7%Speak English less than very well
- 2.9% of residents speak other language at home
- 30666.4%Speak English very well
- 15533.6%Speak English less than very well
- English speakers - Born in the United States
- 82.7% of residents of Tifton speak English at home.
- 15.7% of residents speak Spanish at home
- 40189.9%Speak English very well
- 4510.1%Speak English less than very well
- 1.2% of residents speak other language at home
- 33100.0%Speak English very well
- English speakers - Native, born elsewhere
- 32.3% of residents of Tifton speak English at home.
- 67.7% of residents speak Spanish at home
- 1047.6%Speak English very well
- 1152.4%Speak English less than very well
- English speakers - Foreign-born
- 0.1% of residents of Tifton speak English at home.
- 70.1% of residents speak Spanish at home
- 33945.1%Speak English very well
- 41254.9%Speak English less than very well
- 28.7% of residents speak other language at home
- 16453.4%Speak English very well
- 14346.6%Speak English less than very well
White (Caucasian) - Speak another language
| Native: | 3.8% (289) |
| Foreign-born: | 89.1% (130) |
Black or African American - Speak only English
| Native: | 99.1% (5,152) |
| Foreign-born: | 97.7% (1) |
Asian - Speak another language
| Native: | 100.0% (121) |
| Foreign-born: | 100.0% (247) |
Other race - Speak another language
| Native: | 87.1% (314) |
| Foreign-born: | 99.0% (248) |
Two or more races - Speak another language
| Native: | 31.1% (571) |
| Foreign-born: | 99.4% (516) |
White alone - Speak another language
| Native: | 1.2% (86) |
| Foreign-born: | 99.6% (11) |
Hispanic or Latino - Speak another language
| Native: | 66.2% (1,029) |
| Foreign-born: | 99.8% (763) |
Foreign-born residents in Tifton
1,070 residents are foreign born (4.3% Latin America, 1.6% Asia).
| This city: | 6.2% |
| Georgia: | 10.4% |


Marital status for residents in Tifton
Marital status - White (Caucasian) population 15 years and over
- Males
- 46.3%Never married
- 37.3%Now married
- 5.8%Separated
- 1.0%Widowed
- 9.7%Divorced
- Females
- 37.1%Never married
- 37.3%Now married
- 0.5%Separated
- 12.0%Widowed
- 13.1%Divorced
Women who gave birth in the past 12 months
| Now married: | 100.0% (12) |
| Unmarried: | 0.0% (0) |
Women who did not give birth in the past 12 months
| Now married: | 23.8% (472) |
| Unmarried: | 76.2% (1,512) |
Marital status - Black or African American population 15 years and over
- Males
- 53.1%Never married
- 20.4%Now married
- 5.8%Separated
- 3.4%Widowed
- 17.4%Divorced
- Females
- 53.8%Never married
- 19.8%Now married
- 5.5%Separated
- 10.9%Widowed
- 10.0%Divorced
Women who gave birth in the past 12 months
| Now married: | 0.0% (0) |
| Unmarried: | 100.0% (66) |
Women who did not give birth in the past 12 months
| Now married: | 19.2% (287) |
| Unmarried: | 80.8% (1,211) |
Marital status - American Indian / Alaska Native population 15 years and over
- Males
- 0.0%Never married
- 0.0%Now married
- 0.0%Separated
- 0.0%Widowed
- 100.0%Divorced
- Females
- 0.0%Never married
- 0.0%Now married
- 0.0%Separated
- 0.0%Widowed
- 100.0%Divorced
Women who did not give birth in the past 12 months
| Now married: | 0.0% (0) |
| Unmarried: | 100.0% (8) |
Marital status - Asian population 15 years and over
- Males
- 40.0%Never married
- 60.0%Now married
- 0.0%Separated
- 0.0%Widowed
- 0.0%Divorced
- Females
- 12.7%Never married
- 87.3%Now married
- 0.0%Separated
- 0.0%Widowed
- 0.0%Divorced
Women who did not give birth in the past 12 months
| Now married: | 93.2% (143) |
| Unmarried: | 6.8% (10) |
Marital status - Other race population 15 years and over
- Males
- 50.7%Never married
- 49.3%Now married
- 0.0%Separated
- 0.0%Widowed
- 0.0%Divorced
- Females
- 9.0%Never married
- 91.0%Now married
- 0.0%Separated
- 0.0%Widowed
- 0.0%Divorced
Women who gave birth in the past 12 months
| Now married: | 100.0% (13) |
| Unmarried: | 0.0% (0) |
Women who did not give birth in the past 12 months
| Now married: | 20.0% (4) |
| Unmarried: | 80.0% (16) |
Marital status - Two or more races population 15 years and over
- Males
- 71.3%Never married
- 14.5%Now married
- 7.8%Separated
- 0.0%Widowed
- 6.5%Divorced
- Females
- 34.0%Never married
- 18.5%Now married
- 0.0%Separated
- 6.5%Widowed
- 41.0%Divorced
Women who gave birth in the past 12 months
| Now married: | 27.6% (31) |
| Unmarried: | 72.4% (81) |
Women who did not give birth in the past 12 months
| Now married: | 16.7% (108) |
| Unmarried: | 83.3% (539) |
Marital status - White alone, not Hispanic / Latino population 15 years and over
- Males
- 48.6%Never married
- 38.7%Now married
- 0.9%Separated
- 1.1%Widowed
- 10.8%Divorced
- Females
- 34.6%Never married
- 37.9%Now married
- 0.5%Separated
- 12.9%Widowed
- 14.1%Divorced
Women who gave birth in the past 12 months
| Now married: | 100.0% (13) |
| Unmarried: | 0.0% (0) |
Women who did not give birth in the past 12 months
| Now married: | 23.1% (417) |
| Unmarried: | 76.9% (1,389) |
Marital status - Hispanic or Latino population 15 years and over
- Males
- 55.1%Never married
- 26.7%Now married
- 17.1%Separated
- 0.0%Widowed
- 1.1%Divorced
- Females
- 34.4%Never married
- 34.6%Now married
- 0.0%Separated
- 0.0%Widowed
- 31.0%Divorced
Women who gave birth in the past 12 months
| Now married: | 36.0% (33) |
| Unmarried: | 64.0% (59) |
Women who did not give birth in the past 12 months
| Now married: | 22.7% (119) |
| Unmarried: | 77.3% (404) |
Ancestries in Tifton

- 3,60532.1%American
- 5194.6%English
- 3473.1%Irish
- 1161.0%European
- 990.9%German
- 790.7%Scotch-Irish
- 510.5%African
- 510.5%Haitian
- 410.4%Italian
- 370.3%Scottish
- 310.3%Welsh
- 220.2%Iraqi
- 120.1%Eastern European
- 120.1%French
- 80.07%British

Geographical mobility in Tifton

- Same house 1 year ago
- 7,12287.8%White (Caucasian)
- 4,80185.6%Black or African American
- 5699.5%American Indian / Alaska Native
- 30977.5%Asian
- 61098.1%Other race
- 2,19989.3%Two or more races
- 6,83788.5%White alone, not Hispanic / Latino
- 2,20191.5%Hispanic or Latino

-
- Moved within same county
- 3324.1%White / Caucasian
- 4738.4%Black or African American
- 6716.7%Asian
- 101.6%Other race
- 1315.3%Two or more races
- 2923.8%White alone, not Hispanic / Latino
- 1054.4%Hispanic or Latino

-
- Moved within same state
- 5556.8%White / Caucasian
- 2073.7%Black or African American
- 1204.9%Two or more races
- 5196.7%White alone, not Hispanic / Latino
- 512.1%Hispanic or Latino

-
- Moved from different state
- 991.2%White / Caucasian
- 581.0%Black or African American
- 61.6%Asian
- 90.4%Two or more races
- 620.8%White alone, not Hispanic / Latino
- 381.6%Hispanic or Latino

-
- Moved from abroad
- 30.9%Asian

Children Nativity (place of birth) in Tifton
Place of birth for residents in Tifton
![Place of birth for the foreign-born population - Regions]()
- 766Americas
- 766Latin America
- 765Central America
- 291Asia
- 141Eastern Asia
- 131China
- 92South Eastern Asia
- 38Western Asia
- 17South Central Asia
- 12Europe
- 12Western Europe
- 1Caribbean

![Place of birth for the foreign-born population - Countries]()
- 703Mexico
- 131China
- 70Vietnam
- 62Honduras
- 38Saudi Arabia
- 21Philippines
- 14India
- 12France
- 10Korea
- 3Sri Lanka
- 1Trinidad and Tobago

Grandparents responsible for own grandchildren in Tifton
Zip codes: 31794.