Races in Townsend, Delaware (DE) Detailed Stats
Data:
Races - White alone (%)
Races - White alone (% change since 2000)
Races - Black alone (%)
Races - Black alone (% change since 2000)
Races - American Indian alone (%)
Races - American Indian alone (% change since 2000)
Races - Asian alone (%)
Races - Asian alone (% change since 2000)
Races - Hispanic (%)
Races - Hispanic (% change since 2000)
Races - Native Hawaiian and Other Pacific Islander alone (%)
Races - Native Hawaiian and Other Pacific Islander alone (% change since 2000)
Races - Two or more races(%)
Races - Two or more races(% change since 2000)
Races - Other race alone (%)
Races - Other race alone (% change since 2000)
Racial diversity
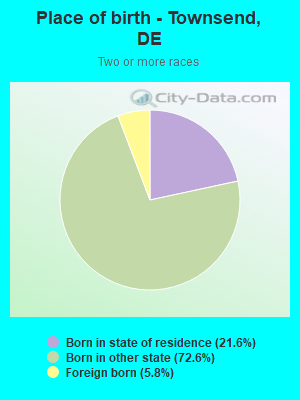
Place of birth - Born in state of residence (%)
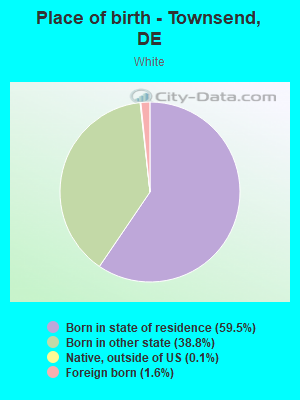
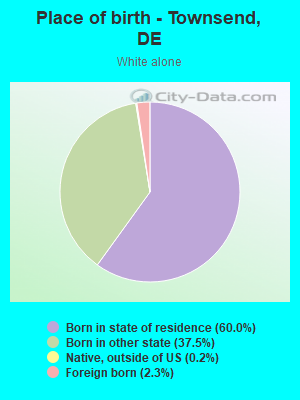
Place of birth - Born in state of residence (%) - White
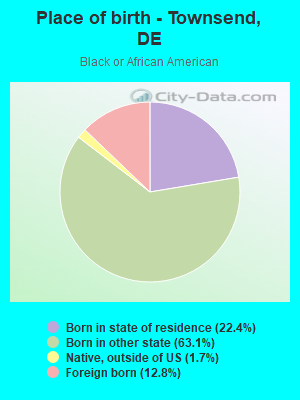
Place of birth - Born in state of residence (%) - Black or African American
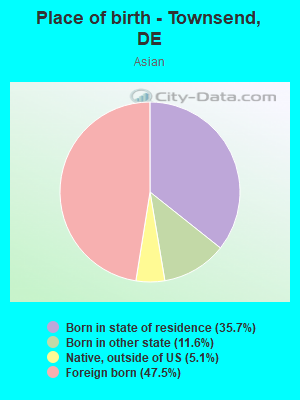
Place of birth - Born in state of residence (%) - Asian
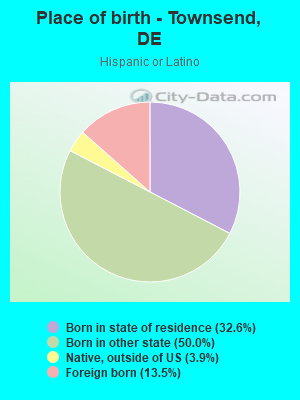
Place of birth - Born in state of residence (%) - Hispanic or Latino
Place of birth - Born in state of residence (%) - American Indian and Alaska Native
Place of birth - Born in state of residence (%) - Multirace
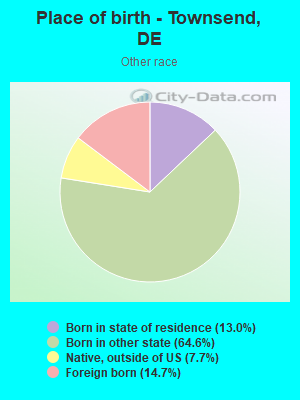
Place of birth - Born in state of residence (%) - Other Race
Place of birth - Born in other state (%)
Place of birth - Born in other state (%) - White
Place of birth - Born in other state (%) - Black or African American
Place of birth - Born in other state (%) - Asian
Place of birth - Born in other state (%) - Hispanic or Latino
Place of birth - Born in other state (%) - American Indian and Alaska Native
Place of birth - Born in other state (%) - Multirace
Place of birth - Born in other state (%) - Other Race
Place of birth - Native, outside of US (%)
Place of birth - Native, outside of US (%) - White
Place of birth - Native, outside of US (%) - Black or African American
Place of birth - Native, outside of US (%) - Asian
Place of birth - Native, outside of US (%) - Hispanic or Latino
Place of birth - Native, outside of US (%) - American Indian and Alaska Native
Place of birth - Native, outside of US (%) - Multirace
Place of birth - Native, outside of US (%) - Other Race
Place of birth - Foreign born (%)
Place of birth - Foreign born (%) - White
Place of birth - Foreign born (%) - Black or African American
Place of birth - Foreign born (%) - Asian
Place of birth - Foreign born (%) - Hispanic or Latino
Place of birth - Foreign born (%) - American Indian and Alaska Native
Place of birth - Foreign born (%) - Multirace
Place of birth - Foreign born (%) - Other Race
Residents speaking English at home (%)
Residents speaking English at home - Born in the United States (%)
Residents speaking English at home - Native, born elsewhere (%)
Residents speaking English at home - Foreign born (%)
Residents speaking Spanish at home (%)
Residents speaking Spanish at home - Born in the United States (%)
Residents speaking Spanish at home - Native, born elsewhere (%)
Residents speaking Spanish at home - Foreign born (%)
Residents speaking other language at home (%)
Residents speaking other language at home - Born in the United States (%)
Residents speaking other language at home - Native, born elsewhere (%)
Residents speaking other language at home - Foreign born (%)
Marital status - Never married (%)
Marital status - Now married (%)
Marital status - Separated (%)
Marital status - Widowed (%)
Marital status - Divorced (%)
Ancestries Reported - Arab (%)
Ancestries Reported - Czech (%)
Ancestries Reported - Danish (%)
Ancestries Reported - Dutch (%)
Ancestries Reported - English (%)
Ancestries Reported - French (%)
Ancestries Reported - French Canadian (%)
Ancestries Reported - German (%)
Ancestries Reported - Greek (%)
Ancestries Reported - Hungarian (%)
Ancestries Reported - Irish (%)
Ancestries Reported - Italian (%)
Ancestries Reported - Lithuanian (%)
Ancestries Reported - Norwegian (%)
Ancestries Reported - Polish (%)
Ancestries Reported - Portuguese (%)
Ancestries Reported - Russian (%)
Ancestries Reported - Scotch-Irish (%)
Ancestries Reported - Scottish (%)
Ancestries Reported - Slovak (%)
Ancestries Reported - Subsaharan African (%)
Ancestries Reported - Swedish (%)
Ancestries Reported - Swiss (%)
Ancestries Reported - Ukrainian (%)
Ancestries Reported - United States (%)
Ancestries Reported - Welsh (%)
Ancestries Reported - West Indian (%)
Ancestries Reported - Other (%)
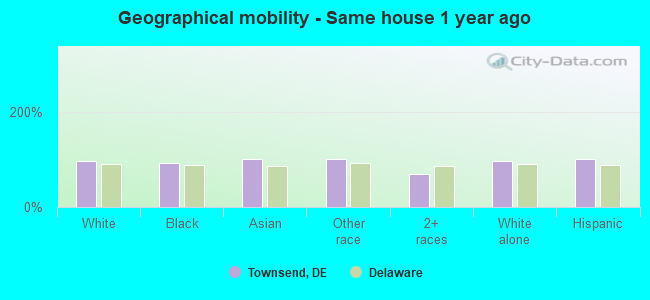
Geographical mobility - Same house 1 year ago (%)
Geographical mobility - Same house 1 year ago (%) - White
Geographical mobility - Same house 1 year ago (%) - Black or African American
Geographical mobility - Same house 1 year ago (%) - Asian
Geographical mobility - Same house 1 year ago (%) - Hispanic or Latino
Geographical mobility - Same house 1 year ago (%) - American Indian and Alaska Native
Geographical mobility - Same house 1 year ago (%) - Multirace
Geographical mobility - Same house 1 year ago (%) - Other Race
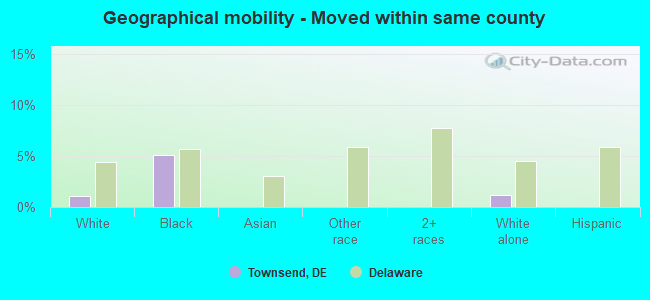
Geographical mobility - Moved within same county (%)
Geographical mobility - Moved within same county (%) - White
Geographical mobility - Moved within same county (%) - Black or African American
Geographical mobility - Moved within same county (%) - Asian
Geographical mobility - Moved within same county (%) - Hispanic or Latino
Geographical mobility - Moved within same county (%) - American Indian and Alaska Native
Geographical mobility - Moved within same county (%) - Multirace
Geographical mobility - Moved within same county (%) - Other Race
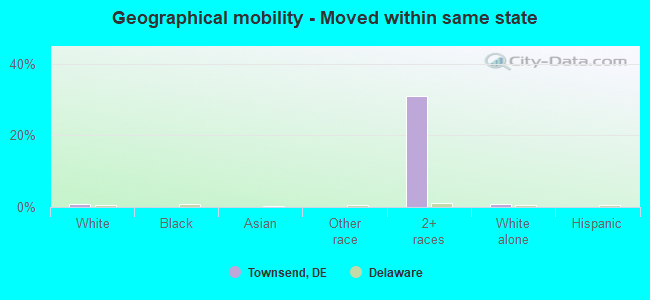
Geographical mobility - Moved from different county within same state (%)
Geographical mobility - Moved from different county within same state (%) - White
Geographical mobility - Moved from different county within same state (%) - Black or African American
Geographical mobility - Moved from different county within same state (%) - Asian
Geographical mobility - Moved from different county within same state (%) - Hispanic or Latino
Geographical mobility - Moved from different county within same state (%) - American Indian and Alaska Native
Geographical mobility - Moved from different county within same state (%) - Multirace
Geographical mobility - Moved from different county within same state (%) - Other Race
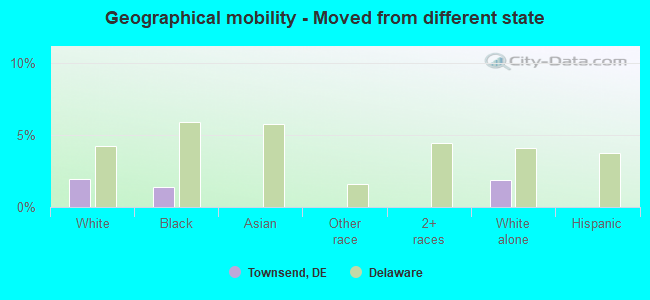
Geographical mobility - Moved from different state (%)
Geographical mobility - Moved from different state (%) - White
Geographical mobility - Moved from different state (%) - Black or African American
Geographical mobility - Moved from different state (%) - Asian
Geographical mobility - Moved from different state (%) - Hispanic or Latino
Geographical mobility - Moved from different state (%) - American Indian and Alaska Native
Geographical mobility - Moved from different state (%) - Multirace
Geographical mobility - Moved from different state (%) - Other Race
Geographical mobility - Moved from abroad (%)
Geographical mobility - Moved from abroad (%) - White
Geographical mobility - Moved from abroad (%) - Black or African American
Geographical mobility - Moved from abroad (%) - Asian
Geographical mobility - Moved from abroad (%) - Hispanic or Latino
Geographical mobility - Moved from abroad (%) - American Indian and Alaska Native
Geographical mobility - Moved from abroad (%) - Multirace
Geographical mobility - Moved from abroad (%) - Other Race
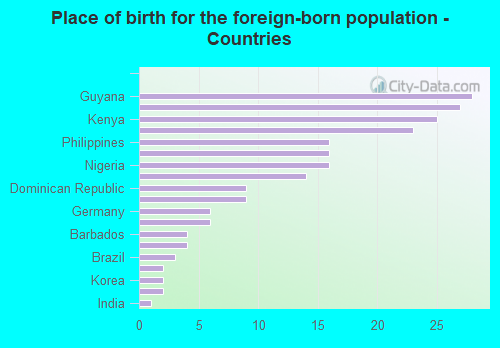
Place of birth for the foreign-born population - Ireland (%)
Place of birth for the foreign-born population - Denmark (%)
Place of birth for the foreign-born population - Norway (%)
Place of birth for the foreign-born population - Sweden (%)
Place of birth for the foreign-born population - United Kingdom (%)
Place of birth for the foreign-born population - England (%)
Place of birth for the foreign-born population - Scotland (%)
Place of birth for the foreign-born population - Other Northern Europe (%)
Place of birth for the foreign-born population - Austria (%)
Place of birth for the foreign-born population - Belgium (%)
Place of birth for the foreign-born population - France (%)
Place of birth for the foreign-born population - Germany (%)
Place of birth for the foreign-born population - Netherlands (%)
Place of birth for the foreign-born population - Switzerland (%)
Place of birth for the foreign-born population - Other Western Europe (%)
Place of birth for the foreign-born population - Greece (%)
Place of birth for the foreign-born population - Italy (%)
Place of birth for the foreign-born population - Portugal (%)
Place of birth for the foreign-born population - Spain (%)
Place of birth for the foreign-born population - Other Southern Europe (%)
Place of birth for the foreign-born population - Albania (%)
Place of birth for the foreign-born population - Belarus (%)
Place of birth for the foreign-born population - Bosnia and Herzegovina (%)
Place of birth for the foreign-born population - Bulgaria (%)
Place of birth for the foreign-born population - Croatia (%)
Place of birth for the foreign-born population - Czechoslovakia (%)
Place of birth for the foreign-born population - Hungary (%)
Place of birth for the foreign-born population - Latvia (%)
Place of birth for the foreign-born population - Lithuania (%)
Place of birth for the foreign-born population - North Macedonia (Macedonia) (%)
Place of birth for the foreign-born population - Moldova (%)
Place of birth for the foreign-born population - Poland (%)
Place of birth for the foreign-born population - Romania (%)
Place of birth for the foreign-born population - Russia (%)
Place of birth for the foreign-born population - Serbia (%)
Place of birth for the foreign-born population - Ukraine (%)
Place of birth for the foreign-born population - Other Eastern Europe (%)
Place of birth for the foreign-born population - China (%)
Place of birth for the foreign-born population - Hong Kong (%)
Place of birth for the foreign-born population - Taiwan (%)
Place of birth for the foreign-born population - Japan (%)
Place of birth for the foreign-born population - Korea (%)
Place of birth for the foreign-born population - Other Eastern Asia (%)
Place of birth for the foreign-born population - Afghanistan (%)
Place of birth for the foreign-born population - Bangladesh (%)
Place of birth for the foreign-born population - India (%)
Place of birth for the foreign-born population - Iran (%)
Place of birth for the foreign-born population - Kazakhstan (%)
Place of birth for the foreign-born population - Nepal (%)
Place of birth for the foreign-born population - Pakistan (%)
Place of birth for the foreign-born population - Sri Lanka (%)
Place of birth for the foreign-born population - Uzbekistan (%)
Place of birth for the foreign-born population - Other South Central Asia (%)
Place of birth for the foreign-born population - Burma (%)
Place of birth for the foreign-born population - Cambodia (%)
Place of birth for the foreign-born population - Indonesia (%)
Place of birth for the foreign-born population - Laos (%)
Place of birth for the foreign-born population - Malaysia (%)
Place of birth for the foreign-born population - Philippines (%)
Place of birth for the foreign-born population - Singapore (%)
Place of birth for the foreign-born population - Thailand (%)
Place of birth for the foreign-born population - Vietnam (%)
Place of birth for the foreign-born population - Other South Eastern Asia (%)
Place of birth for the foreign-born population - Armenia (%)
Place of birth for the foreign-born population - Iraq (%)
Place of birth for the foreign-born population - Israel (%)
Place of birth for the foreign-born population - Jordan (%)
Place of birth for the foreign-born population - Kuwait (%)
Place of birth for the foreign-born population - Lebanon (%)
Place of birth for the foreign-born population - Saudi Arabia (%)
Place of birth for the foreign-born population - Syria (%)
Place of birth for the foreign-born population - Turkey (%)
Place of birth for the foreign-born population - Yemen (%)
Place of birth for the foreign-born population - Other Western Asia (%)
Place of birth for the foreign-born population - Eritrea (%)
Place of birth for the foreign-born population - Ethiopia (%)
Place of birth for the foreign-born population - Kenya (%)
Place of birth for the foreign-born population - Somalia (%)
Place of birth for the foreign-born population - Uganda (%)
Place of birth for the foreign-born population - Zimbabwe (%)
Place of birth for the foreign-born population - Other Eastern Africa (%)
Place of birth for the foreign-born population - Cameroon (%)
Place of birth for the foreign-born population - Congo (%)
Place of birth for the foreign-born population - Democratic Republic of Congo (Zaire) (%)
Place of birth for the foreign-born population - Other Middle Africa (%)
Place of birth for the foreign-born population - Egypt (%)
Place of birth for the foreign-born population - Morocco (%)
Place of birth for the foreign-born population - Sudan (%)
Place of birth for the foreign-born population - Other Northern Africa (%)
Place of birth for the foreign-born population - South Africa (%)
Place of birth for the foreign-born population - Other Southern Africa (%)
Place of birth for the foreign-born population - Cabo Verde (%)
Place of birth for the foreign-born population - Ghana (%)
Place of birth for the foreign-born population - Liberia (%)
Place of birth for the foreign-born population - Nigeria (%)
Place of birth for the foreign-born population - Senegal (%)
Place of birth for the foreign-born population - Sierra Leone (%)
Place of birth for the foreign-born population - Other Western Africa (%)
Place of birth for the foreign-born population - Australia (%)
Place of birth for the foreign-born population - New Zealand (%)
Place of birth for the foreign-born population - Fiji (%)
Place of birth for the foreign-born population - Micronesia (%)
Place of birth for the foreign-born population - Bahamas (%)
Place of birth for the foreign-born population - Barbados (%)
Place of birth for the foreign-born population - Cuba (%)
Place of birth for the foreign-born population - Dominica (%)
Place of birth for the foreign-born population - Dominican Republic (%)
Place of birth for the foreign-born population - Grenada (%)
Place of birth for the foreign-born population - Haiti (%)
Place of birth for the foreign-born population - Jamaica (%)
Place of birth for the foreign-born population - St. Vincent and the Grenadines (%)
Place of birth for the foreign-born population - Trinidad and Tobago (%)
Place of birth for the foreign-born population - West Indies (%)
Place of birth for the foreign-born population - Other Caribbean (%)
Place of birth for the foreign-born population - Belize (%)
Place of birth for the foreign-born population - Costa Rica (%)
Place of birth for the foreign-born population - El Salvador (%)
Place of birth for the foreign-born population - Guatemala (%)
Place of birth for the foreign-born population - Honduras (%)
Place of birth for the foreign-born population - Mexico (%)
Place of birth for the foreign-born population - Nicaragua (%)
Place of birth for the foreign-born population - Panama (%)
Place of birth for the foreign-born population - Other Central America (%)
Place of birth for the foreign-born population - Argentina (%)
Place of birth for the foreign-born population - Bolivia (%)
Place of birth for the foreign-born population - Brazil (%)
Place of birth for the foreign-born population - Chile (%)
Place of birth for the foreign-born population - Colombia (%)
Place of birth for the foreign-born population - Ecuador (%)
Place of birth for the foreign-born population - Guyana (%)
Place of birth for the foreign-born population - Peru (%)
Place of birth for the foreign-born population - Uruguay (%)
Place of birth for the foreign-born population - Venezuela (%)
Place of birth for the foreign-born population - Other South America (%)
Place of birth for the foreign-born population - Canada (%)
Place of birth for the foreign-born population - Other Northern America (%)
Place of birth for the foreign-born population - Other (%)
Latest news about races in Townsend, DE collected exclusively by city-data.com from local newspapers, TV, and radio stations
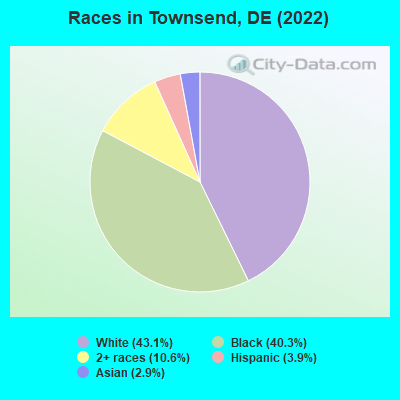
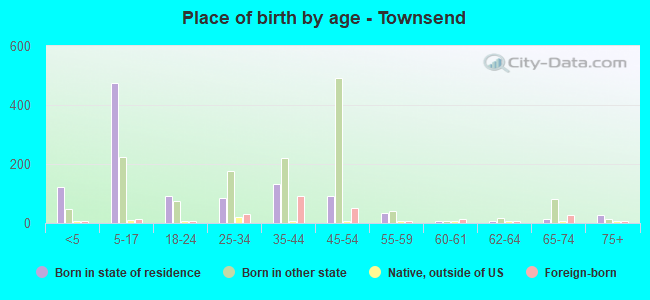
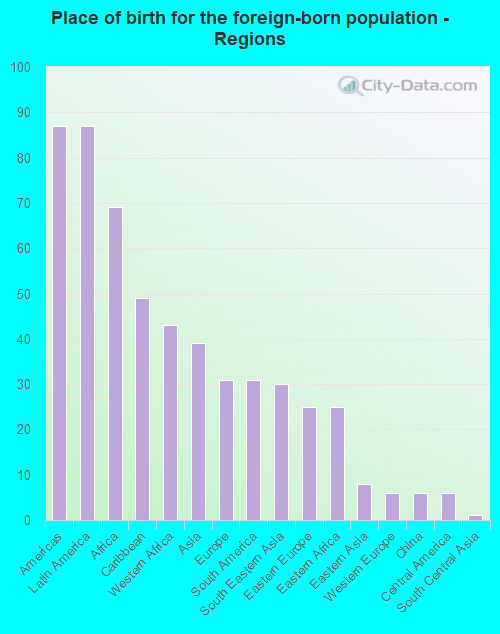
According to 2022 data, the most numerous races in Townsend, DE are White alone (1,185 residents), Black alone (1,108 residents), and Hispanic (106 residents). 87.9% of Townsend residents speak English at home. 8.3% of Townsend, DE residents are foreign-born (3.1% born in Latin America, 2.5% born in Africa, 1.4% born in Asia, 1.1% born in Europe), which is 8.6% less than the foreign-born rate of 9.0% across the entire state of Delaware.
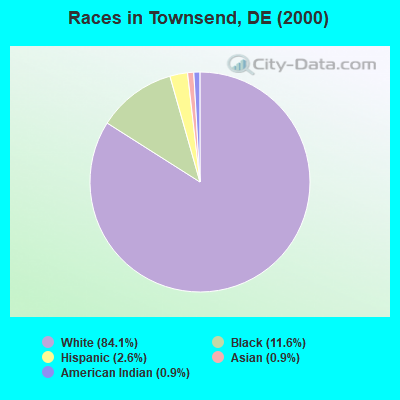
Race distribution in Townsend
2000 2022
567,973 72.5% White alone 148,435 18.9% Black alone 37,277 4.8% Hispanic 16,110 2.1% Asian alone 10,222 1.3% Two or more races 2,324 0.3% American Indian alone 1,025 0.1% Other race alone 234 0.03% Native Hawaiian and Other
599,347 58.9% White alone 220,010 21.6% Black alone 105,300 10.3% Hispanic 46,016 4.5% Two or more races 41,350 4.1% Asian alone 5,097 0.5% Other race alone 1,276 0.1% American Indian alone
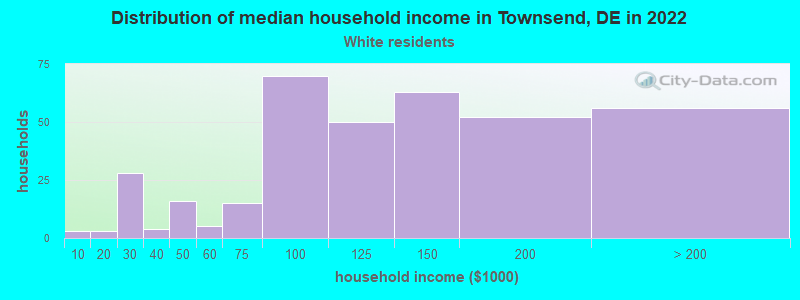
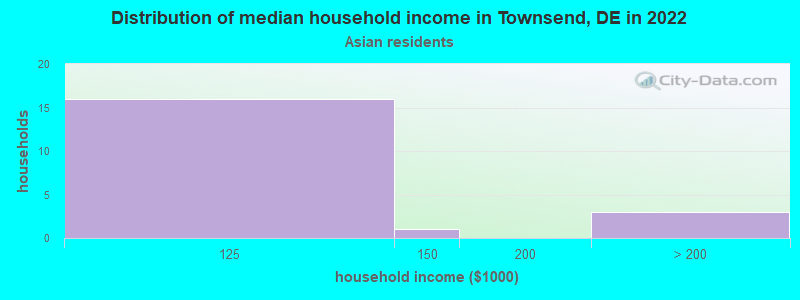
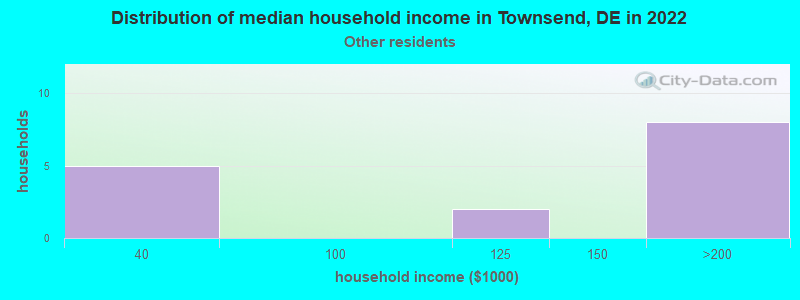
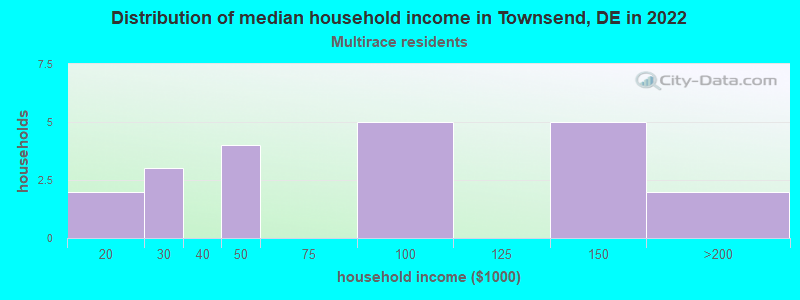
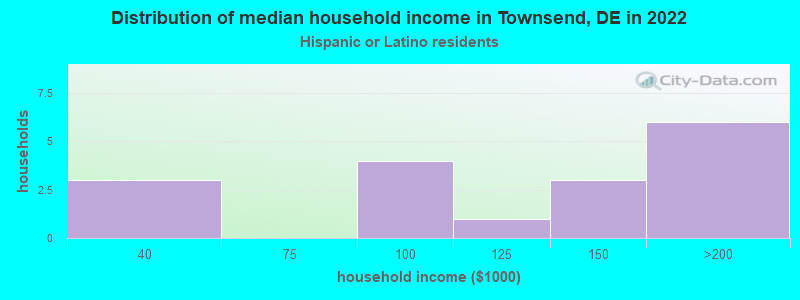
Income and house value in Townsend Median household income in 2022 $119,486 White non-Hispanic householders$156,895 Black householders$93,812 Asian householders$125,563 Hispanic or Latino race householdersMedian 2022 house value $423,306 White Non-Hispanic householders$390,648 Black or African American householders$397,766 American Indian or Alaska Native householders $272,155 Asian householders
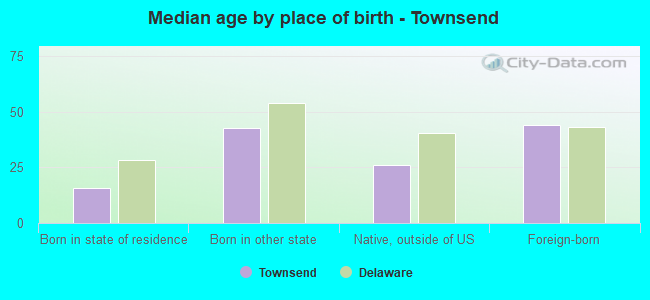
Median age by race in Townsend
34.8 Median age for White residents24.3 36.5 37.9 Median age for Black or African American residents35.5 40.0 -592,964,823.5 Median age for American Indian / Alaska Native residents-639,393,938.8 -659,673,659.0 28.0 Median age for Asian residents14.5 38.4 -666,666,666.0 Median age for Native Hawaiian / Pacific Islander residents-668,724,279.2 -670,599,802.7 40.3 Median age for Other race residents42.5 36.4 34.1 Median age for Two or more races residents26.3 55.7 33.8 Median age for White alone residents23.5 35.3 35.4 Median age for Hispanic or Latino residents46.4 17.8
Owner/renter occupied households by race in Townsend
House owners and renters - White residents 340 92.7% Owner occupied27 7.3% Renter occupiedHouse owners and renters - Black or African American residents 314 100.0% Owner occupiedHouse owners and renters - Asian residents 16 100.0% Owner occupiedHouse owners and renters - Other race residents 14 100.0% Owner occupiedHouse owners and renters - Two or more races residents 22 100.0% Owner occupiedHouse owners and renters - White alone residents 345 92.3% Owner occupied29 7.7% Renter occupiedHouse owners and renters - Hispanic or Latino residents 18 100.0% Owner occupied
Language usage in Townsend
English speakers - Total 87.9% of residents of Townsend speak English at home.
2.4% of residents speak Spanish at home 56 91.8% Speak English very well5 8.2% Speak English less than very well10.0% of residents speak other language at home 167 64.7% Speak English very well91 35.3% Speak English less than very well
English speakers - Born in the United States 93.5% of residents of Townsend speak English at home.
2.2% of residents speak Spanish at home 27 90.0% Speak English very well3 10.0% Speak English less than very well4.5% of residents speak other language at home 49 79.0% Speak English very well13 21.0% Speak English less than very well
English speakers - Native, born elsewhere 87.5% of residents of Townsend speak English at home.
12.5% of residents speak other language at home 3 100.0% Speak English very well
English speakers - Foreign-born 26.8% of residents of Townsend speak English at home.
5.2% of residents speak Spanish at home 12 100.0% Speak English very well69.3% of residents speak other language at home 111 69.4% Speak English very well49 30.6% Speak English less than very well
White (Caucasian) - Speak only English Native:
100.0% (1,077)Foreign-born:
19.8% (4)
White (Caucasian) - Speak another language Native:
1.1% (12)Foreign-born:
73.6% (14)
Black or African American - Speak only English Native:
95.5% (846)Foreign-born:
27.7% (40)
Black or African American - Speak another language Native:
4.3% (38)Foreign-born:
78.9% (115)
Asian - Speak another language Native:
100.0% (45)Foreign-born:
94.7% (38)
Other race - Speak another language Native:
78.4% (42)Foreign-born:
91.5% (10)
Two or more races - Speak only English Native:
88.5% (323)Foreign-born:
53.5% (13)
Two or more races - Speak another language Native:
2.6% (9)Foreign-born:
49.3% (12)
White alone - Speak only English Native:
98.4% (1,073)Foreign-born:
7.4% (2)
White alone - Speak another language Native:
1.6% (17)Foreign-born:
91.1% (25)
Hispanic or Latino - Speak only English Native:
54.6% (49)Foreign-born:
22.8% (3)
Hispanic or Latino - Speak another language Native:
46.4% (42)Foreign-born:
81.5% (12)
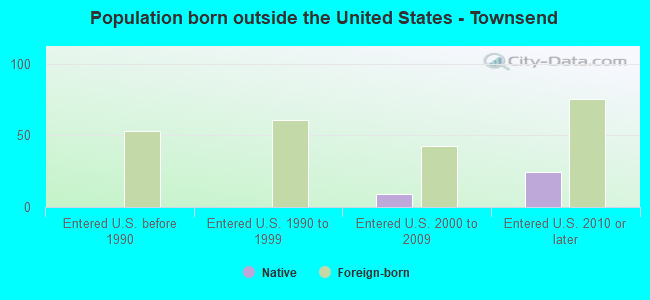
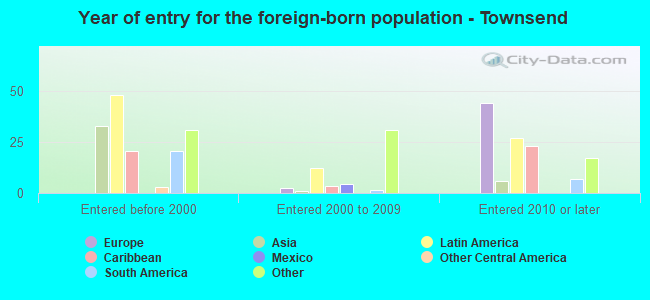
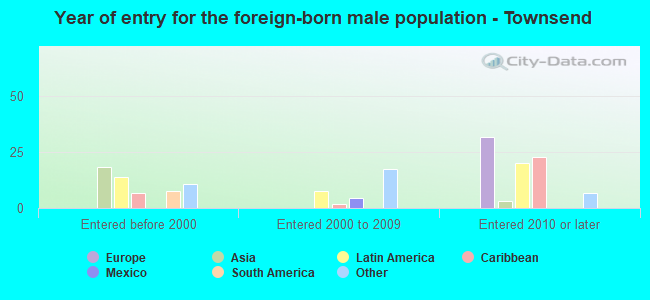
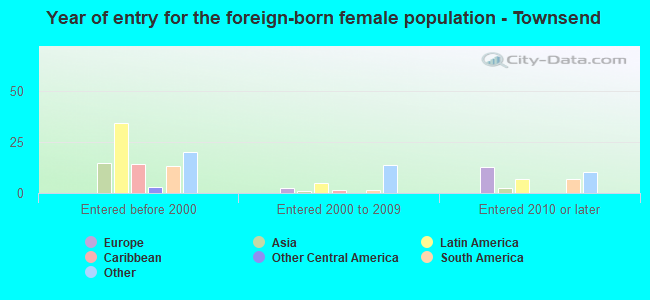
Foreign-born residents in Townsend 228 residents are foreign born (3.1% Latin America , 2.5% Africa , 1.4% Asia , 1.1% Europe ).
This city:
8.3%Delaware:
9.8%
Marital status for residents in Townsend Marital status - White (Caucasian) population 15 years and over
Males 28.5% Never married63.8% Now married0.2% Separated2.5% Widowed5.0% DivorcedFemales 15.7% Never married64.7% Now married0.8% Separated7.6% Widowed11.3% DivorcedWomen who gave birth in the past 12 months Now married:
100.0% (6)Unmarried:
0.0% (0)
Women who did not give birth in the past 12 months Now married:
66.0% (149)Unmarried:
34.0% (77)
Marital status - Black or African American population 15 years and over
Males 36.6% Never married45.9% Now married0.0% Separated0.0% Widowed17.5% DivorcedFemales 43.5% Never married36.4% Now married2.5% Separated4.5% Widowed13.2% DivorcedWomen who gave birth in the past 12 months Now married:
100.0% (19)Unmarried:
0.0% (0)
Women who did not give birth in the past 12 months Now married:
32.4% (99)Unmarried:
67.6% (206)
Marital status - Asian population 15 years and over
Males 14.8% Never married85.2% Now married0.0% Separated0.0% Widowed0.0% DivorcedFemales 5.3% Never married94.7% Now married0.0% Separated0.0% Widowed0.0% DivorcedWomen who did not give birth in the past 12 months Now married:
94.1% (17)Unmarried:
5.9% (1)
Marital status - Other race population 15 years and over
Males 16.0% Never married84.0% Now married0.0% Separated0.0% Widowed0.0% DivorcedFemales 43.8% Never married56.2% Now married0.0% Separated0.0% Widowed0.0% DivorcedWomen who did not give birth in the past 12 months Now married:
56.2% (12)Unmarried:
43.8% (9)
Marital status - Two or more races population 15 years and over
Males 87.0% Never married10.0% Now married0.0% Separated0.0% Widowed3.0% DivorcedFemales 14.6% Never married80.8% Now married1.3% Separated0.0% Widowed3.3% DivorcedWomen who did not give birth in the past 12 months Now married:
82.6% (160)Unmarried:
17.4% (34)
Marital status - White alone, not Hispanic / Latino population 15 years and over
Males 29.3% Never married62.8% Now married0.2% Separated2.6% Widowed5.2% DivorcedFemales 15.8% Never married64.5% Now married0.8% Separated7.6% Widowed11.3% DivorcedWomen who gave birth in the past 12 months Now married:
100.0% (7)Unmarried:
0.0% (0)
Women who did not give birth in the past 12 months Now married:
65.7% (157)Unmarried:
34.3% (82)
Marital status - Hispanic or Latino population 15 years and over
Males 5.1% Never married94.9% Now married0.0% Separated0.0% Widowed0.0% DivorcedFemales 65.0% Never married35.0% Now married0.0% Separated0.0% Widowed0.0% DivorcedWomen who did not give birth in the past 12 months Now married:
35.0% (15)Unmarried:
65.0% (27)
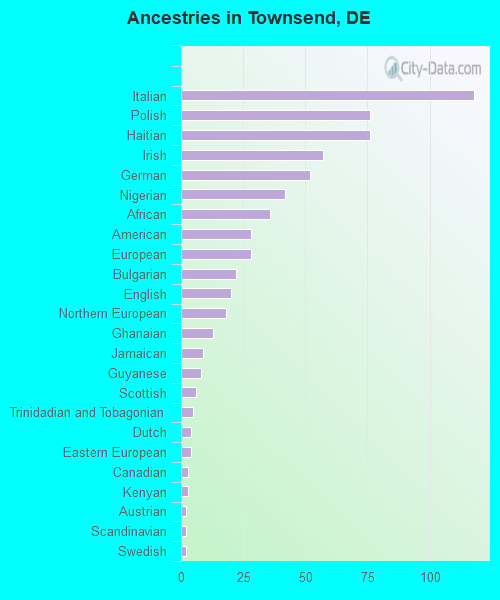
Ancestries in Townsend
118 8.4% Italian76 5.4% Polish76 5.4% Haitian57 4.1% Irish52 3.7% German42 3.0% Nigerian36 2.6% African28 2.0% American28 2.0% European22 1.6% Bulgarian20 1.4% English18 1.3% Northern European13 0.9% Ghanaian9 0.6% Jamaican8 0.6% Guyanese6 0.4% Scottish5 0.4% Trinidadian and Tobagonian4 0.3% Dutch4 0.3% Eastern European3 0.2% Canadian3 0.2% Kenyan2 0.1% Austrian2 0.1% Scandinavian2 0.1% Swedish
Children Nativity (place of birth) in Townsend
Children under 6 years - Living with two parents Both parents native 112 100.0% NativeBoth parents foreign-born 34 100.0% NativeOne native, one foreign-born parent 72 100.0% NativeChildren under 6 years - Living with one parent Native parent 14 100.0% NativeForeign-born parent 10 100.0% NativeChildren 6 to 17 years - Living with two parents Both parents native 348 100.0% NativeBoth parents foreign-born 80 87.4% Native11 12.6% Foreign-bornOne native, one foreign-born parent 28 100.0% NativeChildren 6 to 17 years - Living with one parent Native parent 144 100.0% NativeForeign-born parent 13 53.6% Native12 46.4% Foreign-born
Grandparents responsible for own grandchildren in Townsend
Grandparents (30 to 59 years) Black or African American 39 100.0% Not responsible for grandchildren
Grandparents (60 years and over) Black or African American 34 100.0% Not responsible for grandchildren