Races in Tucson, Arizona (AZ) Detailed Stats
Data:
Races - White alone (%)
Races - White alone (% change since 2000)
Races - Black alone (%)
Races - Black alone (% change since 2000)
Races - American Indian alone (%)
Races - American Indian alone (% change since 2000)
Races - Asian alone (%)
Races - Asian alone (% change since 2000)
Races - Hispanic (%)
Races - Hispanic (% change since 2000)
Races - Native Hawaiian and Other Pacific Islander alone (%)
Races - Native Hawaiian and Other Pacific Islander alone (% change since 2000)
Races - Two or more races(%)
Races - Two or more races(% change since 2000)
Races - Other race alone (%)
Races - Other race alone (% change since 2000)
Racial diversity
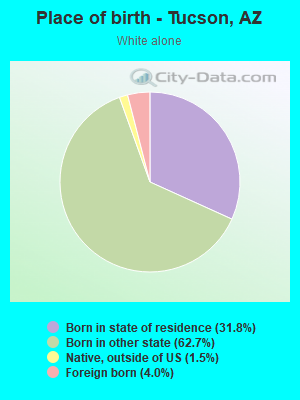
Place of birth - Born in state of residence (%)
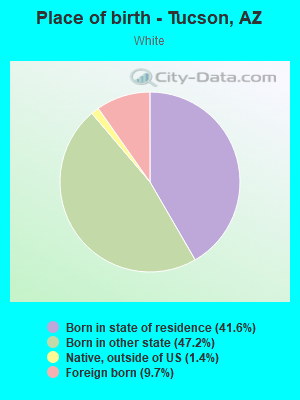
Place of birth - Born in state of residence (%) - White
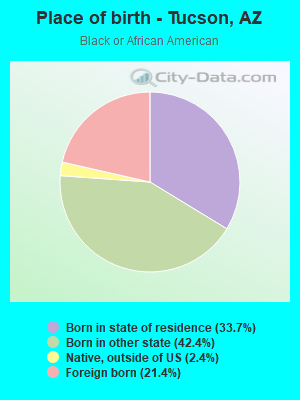
Place of birth - Born in state of residence (%) - Black or African American
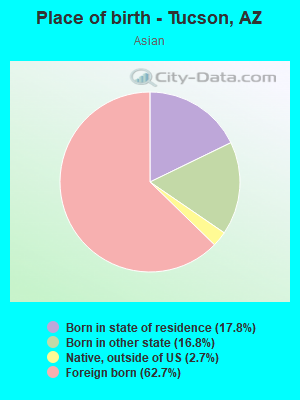
Place of birth - Born in state of residence (%) - Asian
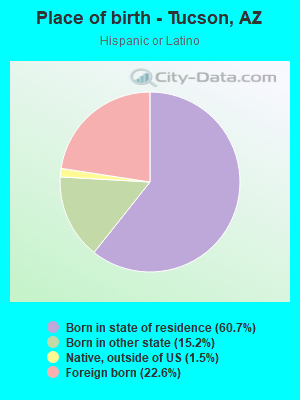
Place of birth - Born in state of residence (%) - Hispanic or Latino
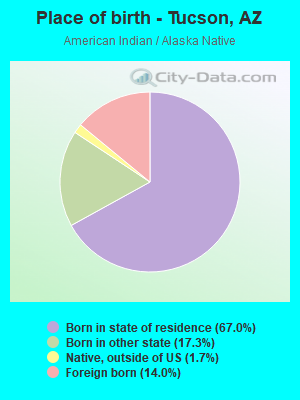
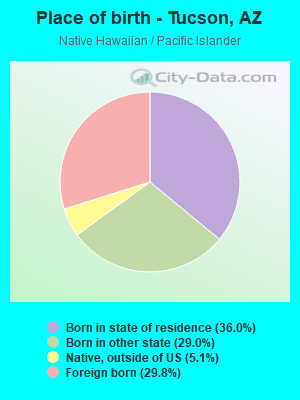
Place of birth - Born in state of residence (%) - American Indian and Alaska Native
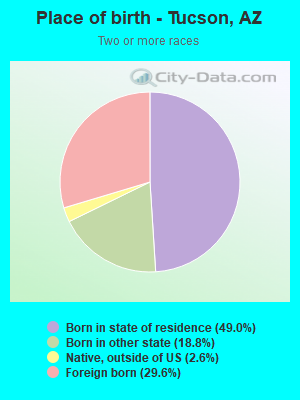
Place of birth - Born in state of residence (%) - Multirace
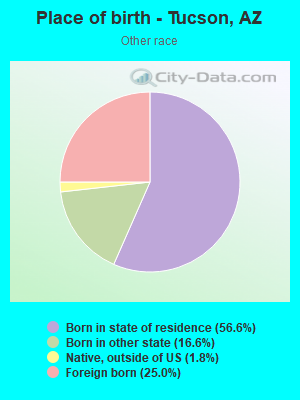
Place of birth - Born in state of residence (%) - Other Race
Place of birth - Born in other state (%)
Place of birth - Born in other state (%) - White
Place of birth - Born in other state (%) - Black or African American
Place of birth - Born in other state (%) - Asian
Place of birth - Born in other state (%) - Hispanic or Latino
Place of birth - Born in other state (%) - American Indian and Alaska Native
Place of birth - Born in other state (%) - Multirace
Place of birth - Born in other state (%) - Other Race
Place of birth - Native, outside of US (%)
Place of birth - Native, outside of US (%) - White
Place of birth - Native, outside of US (%) - Black or African American
Place of birth - Native, outside of US (%) - Asian
Place of birth - Native, outside of US (%) - Hispanic or Latino
Place of birth - Native, outside of US (%) - American Indian and Alaska Native
Place of birth - Native, outside of US (%) - Multirace
Place of birth - Native, outside of US (%) - Other Race
Place of birth - Foreign born (%)
Place of birth - Foreign born (%) - White
Place of birth - Foreign born (%) - Black or African American
Place of birth - Foreign born (%) - Asian
Place of birth - Foreign born (%) - Hispanic or Latino
Place of birth - Foreign born (%) - American Indian and Alaska Native
Place of birth - Foreign born (%) - Multirace
Place of birth - Foreign born (%) - Other Race
Residents speaking English at home (%)
Residents speaking English at home - Born in the United States (%)
Residents speaking English at home - Native, born elsewhere (%)
Residents speaking English at home - Foreign born (%)
Residents speaking Spanish at home (%)
Residents speaking Spanish at home - Born in the United States (%)
Residents speaking Spanish at home - Native, born elsewhere (%)
Residents speaking Spanish at home - Foreign born (%)
Residents speaking other language at home (%)
Residents speaking other language at home - Born in the United States (%)
Residents speaking other language at home - Native, born elsewhere (%)
Residents speaking other language at home - Foreign born (%)
Marital status - Never married (%)
Marital status - Now married (%)
Marital status - Separated (%)
Marital status - Widowed (%)
Marital status - Divorced (%)
Ancestries Reported - Arab (%)
Ancestries Reported - Czech (%)
Ancestries Reported - Danish (%)
Ancestries Reported - Dutch (%)
Ancestries Reported - English (%)
Ancestries Reported - French (%)
Ancestries Reported - French Canadian (%)
Ancestries Reported - German (%)
Ancestries Reported - Greek (%)
Ancestries Reported - Hungarian (%)
Ancestries Reported - Irish (%)
Ancestries Reported - Italian (%)
Ancestries Reported - Lithuanian (%)
Ancestries Reported - Norwegian (%)
Ancestries Reported - Polish (%)
Ancestries Reported - Portuguese (%)
Ancestries Reported - Russian (%)
Ancestries Reported - Scotch-Irish (%)
Ancestries Reported - Scottish (%)
Ancestries Reported - Slovak (%)
Ancestries Reported - Subsaharan African (%)
Ancestries Reported - Swedish (%)
Ancestries Reported - Swiss (%)
Ancestries Reported - Ukrainian (%)
Ancestries Reported - United States (%)
Ancestries Reported - Welsh (%)
Ancestries Reported - West Indian (%)
Ancestries Reported - Other (%)
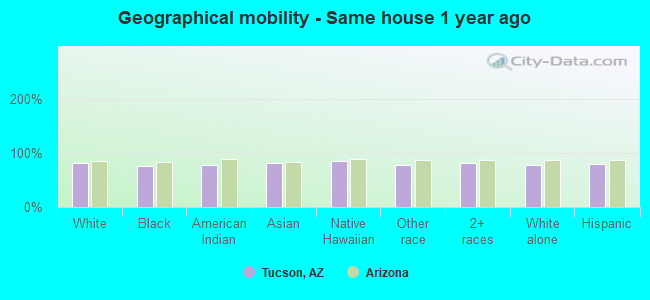
Geographical mobility - Same house 1 year ago (%)
Geographical mobility - Same house 1 year ago (%) - White
Geographical mobility - Same house 1 year ago (%) - Black or African American
Geographical mobility - Same house 1 year ago (%) - Asian
Geographical mobility - Same house 1 year ago (%) - Hispanic or Latino
Geographical mobility - Same house 1 year ago (%) - American Indian and Alaska Native
Geographical mobility - Same house 1 year ago (%) - Multirace
Geographical mobility - Same house 1 year ago (%) - Other Race
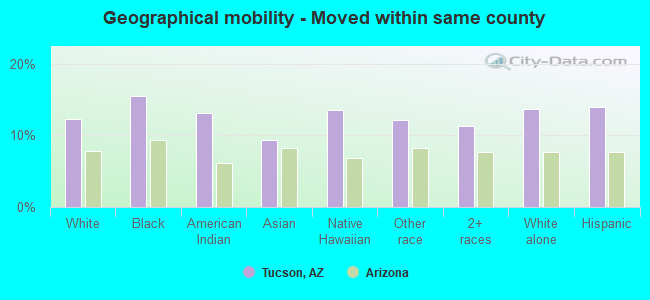
Geographical mobility - Moved within same county (%)
Geographical mobility - Moved within same county (%) - White
Geographical mobility - Moved within same county (%) - Black or African American
Geographical mobility - Moved within same county (%) - Asian
Geographical mobility - Moved within same county (%) - Hispanic or Latino
Geographical mobility - Moved within same county (%) - American Indian and Alaska Native
Geographical mobility - Moved within same county (%) - Multirace
Geographical mobility - Moved within same county (%) - Other Race
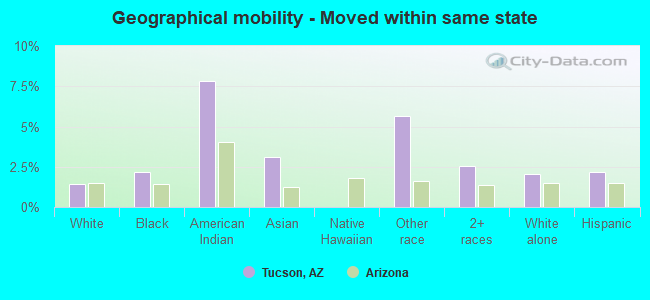
Geographical mobility - Moved from different county within same state (%)
Geographical mobility - Moved from different county within same state (%) - White
Geographical mobility - Moved from different county within same state (%) - Black or African American
Geographical mobility - Moved from different county within same state (%) - Asian
Geographical mobility - Moved from different county within same state (%) - Hispanic or Latino
Geographical mobility - Moved from different county within same state (%) - American Indian and Alaska Native
Geographical mobility - Moved from different county within same state (%) - Multirace
Geographical mobility - Moved from different county within same state (%) - Other Race
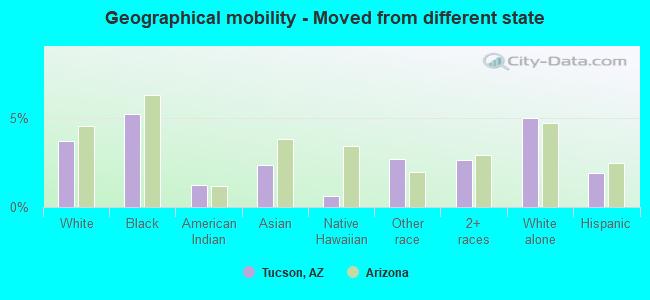
Geographical mobility - Moved from different state (%)
Geographical mobility - Moved from different state (%) - White
Geographical mobility - Moved from different state (%) - Black or African American
Geographical mobility - Moved from different state (%) - Asian
Geographical mobility - Moved from different state (%) - Hispanic or Latino
Geographical mobility - Moved from different state (%) - American Indian and Alaska Native
Geographical mobility - Moved from different state (%) - Multirace
Geographical mobility - Moved from different state (%) - Other Race
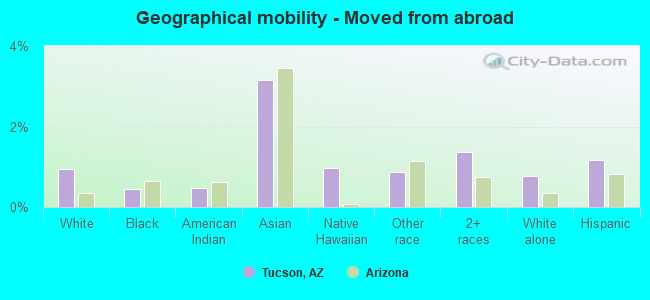
Geographical mobility - Moved from abroad (%)
Geographical mobility - Moved from abroad (%) - White
Geographical mobility - Moved from abroad (%) - Black or African American
Geographical mobility - Moved from abroad (%) - Asian
Geographical mobility - Moved from abroad (%) - Hispanic or Latino
Geographical mobility - Moved from abroad (%) - American Indian and Alaska Native
Geographical mobility - Moved from abroad (%) - Multirace
Geographical mobility - Moved from abroad (%) - Other Race
Place of birth for the foreign-born population - Ireland (%)
Place of birth for the foreign-born population - Denmark (%)
Place of birth for the foreign-born population - Norway (%)
Place of birth for the foreign-born population - Sweden (%)
Place of birth for the foreign-born population - United Kingdom (%)
Place of birth for the foreign-born population - England (%)
Place of birth for the foreign-born population - Scotland (%)
Place of birth for the foreign-born population - Other Northern Europe (%)
Place of birth for the foreign-born population - Austria (%)
Place of birth for the foreign-born population - Belgium (%)
Place of birth for the foreign-born population - France (%)
Place of birth for the foreign-born population - Germany (%)
Place of birth for the foreign-born population - Netherlands (%)
Place of birth for the foreign-born population - Switzerland (%)
Place of birth for the foreign-born population - Other Western Europe (%)
Place of birth for the foreign-born population - Greece (%)
Place of birth for the foreign-born population - Italy (%)
Place of birth for the foreign-born population - Portugal (%)
Place of birth for the foreign-born population - Spain (%)
Place of birth for the foreign-born population - Other Southern Europe (%)
Place of birth for the foreign-born population - Albania (%)
Place of birth for the foreign-born population - Belarus (%)
Place of birth for the foreign-born population - Bosnia and Herzegovina (%)
Place of birth for the foreign-born population - Bulgaria (%)
Place of birth for the foreign-born population - Croatia (%)
Place of birth for the foreign-born population - Czechoslovakia (%)
Place of birth for the foreign-born population - Hungary (%)
Place of birth for the foreign-born population - Latvia (%)
Place of birth for the foreign-born population - Lithuania (%)
Place of birth for the foreign-born population - North Macedonia (Macedonia) (%)
Place of birth for the foreign-born population - Moldova (%)
Place of birth for the foreign-born population - Poland (%)
Place of birth for the foreign-born population - Romania (%)
Place of birth for the foreign-born population - Russia (%)
Place of birth for the foreign-born population - Serbia (%)
Place of birth for the foreign-born population - Ukraine (%)
Place of birth for the foreign-born population - Other Eastern Europe (%)
Place of birth for the foreign-born population - China (%)
Place of birth for the foreign-born population - Hong Kong (%)
Place of birth for the foreign-born population - Taiwan (%)
Place of birth for the foreign-born population - Japan (%)
Place of birth for the foreign-born population - Korea (%)
Place of birth for the foreign-born population - Other Eastern Asia (%)
Place of birth for the foreign-born population - Afghanistan (%)
Place of birth for the foreign-born population - Bangladesh (%)
Place of birth for the foreign-born population - India (%)
Place of birth for the foreign-born population - Iran (%)
Place of birth for the foreign-born population - Kazakhstan (%)
Place of birth for the foreign-born population - Nepal (%)
Place of birth for the foreign-born population - Pakistan (%)
Place of birth for the foreign-born population - Sri Lanka (%)
Place of birth for the foreign-born population - Uzbekistan (%)
Place of birth for the foreign-born population - Other South Central Asia (%)
Place of birth for the foreign-born population - Burma (%)
Place of birth for the foreign-born population - Cambodia (%)
Place of birth for the foreign-born population - Indonesia (%)
Place of birth for the foreign-born population - Laos (%)
Place of birth for the foreign-born population - Malaysia (%)
Place of birth for the foreign-born population - Philippines (%)
Place of birth for the foreign-born population - Singapore (%)
Place of birth for the foreign-born population - Thailand (%)
Place of birth for the foreign-born population - Vietnam (%)
Place of birth for the foreign-born population - Other South Eastern Asia (%)
Place of birth for the foreign-born population - Armenia (%)
Place of birth for the foreign-born population - Iraq (%)
Place of birth for the foreign-born population - Israel (%)
Place of birth for the foreign-born population - Jordan (%)
Place of birth for the foreign-born population - Kuwait (%)
Place of birth for the foreign-born population - Lebanon (%)
Place of birth for the foreign-born population - Saudi Arabia (%)
Place of birth for the foreign-born population - Syria (%)
Place of birth for the foreign-born population - Turkey (%)
Place of birth for the foreign-born population - Yemen (%)
Place of birth for the foreign-born population - Other Western Asia (%)
Place of birth for the foreign-born population - Eritrea (%)
Place of birth for the foreign-born population - Ethiopia (%)
Place of birth for the foreign-born population - Kenya (%)
Place of birth for the foreign-born population - Somalia (%)
Place of birth for the foreign-born population - Uganda (%)
Place of birth for the foreign-born population - Zimbabwe (%)
Place of birth for the foreign-born population - Other Eastern Africa (%)
Place of birth for the foreign-born population - Cameroon (%)
Place of birth for the foreign-born population - Congo (%)
Place of birth for the foreign-born population - Democratic Republic of Congo (Zaire) (%)
Place of birth for the foreign-born population - Other Middle Africa (%)
Place of birth for the foreign-born population - Egypt (%)
Place of birth for the foreign-born population - Morocco (%)
Place of birth for the foreign-born population - Sudan (%)
Place of birth for the foreign-born population - Other Northern Africa (%)
Place of birth for the foreign-born population - South Africa (%)
Place of birth for the foreign-born population - Other Southern Africa (%)
Place of birth for the foreign-born population - Cabo Verde (%)
Place of birth for the foreign-born population - Ghana (%)
Place of birth for the foreign-born population - Liberia (%)
Place of birth for the foreign-born population - Nigeria (%)
Place of birth for the foreign-born population - Senegal (%)
Place of birth for the foreign-born population - Sierra Leone (%)
Place of birth for the foreign-born population - Other Western Africa (%)
Place of birth for the foreign-born population - Australia (%)
Place of birth for the foreign-born population - New Zealand (%)
Place of birth for the foreign-born population - Fiji (%)
Place of birth for the foreign-born population - Micronesia (%)
Place of birth for the foreign-born population - Bahamas (%)
Place of birth for the foreign-born population - Barbados (%)
Place of birth for the foreign-born population - Cuba (%)
Place of birth for the foreign-born population - Dominica (%)
Place of birth for the foreign-born population - Dominican Republic (%)
Place of birth for the foreign-born population - Grenada (%)
Place of birth for the foreign-born population - Haiti (%)
Place of birth for the foreign-born population - Jamaica (%)
Place of birth for the foreign-born population - St. Vincent and the Grenadines (%)
Place of birth for the foreign-born population - Trinidad and Tobago (%)
Place of birth for the foreign-born population - West Indies (%)
Place of birth for the foreign-born population - Other Caribbean (%)
Place of birth for the foreign-born population - Belize (%)
Place of birth for the foreign-born population - Costa Rica (%)
Place of birth for the foreign-born population - El Salvador (%)
Place of birth for the foreign-born population - Guatemala (%)
Place of birth for the foreign-born population - Honduras (%)
Place of birth for the foreign-born population - Mexico (%)
Place of birth for the foreign-born population - Nicaragua (%)
Place of birth for the foreign-born population - Panama (%)
Place of birth for the foreign-born population - Other Central America (%)
Place of birth for the foreign-born population - Argentina (%)
Place of birth for the foreign-born population - Bolivia (%)
Place of birth for the foreign-born population - Brazil (%)
Place of birth for the foreign-born population - Chile (%)
Place of birth for the foreign-born population - Colombia (%)
Place of birth for the foreign-born population - Ecuador (%)
Place of birth for the foreign-born population - Guyana (%)
Place of birth for the foreign-born population - Peru (%)
Place of birth for the foreign-born population - Uruguay (%)
Place of birth for the foreign-born population - Venezuela (%)
Place of birth for the foreign-born population - Other South America (%)
Place of birth for the foreign-born population - Canada (%)
Place of birth for the foreign-born population - Other Northern America (%)
Place of birth for the foreign-born population - Other (%)
Latest news about races in Tucson, AZ collected exclusively by city-data.com from local newspapers, TV, and radio stations
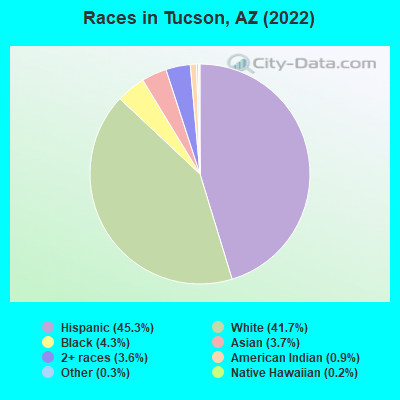
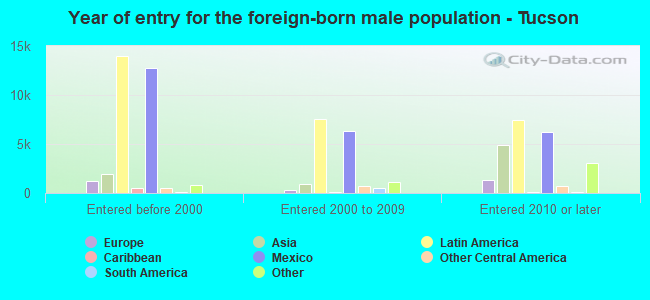
According to 2022 data, the most numerous races in Tucson, AZ are White alone (224,590 residents), Hispanic (258,886 residents), and Black alone (27,572 residents). 67.2% of Tucson residents speak English at home. 15.2% of Tucson, AZ residents are foreign-born (10.3% born in Latin America, 2.7% born in Asia), which is 14.5% greater than the foreign-born rate of 13.0% across the entire state of Arizona.
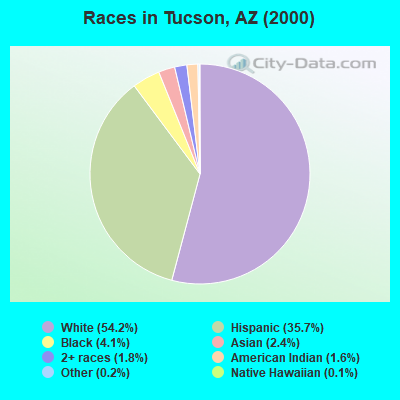
Race distribution in Tucson
2000 2022
263,748 54.2% White alone 173,868 35.7% Hispanic 19,795 4.1% Black alone 11,537 2.4% Asian alone 8,643 1.8% Two or more races 7,732 1.6% American Indian alone 734 0.2% Other race alone 642 0.1% Native Hawaiian and Other
258,886 46.4% Hispanic 224,590 40.3% White alone 27,572 4.9% Black alone 22,384 4.0% Two or more races 17,634 3.2% Asian alone 9,761 1.8% American Indian alone 1,584 0.3% Native Hawaiian and Other 1,283 0.2% Other race alone
2000 2022
3,274,258 63.8% White alone 1,295,617 25.3% Hispanic 233,370 4.5% American Indian alone 149,941 2.9% Black alone 89,315 1.7% Asian alone 76,372 1.5% Two or more races 6,120 0.1% Other race alone 5,639 0.1% Native Hawaiian and Other
3,814,587 51.8% White alone 2,388,520 32.5% Hispanic 322,459 4.4% Black alone 284,994 3.9% Two or more races 257,020 3.5% Asian alone 241,688 3.3% American Indian alone 36,042 0.5% Other race alone 13,887 0.2% Native Hawaiian and Other
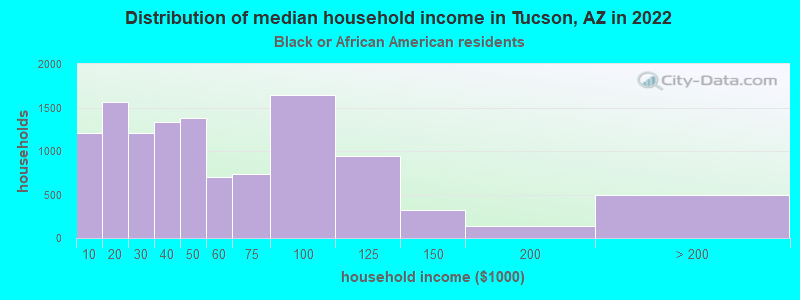
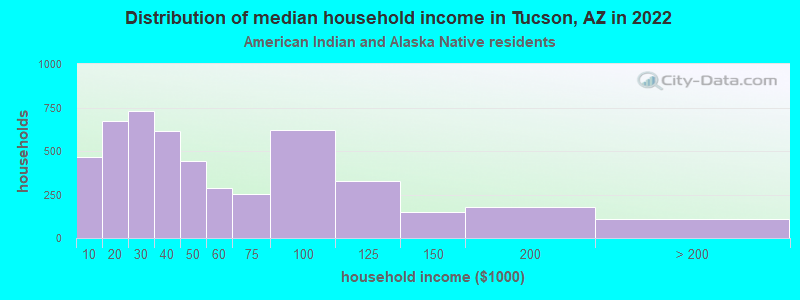
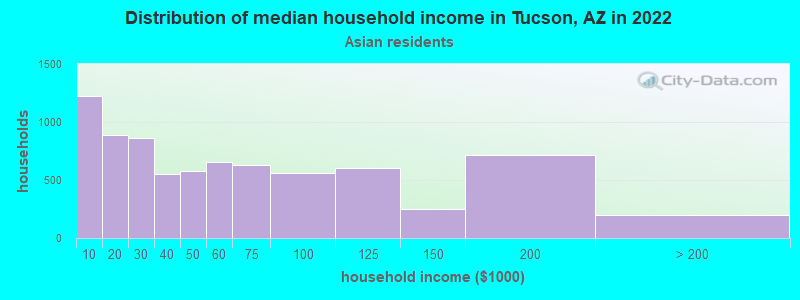
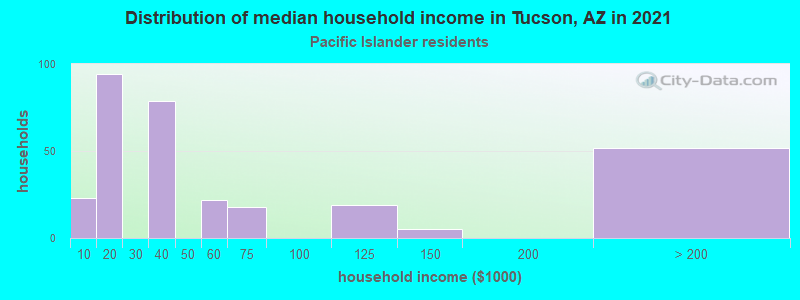
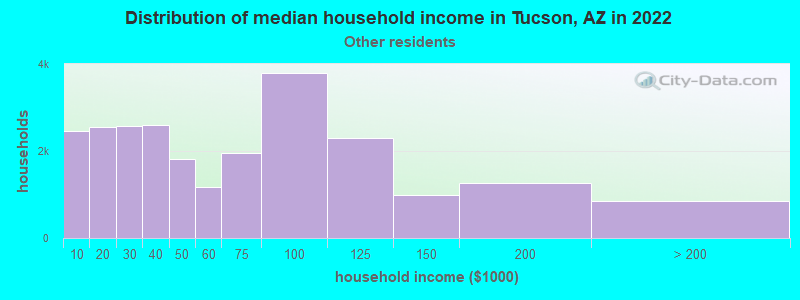
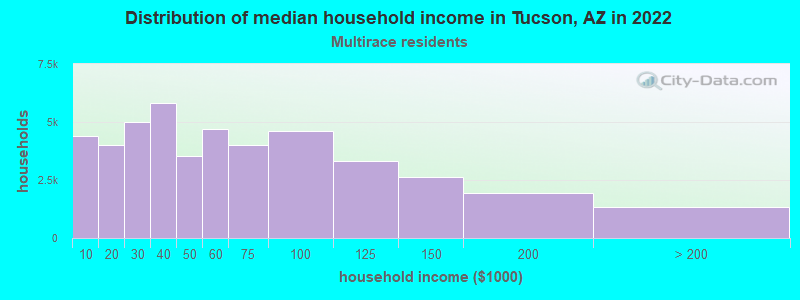
Income and house value in Tucson Median household income in 2022 $58,810 White non-Hispanic householders$47,210 Black householders$52,564 American Indian and Alaska Native householders$58,212 Asian householders$38,903 Native Hawaiian and other Pacific Islander householders$56,662 Some other race householders$50,501 Two or more races householders$53,144 Hispanic or Latino race householdersMedian 2022 house value $381,076 White Non-Hispanic householders$344,625 Black or African American householders$283,506 American Indian or Alaska Native householders $371,503 Asian householders$409,795 Native Hawaiian and other Pacific Islander householders$284,979 Some other race householders$330,266 Two or more races householders$293,079 Hispanic or Latino householders
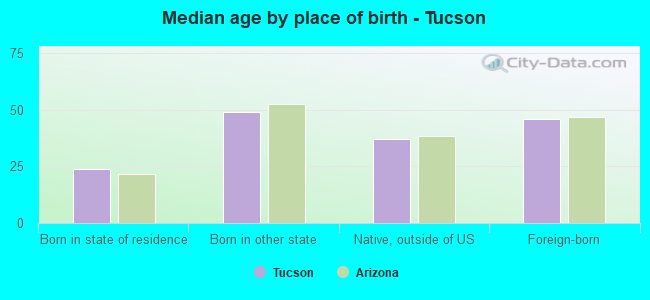
Median age by race in Tucson
39.9 Median age for White residents38.4 41.2 33.3 Median age for Black or African American residents31.7 33.7 29.9 Median age for American Indian / Alaska Native residents26.7 32.3 35.3 Median age for Asian residents32.5 41.0 26.4 Median age for Native Hawaiian / Pacific Islander residents25.8 15.7 32.1 Median age for Other race residents30.8 33.2 29.9 Median age for Two or more races residents30.5 29.5 45.9 Median age for White alone residents44.2 48.3 29.9 Median age for Hispanic or Latino residents29.3 30.8
Owner/renter occupied households by race in Tucson
House owners and renters - White residents 88,705 55.9% Owner occupied69,959 44.1% Renter occupiedHouse owners and renters - Black or African American residents 2,599 27.5% Owner occupied6,865 72.5% Renter occupiedHouse owners and renters - American Indian / Alaska Native residents 2,857 43.3% Owner occupied3,748 56.7% Renter occupiedHouse owners and renters - Asian residents 2,607 37.1% Owner occupied4,418 62.9% Renter occupiedHouse owners and renters - Native Hawaiian / Pacific Islander residents 49 16.8% Owner occupied241 83.2% Renter occupiedHouse owners and renters - Other race residents 8,987 43.9% Owner occupied11,493 56.1% Renter occupiedHouse owners and renters - Two or more races residents 23,491 53.2% Owner occupied20,651 46.8% Renter occupiedHouse owners and renters - White alone residents 65,394 57.3% Owner occupied48,727 42.7% Renter occupiedHouse owners and renters - Hispanic or Latino residents 45,675 49.6% Owner occupied46,387 50.4% Renter occupied
Language usage in Tucson
English speakers - Total 67.2% of residents of Tucson speak English at home.
27.4% of residents speak Spanish at home 98,609 69.2% Speak English very well43,801 30.8% Speak English less than very well5.3% of residents speak other language at home 18,198 66.0% Speak English very well9,370 34.0% Speak English less than very well
English speakers - Born in the United States 88.6% of residents of Tucson speak English at home.
9.5% of residents speak Spanish at home 16,961 85.6% Speak English very well2,850 14.4% Speak English less than very well1.9% of residents speak other language at home 3,371 84.8% Speak English very well603 15.2% Speak English less than very well
English speakers - Native, born elsewhere 66.9% of residents of Tucson speak English at home.
26.7% of residents speak Spanish at home 1,671 69.2% Speak English very well742 30.8% Speak English less than very well6.6% of residents speak other language at home 539 89.8% Speak English very well61 10.2% Speak English less than very well
English speakers - Foreign-born 12.8% of residents of Tucson speak English at home.
63.2% of residents speak Spanish at home 19,631 37.8% Speak English very well32,296 62.2% Speak English less than very well23.4% of residents speak other language at home 11,002 57.3% Speak English very well8,199 42.7% Speak English less than very well
White (Caucasian) - Speak only English Native:
83.5% (247,144)Foreign-born:
16.1% (5,354)
White (Caucasian) - Speak another language Native:
14.4% (42,618)Foreign-born:
80.8% (26,869)
Black or African American - Speak only English Native:
95.1% (21,099)Foreign-born:
18.7% (1,093)
Black or African American - Speak another language Native:
4.9% (1,093)Foreign-born:
80.5% (4,709)
American Indian / Alaska Native - Speak only English Native:
66.6% (10,783)Foreign-born:
0.3% (9)
American Indian / Alaska Native - Speak another language Native:
33.8% (5,463)Foreign-born:
100.0% (2,784)
Asian - Speak only English Native:
65.9% (3,289)Foreign-born:
11.6% (1,440)
Asian - Speak another language Native:
34.2% (1,708)Foreign-born:
87.7% (10,931)
Native Hawaiian / Pacific Islander - Speak only English Native:
91.5% (488)Foreign-born:
8.1% (42)
Native Hawaiian / Pacific Islander - Speak another language Native:
12.6% (67)Foreign-born:
96.0% (501)
Other race - Speak only English Native:
39.2% (17,233)Foreign-born:
6.3% (879)
Other race - Speak another language Native:
59.8% (26,273)Foreign-born:
93.2% (13,084)
Two or more races - Speak only English Native:
60.0% (51,961)Foreign-born:
1.6% (766)
Two or more races - Speak another language Native:
49.5% (42,799)Foreign-born:
100.0% (46,692)
White alone - Speak only English Native:
96.4% (200,442)Foreign-born:
37.1% (3,882)
White alone - Speak another language Native:
3.6% (7,494)Foreign-born:
62.7% (6,559)
Hispanic or Latino - Speak only English Native:
50.4% (92,754)Foreign-born:
5.4% (3,106)
Hispanic or Latino - Speak another language Native:
49.6% (91,145)Foreign-born:
94.4% (54,736)
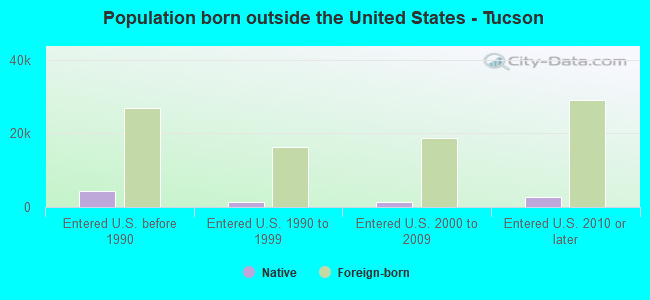
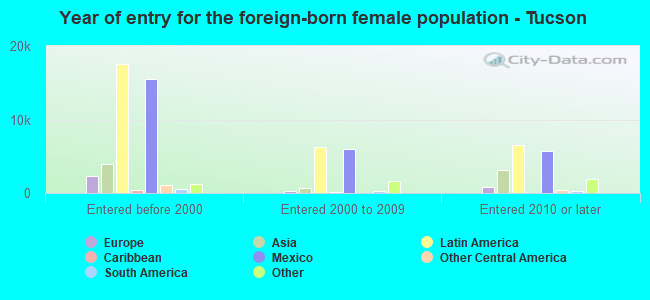
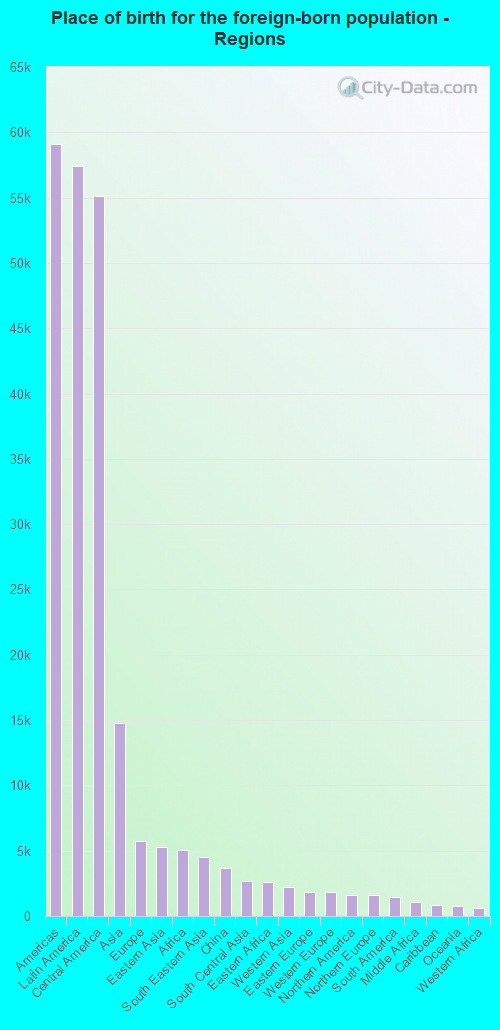
Foreign-born residents in Tucson 85,395 residents are foreign born (10.3% Latin America , 2.7% Asia ).
This city:
15.2%Arizona:
100.0%
Marital status for residents in Tucson Marital status - White (Caucasian) population 15 years and over
Males 44.3% Never married37.2% Now married1.7% Separated2.9% Widowed14.0% DivorcedFemales 35.0% Never married36.5% Now married2.4% Separated9.0% Widowed17.2% DivorcedWomen who gave birth in the past 12 months Now married:
62.5% (2,567)Unmarried:
37.5% (1,543)
Women who did not give birth in the past 12 months Now married:
34.0% (26,338)Unmarried:
66.0% (51,102)
Marital status - Black or African American population 15 years and over
Males 58.8% Never married26.9% Now married1.9% Separated2.2% Widowed10.2% DivorcedFemales 35.4% Never married34.3% Now married2.5% Separated7.5% Widowed20.4% DivorcedWomen who gave birth in the past 12 months Now married:
40.5% (192)Unmarried:
59.5% (282)
Women who did not give birth in the past 12 months Now married:
35.5% (2,011)Unmarried:
64.5% (3,661)
Marital status - American Indian / Alaska Native population 15 years and over
Males 68.8% Never married13.9% Now married1.4% Separated3.9% Widowed12.0% DivorcedFemales 53.1% Never married22.9% Now married3.0% Separated3.4% Widowed17.6% DivorcedWomen who gave birth in the past 12 months Now married:
9.4% (29)Unmarried:
90.6% (284)
Women who did not give birth in the past 12 months Now married:
23.1% (1,284)Unmarried:
76.9% (4,275)
Marital status - Asian population 15 years and over
Males 62.2% Never married26.0% Now married2.2% Separated4.2% Widowed5.5% DivorcedFemales 39.2% Never married41.3% Now married5.3% Separated9.5% Widowed4.8% DivorcedWomen who gave birth in the past 12 months Now married:
92.0% (196)Unmarried:
8.0% (17)
Women who did not give birth in the past 12 months Now married:
40.5% (1,862)Unmarried:
59.5% (2,740)
Marital status - Native Hawaiian / Pacific Islander population 15 years and over
Males 48.6% Never married39.9% Now married0.0% Separated0.0% Widowed11.5% DivorcedFemales 60.2% Never married33.2% Now married0.0% Separated4.5% Widowed2.1% DivorcedWomen who gave birth in the past 12 months Now married:
48.6% (15)Unmarried:
51.4% (16)
Women who did not give birth in the past 12 months Now married:
32.8% (78)Unmarried:
67.2% (159)
Marital status - Other race population 15 years and over
Males 57.1% Never married29.3% Now married0.7% Separated0.9% Widowed11.9% DivorcedFemales 48.0% Never married31.5% Now married1.4% Separated7.3% Widowed11.8% DivorcedWomen who gave birth in the past 12 months Now married:
67.4% (639)Unmarried:
32.6% (310)
Women who did not give birth in the past 12 months Now married:
29.5% (4,545)Unmarried:
70.5% (10,876)
Marital status - Two or more races population 15 years and over
Males 58.4% Never married30.3% Now married1.4% Separated0.0% Widowed10.0% DivorcedFemales 53.8% Never married34.3% Now married0.2% Separated3.5% Widowed8.2% DivorcedWomen who gave birth in the past 12 months Now married:
17.2% (303)Unmarried:
82.8% (1,455)
Women who did not give birth in the past 12 months Now married:
32.0% (13,370)Unmarried:
68.0% (28,426)
Marital status - White alone, not Hispanic / Latino population 15 years and over
Males 42.0% Never married36.9% Now married1.9% Separated3.6% Widowed15.5% DivorcedFemales 30.3% Never married39.1% Now married2.1% Separated9.4% Widowed19.1% DivorcedWomen who gave birth in the past 12 months Now married:
80.3% (2,045)Unmarried:
19.7% (503)
Women who did not give birth in the past 12 months Now married:
35.7% (16,218)Unmarried:
64.3% (29,178)
Marital status - Hispanic or Latino population 15 years and over
Males 50.9% Never married34.9% Now married1.3% Separated1.4% Widowed11.5% DivorcedFemales 44.8% Never married31.9% Now married2.4% Separated7.5% Widowed13.4% DivorcedWomen who gave birth in the past 12 months Now married:
43.4% (1,521)Unmarried:
56.6% (1,981)
Women who did not give birth in the past 12 months Now married:
30.9% (21,728)Unmarried:
69.1% (48,512)
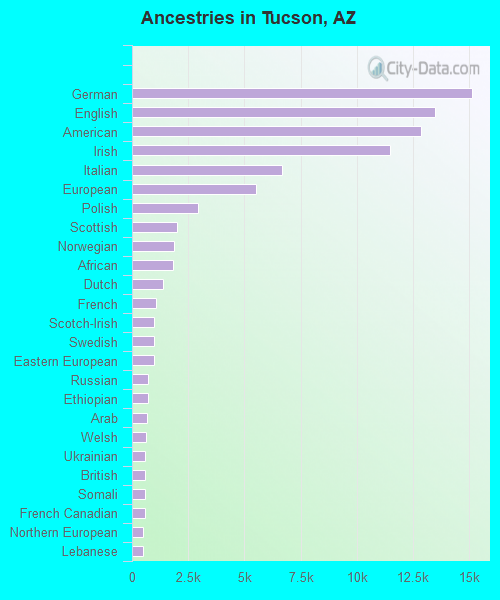
Ancestries in Tucson
13,332 4.5% German12,424 4.2% American10,590 3.6% Irish9,823 3.3% English7,980 2.7% European6,075 2.1% Italian2,486 0.8% Polish1,956 0.7% Scottish1,698 0.6% African1,479 0.5% Norwegian1,250 0.4% Scotch-Irish1,225 0.4% British1,111 0.4% Dutch1,040 0.4% French960 0.3% Eastern European872 0.3% Swedish854 0.3% French Canadian778 0.3% Russian755 0.3% Somali636 0.2% Northern European635 0.2% Scandinavian525 0.2% Greek503 0.2% Welsh445 0.2% Danish422 0.1% Iranian407 0.1% Egyptian373 0.1% Czech356 0.1% Iraqi351 0.1% Hungarian335 0.1% Jamaican335 0.1% Lithuanian333 0.1% Ukrainian332 0.1% Arab313 0.1% Romanian310 0.1% Afghan286 0.10% Portuguese264 0.09% Finnish256 0.09% Canadian251 0.09% Kenyan217 0.07% Austrian213 0.07% Ethiopian202 0.07% Armenian200 0.07% Croatian197 0.07% Lebanese194 0.07% Czechoslovakian193 0.07% West Indian173 0.06% Yugoslavian172 0.06% Sudanese154 0.05% Syrian131 0.04% Nigerian113 0.04% Swiss101 0.03% Serbian97 0.03% Slavic93 0.03% Celtic82 0.03% Turkish79 0.03% Pennsylvania German70 0.02% Australian58 0.02% Belgian54 0.02% Basque50 0.02% Jordanian41 0.01% Cajun39 0.01% Trinidadian and Tobagonian36 0.01% Haitian31 0.01% Slovak30 0.01% Icelander27 0.01% Slovene26 0.01% Brazilian23 0.01% Palestinian20 0.01% Zimbabwean16 0.01% Assyrian15 0.01% Guyanese15 0.01% Moroccan
Geographical mobility in Tucson Same house 1 year ago 278,191 81.0% White (Caucasian)22,154 75.9% Black or African American14,760 76.6% American Indian / Alaska Native14,642 81.9% Asian952 85.2% Native Hawaiian / Pacific Islander47,038 78.3% Other race85,464 80.4% Two or more races179,771 77.4% White alone, not Hispanic / Latino192,799 79.6% Hispanic or LatinoMoved within same county 42,257 12.3% White / Caucasian4,529 15.5% Black or African American2,524 13.1% American Indian / Alaska Native1,679 9.4% Asian152 13.6% Native Hawaiian / Pacific Islander7,318 12.2% Other race12,016 11.3% Two or more races31,732 13.7% White alone, not Hispanic / Latino33,968 14.0% Hispanic or LatinoMoved within same state 4,917 1.4% White / Caucasian643 2.2% Black or African American1,508 7.8% American Indian / Alaska Native550 3.1% Asian3,390 5.6% Other race2,679 2.5% Two or more races4,830 2.1% White alone, not Hispanic / Latino5,263 2.2% Hispanic or LatinoMoved from different state 12,689 3.7% White / Caucasian1,512 5.2% Black or African American239 1.2% American Indian / Alaska Native417 2.3% Asian7 0.6% Native Hawaiian / Pacific Islander1,606 2.7% Other race2,798 2.6% Two or more races11,582 5.0% White alone, not Hispanic / Latino4,613 1.9% Hispanic or LatinoMoved from abroad 3,212 0.9% White129 0.4% Black or African American90 0.5% American Indian / Alaska Native563 3.1% Asian11 1.0% Native Hawaiian / Pacific Islander529 0.9% Other race1,444 1.4% Two or more races1,786 0.8% White alone, not Hispanic / Latino2,804 1.2% Hispanic or Latino
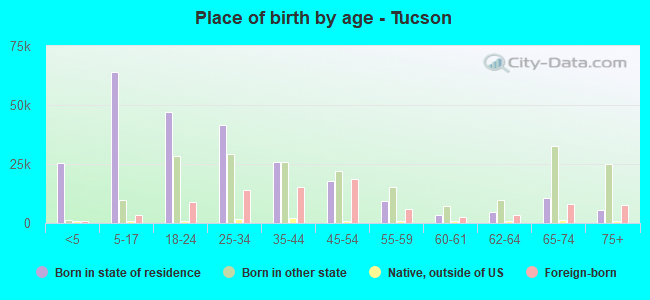
Children Nativity (place of birth) in Tucson
Children under 6 years - Living with two parents Both parents native 10,525 100.0% NativeBoth parents foreign-born 2,402 85.5% Native408 14.5% Foreign-bornOne native, one foreign-born parent 3,942 100.0% NativeChildren under 6 years - Living with one parent Native parent 12,187 100.0% Native2 0.0% Foreign-bornForeign-born parent 2,414 96.4% Native90 3.6% Foreign-bornChildren 6 to 17 years - Living with two parents Both parents native 19,542 100.0% NativeBoth parents foreign-born 5,494 69.2% Native2,443 30.8% Foreign-bornOne native, one foreign-born parent 5,762 100.0% NativeChildren 6 to 17 years - Living with one parent Native parent 27,162 100.0% NativeForeign-born parent 7,237 52.1% Native6,643 47.9% Foreign-born
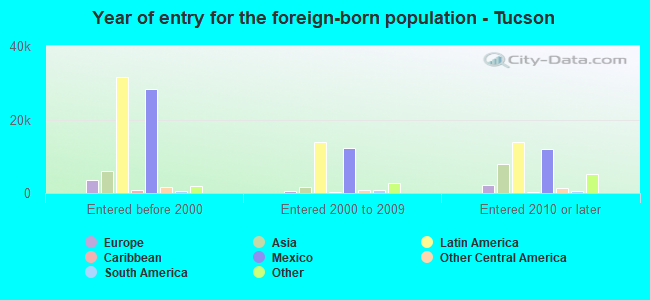
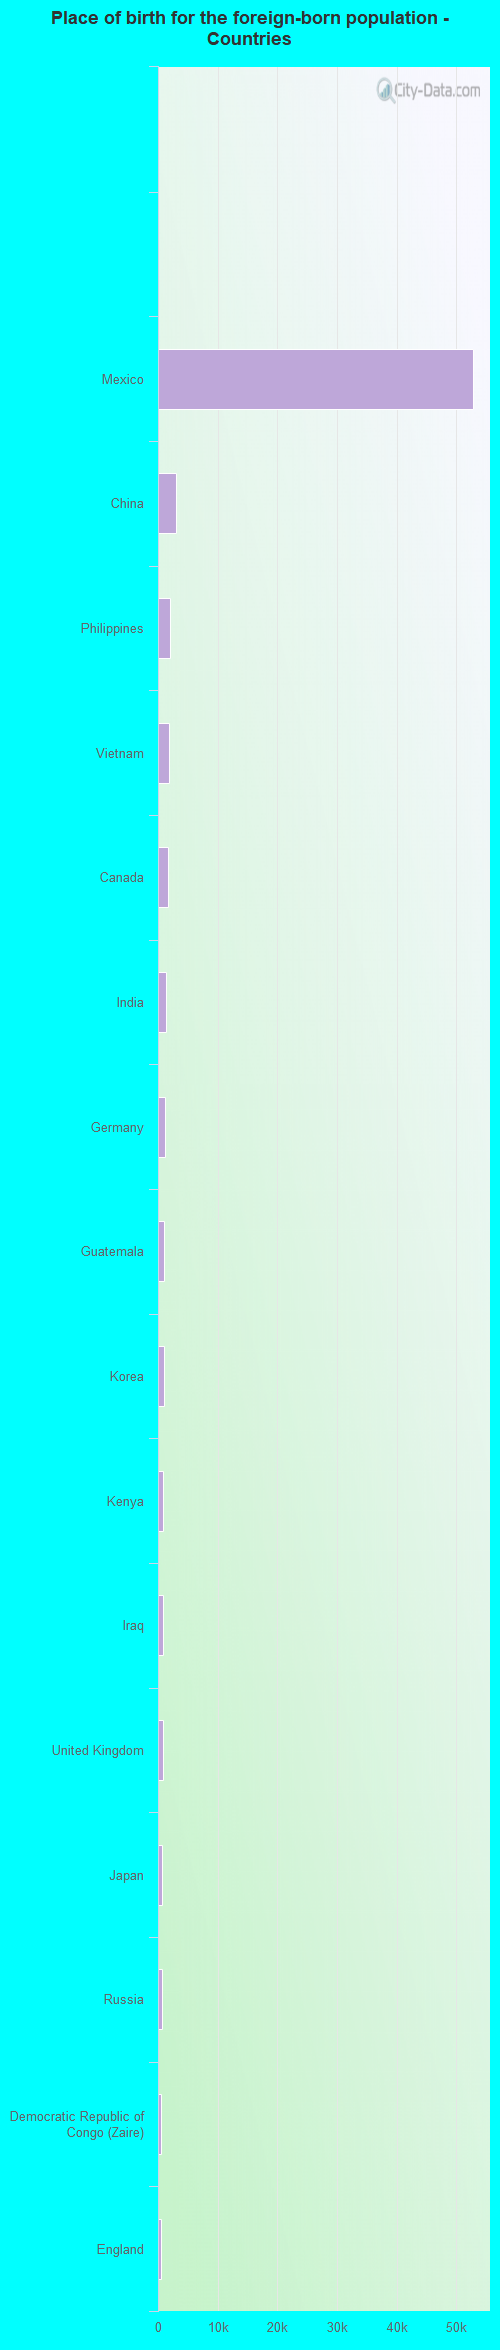
Place of birth for residents in Tucson 59,073 Americas57,457 Latin America55,154 Central America14,806 Asia5,704 Europe5,297 Eastern Asia5,070 Africa4,530 South Eastern Asia3,656 China2,703 South Central Asia2,602 Eastern Africa2,210 Western Asia1,857 Eastern Europe1,812 Western Europe1,615 Northern America1,576 Northern Europe1,487 South America1,107 Middle Africa815 Caribbean741 Oceania614 Western Africa490 Northern Africa453 Southern Europe205 Australia and New Zealand Subregion29 Southern Africa52,850 Mexico3,036 China2,033 Philippines1,774 Vietnam1,604 Canada1,275 India1,120 Germany1,075 Guatemala1,002 Korea911 Kenya862 Iraq770 United Kingdom612 Japan597 Russia578 Democratic Republic of Congo (Zaire)498 England471 Saudi Arabia461 El Salvador412 Somalia387 Nepal377 Colombia370 Syria336 Iran329 Honduras326 Taiwan323 Peru308 Thailand294 Hong Kong290 Cuba290 France240 Nicaragua227 Dominican Republic220 Italy200 Austria196 Egypt195 Sudan187 Afghanistan172 Australia167 Cameroon166 Argentina163 Romania158 Bangladesh158 Bolivia152 Chile148 Congo147 Spain146 Ukraine143 Bosnia and Herzegovina142 Poland141 Israel136 Nigeria134 Brazil131 Ghana131 Sweden127 Micronesia125 Netherlands123 Jamaica118 Malaysia117 Eritrea116 Trinidad and Tobago114 Lithuania112 Indonesia110 Costa Rica109 Laos101 Venezuela94 Pakistan94 Fiji90 Lebanon88 Serbia86 Panama81 Hungary76 Kazakhstan74 Ireland74 Belarus70 Jordan67 Ethiopia66 Liberia65 Greece65 Zimbabwe62 Kuwait61 Czechoslovakia53 Singapore52 Norway50 Morocco49 Belgium47 Turkey47 Latvia37 Croatia34 Senegal34 Ecuador32 New Zealand29 Uganda29 South Africa27 Uzbekistan26 Moldova25 Grenada25 Denmark21 Cambodia20 Portugal19 Guyana18 Armenia16 Bahamas15 Azores Islands15 Scotland13 Uruguay12 Switzerland10 Sri Lanka4 North Macedonia (Macedonia)4 Haiti4 Bulgaria
Grandparents responsible for own grandchildren in Tucson
Grandparents (30 to 59 years) White / Caucasian 1,021 39.8% Responsible for grandchildren1,546 60.2% Not responsible for grandchildrenBlack or African American 63 26.7% Responsible for grandchildren174 73.3% Not responsible for grandchildrenAmerican Indian / Alaska Native 192 35.0% Responsible for grandchildren357 65.0% Not responsible for grandchildrenAsian 12 19.6% Responsible for grandchildren51 80.4% Not responsible for grandchildrenNative Hawaiian / Pacific Islander 18 100.0% Responsible for grandchildrenOther race 539 65.9% Responsible for grandchildren279 34.1% Not responsible for grandchildrenTwo or more races 538 18.6% Responsible for grandchildren2,362 81.4% Not responsible for grandchildrenWhite alone, not Hispanic / Latino 331 30.6% Responsible for grandchildren749 69.4% Not responsible for grandchildrenHispanic or Latino 1,564 48.5% Responsible for grandchildren1,662 51.5% Not responsible for grandchildrenGrandparents (60 years and over) White / Caucasian 1,052 30.7% Responsible for grandchildren2,379 69.3% Not responsible for grandchildrenBlack or African American 96 55.2% Responsible for grandchildren78 44.8% Not responsible for grandchildrenAmerican Indian / Alaska Native 203 52.2% Responsible for grandchildren185 47.8% Not responsible for grandchildrenAsian 63 17.2% Responsible for grandchildren301 82.8% Not responsible for grandchildrenNative Hawaiian / Pacific Islander 44 100.0% Not responsible for grandchildrenOther race 420 31.3% Responsible for grandchildren923 68.7% Not responsible for grandchildrenTwo or more races 327 22.4% Responsible for grandchildren1,131 77.6% Not responsible for grandchildrenWhite alone, not Hispanic / Latino 771 40.7% Responsible for grandchildren1,123 59.3% Not responsible for grandchildrenHispanic or Latino 808 22.7% Responsible for grandchildren2,744 77.3% Not responsible for grandchildren
Zip codes: 85701 , 85706 , 85707 , 85708 , 85710 , 85711 , 85714 , 85719 , 85723, 85724, 85726, 85730 , 85745 .