Races in Vineyard, California (CA) Detailed Stats
Data:
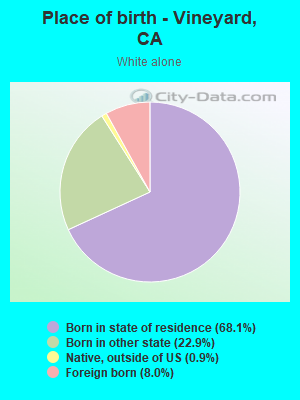
Races - White alone (%)
Races - White alone (% change since 2000)
Races - Black alone (%)
Races - Black alone (% change since 2000)
Races - American Indian alone (%)
Races - American Indian alone (% change since 2000)
Races - Asian alone (%)
Races - Asian alone (% change since 2000)
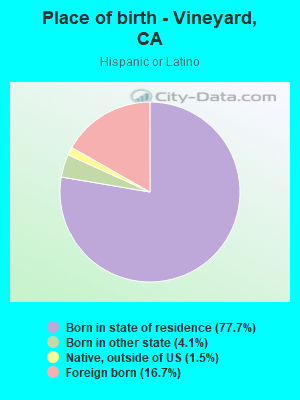
Races - Hispanic (%)
Races - Hispanic (% change since 2000)
Races - Native Hawaiian and Other Pacific Islander alone (%)
Races - Native Hawaiian and Other Pacific Islander alone (% change since 2000)
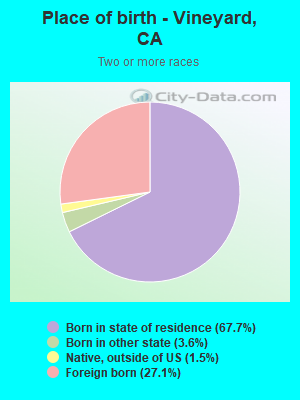
Races - Two or more races(%)
Races - Two or more races(% change since 2000)
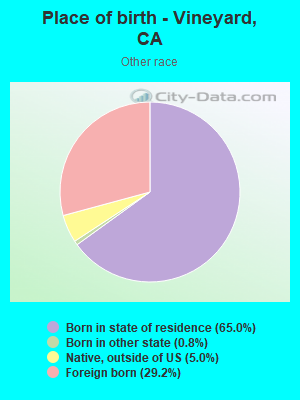
Races - Other race alone (%)
Races - Other race alone (% change since 2000)
Racial diversity
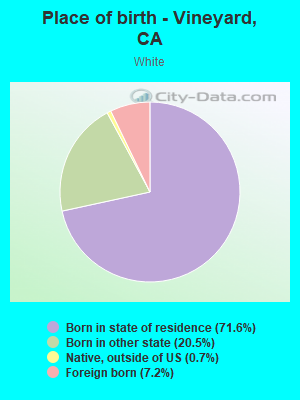
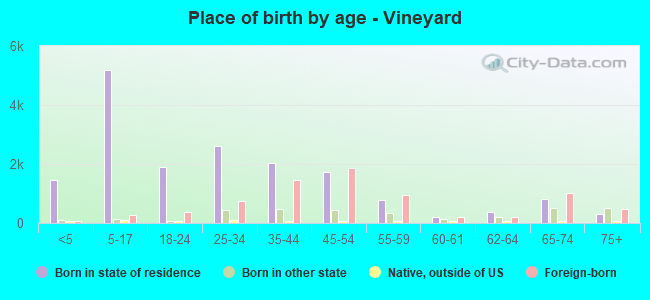
Place of birth - Born in state of residence (%)
Place of birth - Born in state of residence (%) - White
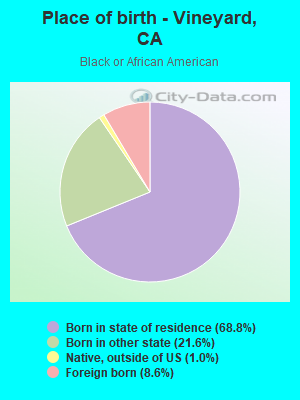
Place of birth - Born in state of residence (%) - Black or African American
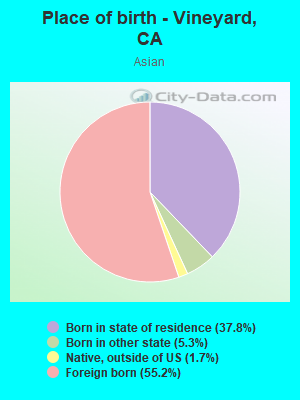
Place of birth - Born in state of residence (%) - Asian
Place of birth - Born in state of residence (%) - Hispanic or Latino
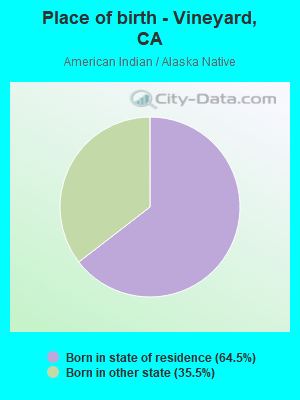
Place of birth - Born in state of residence (%) - American Indian and Alaska Native
Place of birth - Born in state of residence (%) - Multirace
Place of birth - Born in state of residence (%) - Other Race
Place of birth - Born in other state (%)
Place of birth - Born in other state (%) - White
Place of birth - Born in other state (%) - Black or African American
Place of birth - Born in other state (%) - Asian
Place of birth - Born in other state (%) - Hispanic or Latino
Place of birth - Born in other state (%) - American Indian and Alaska Native
Place of birth - Born in other state (%) - Multirace
Place of birth - Born in other state (%) - Other Race
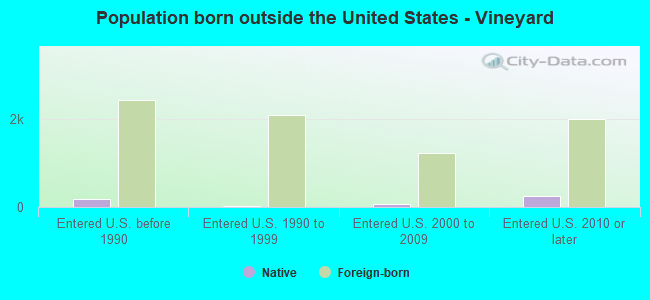
Place of birth - Native, outside of US (%)
Place of birth - Native, outside of US (%) - White
Place of birth - Native, outside of US (%) - Black or African American
Place of birth - Native, outside of US (%) - Asian
Place of birth - Native, outside of US (%) - Hispanic or Latino
Place of birth - Native, outside of US (%) - American Indian and Alaska Native
Place of birth - Native, outside of US (%) - Multirace
Place of birth - Native, outside of US (%) - Other Race
Place of birth - Foreign born (%)
Place of birth - Foreign born (%) - White
Place of birth - Foreign born (%) - Black or African American
Place of birth - Foreign born (%) - Asian
Place of birth - Foreign born (%) - Hispanic or Latino
Place of birth - Foreign born (%) - American Indian and Alaska Native
Place of birth - Foreign born (%) - Multirace
Place of birth - Foreign born (%) - Other Race
Residents speaking English at home (%)
Residents speaking English at home - Born in the United States (%)
Residents speaking English at home - Native, born elsewhere (%)
Residents speaking English at home - Foreign born (%)
Residents speaking Spanish at home (%)
Residents speaking Spanish at home - Born in the United States (%)
Residents speaking Spanish at home - Native, born elsewhere (%)
Residents speaking Spanish at home - Foreign born (%)
Residents speaking other language at home (%)
Residents speaking other language at home - Born in the United States (%)
Residents speaking other language at home - Native, born elsewhere (%)
Residents speaking other language at home - Foreign born (%)
Marital status - Never married (%)
Marital status - Now married (%)
Marital status - Separated (%)
Marital status - Widowed (%)
Marital status - Divorced (%)
Ancestries Reported - Arab (%)
Ancestries Reported - Czech (%)
Ancestries Reported - Danish (%)
Ancestries Reported - Dutch (%)
Ancestries Reported - English (%)
Ancestries Reported - French (%)
Ancestries Reported - French Canadian (%)
Ancestries Reported - German (%)
Ancestries Reported - Greek (%)
Ancestries Reported - Hungarian (%)
Ancestries Reported - Irish (%)
Ancestries Reported - Italian (%)
Ancestries Reported - Lithuanian (%)
Ancestries Reported - Norwegian (%)
Ancestries Reported - Polish (%)
Ancestries Reported - Portuguese (%)
Ancestries Reported - Russian (%)
Ancestries Reported - Scotch-Irish (%)
Ancestries Reported - Scottish (%)
Ancestries Reported - Slovak (%)
Ancestries Reported - Subsaharan African (%)
Ancestries Reported - Swedish (%)
Ancestries Reported - Swiss (%)
Ancestries Reported - Ukrainian (%)
Ancestries Reported - United States (%)
Ancestries Reported - Welsh (%)
Ancestries Reported - West Indian (%)
Ancestries Reported - Other (%)
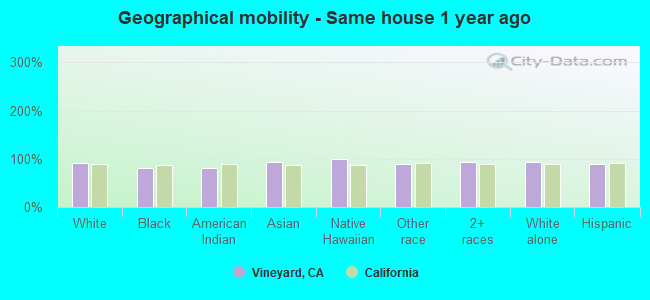
Geographical mobility - Same house 1 year ago (%)
Geographical mobility - Same house 1 year ago (%) - White
Geographical mobility - Same house 1 year ago (%) - Black or African American
Geographical mobility - Same house 1 year ago (%) - Asian
Geographical mobility - Same house 1 year ago (%) - Hispanic or Latino
Geographical mobility - Same house 1 year ago (%) - American Indian and Alaska Native
Geographical mobility - Same house 1 year ago (%) - Multirace
Geographical mobility - Same house 1 year ago (%) - Other Race
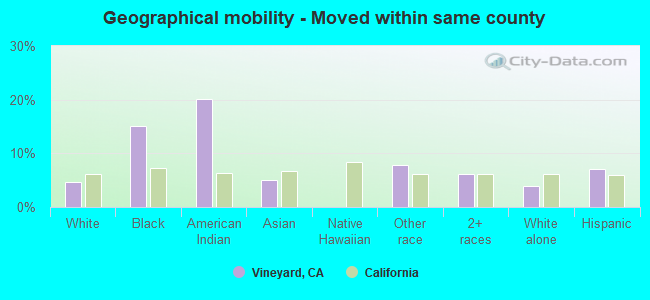
Geographical mobility - Moved within same county (%)
Geographical mobility - Moved within same county (%) - White
Geographical mobility - Moved within same county (%) - Black or African American
Geographical mobility - Moved within same county (%) - Asian
Geographical mobility - Moved within same county (%) - Hispanic or Latino
Geographical mobility - Moved within same county (%) - American Indian and Alaska Native
Geographical mobility - Moved within same county (%) - Multirace
Geographical mobility - Moved within same county (%) - Other Race
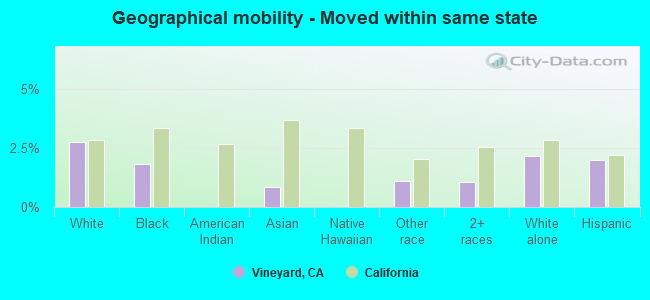
Geographical mobility - Moved from different county within same state (%)
Geographical mobility - Moved from different county within same state (%) - White
Geographical mobility - Moved from different county within same state (%) - Black or African American
Geographical mobility - Moved from different county within same state (%) - Asian
Geographical mobility - Moved from different county within same state (%) - Hispanic or Latino
Geographical mobility - Moved from different county within same state (%) - American Indian and Alaska Native
Geographical mobility - Moved from different county within same state (%) - Multirace
Geographical mobility - Moved from different county within same state (%) - Other Race
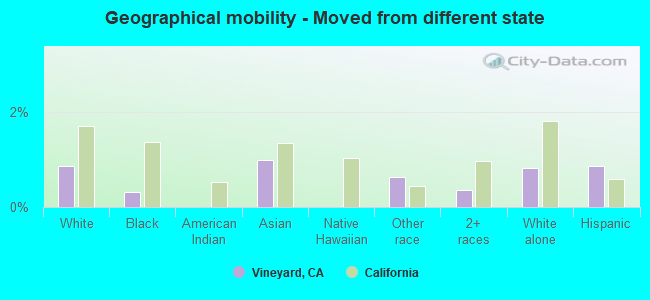
Geographical mobility - Moved from different state (%)
Geographical mobility - Moved from different state (%) - White
Geographical mobility - Moved from different state (%) - Black or African American
Geographical mobility - Moved from different state (%) - Asian
Geographical mobility - Moved from different state (%) - Hispanic or Latino
Geographical mobility - Moved from different state (%) - American Indian and Alaska Native
Geographical mobility - Moved from different state (%) - Multirace
Geographical mobility - Moved from different state (%) - Other Race
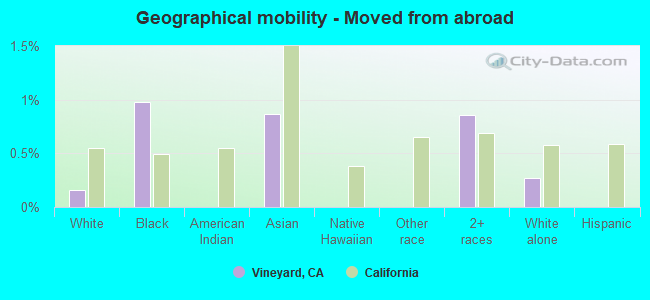
Geographical mobility - Moved from abroad (%)
Geographical mobility - Moved from abroad (%) - White
Geographical mobility - Moved from abroad (%) - Black or African American
Geographical mobility - Moved from abroad (%) - Asian
Geographical mobility - Moved from abroad (%) - Hispanic or Latino
Geographical mobility - Moved from abroad (%) - American Indian and Alaska Native
Geographical mobility - Moved from abroad (%) - Multirace
Geographical mobility - Moved from abroad (%) - Other Race
Place of birth for the foreign-born population - Ireland (%)
Place of birth for the foreign-born population - Denmark (%)
Place of birth for the foreign-born population - Norway (%)
Place of birth for the foreign-born population - Sweden (%)
Place of birth for the foreign-born population - United Kingdom (%)
Place of birth for the foreign-born population - England (%)
Place of birth for the foreign-born population - Scotland (%)
Place of birth for the foreign-born population - Other Northern Europe (%)
Place of birth for the foreign-born population - Austria (%)
Place of birth for the foreign-born population - Belgium (%)
Place of birth for the foreign-born population - France (%)
Place of birth for the foreign-born population - Germany (%)
Place of birth for the foreign-born population - Netherlands (%)
Place of birth for the foreign-born population - Switzerland (%)
Place of birth for the foreign-born population - Other Western Europe (%)
Place of birth for the foreign-born population - Greece (%)
Place of birth for the foreign-born population - Italy (%)
Place of birth for the foreign-born population - Portugal (%)
Place of birth for the foreign-born population - Spain (%)
Place of birth for the foreign-born population - Other Southern Europe (%)
Place of birth for the foreign-born population - Albania (%)
Place of birth for the foreign-born population - Belarus (%)
Place of birth for the foreign-born population - Bosnia and Herzegovina (%)
Place of birth for the foreign-born population - Bulgaria (%)
Place of birth for the foreign-born population - Croatia (%)
Place of birth for the foreign-born population - Czechoslovakia (%)
Place of birth for the foreign-born population - Hungary (%)
Place of birth for the foreign-born population - Latvia (%)
Place of birth for the foreign-born population - Lithuania (%)
Place of birth for the foreign-born population - North Macedonia (Macedonia) (%)
Place of birth for the foreign-born population - Moldova (%)
Place of birth for the foreign-born population - Poland (%)
Place of birth for the foreign-born population - Romania (%)
Place of birth for the foreign-born population - Russia (%)
Place of birth for the foreign-born population - Serbia (%)
Place of birth for the foreign-born population - Ukraine (%)
Place of birth for the foreign-born population - Other Eastern Europe (%)
Place of birth for the foreign-born population - China (%)
Place of birth for the foreign-born population - Hong Kong (%)
Place of birth for the foreign-born population - Taiwan (%)
Place of birth for the foreign-born population - Japan (%)
Place of birth for the foreign-born population - Korea (%)
Place of birth for the foreign-born population - Other Eastern Asia (%)
Place of birth for the foreign-born population - Afghanistan (%)
Place of birth for the foreign-born population - Bangladesh (%)
Place of birth for the foreign-born population - India (%)
Place of birth for the foreign-born population - Iran (%)
Place of birth for the foreign-born population - Kazakhstan (%)
Place of birth for the foreign-born population - Nepal (%)
Place of birth for the foreign-born population - Pakistan (%)
Place of birth for the foreign-born population - Sri Lanka (%)
Place of birth for the foreign-born population - Uzbekistan (%)
Place of birth for the foreign-born population - Other South Central Asia (%)
Place of birth for the foreign-born population - Burma (%)
Place of birth for the foreign-born population - Cambodia (%)
Place of birth for the foreign-born population - Indonesia (%)
Place of birth for the foreign-born population - Laos (%)
Place of birth for the foreign-born population - Malaysia (%)
Place of birth for the foreign-born population - Philippines (%)
Place of birth for the foreign-born population - Singapore (%)
Place of birth for the foreign-born population - Thailand (%)
Place of birth for the foreign-born population - Vietnam (%)
Place of birth for the foreign-born population - Other South Eastern Asia (%)
Place of birth for the foreign-born population - Armenia (%)
Place of birth for the foreign-born population - Iraq (%)
Place of birth for the foreign-born population - Israel (%)
Place of birth for the foreign-born population - Jordan (%)
Place of birth for the foreign-born population - Kuwait (%)
Place of birth for the foreign-born population - Lebanon (%)
Place of birth for the foreign-born population - Saudi Arabia (%)
Place of birth for the foreign-born population - Syria (%)
Place of birth for the foreign-born population - Turkey (%)
Place of birth for the foreign-born population - Yemen (%)
Place of birth for the foreign-born population - Other Western Asia (%)
Place of birth for the foreign-born population - Eritrea (%)
Place of birth for the foreign-born population - Ethiopia (%)
Place of birth for the foreign-born population - Kenya (%)
Place of birth for the foreign-born population - Somalia (%)
Place of birth for the foreign-born population - Uganda (%)
Place of birth for the foreign-born population - Zimbabwe (%)
Place of birth for the foreign-born population - Other Eastern Africa (%)
Place of birth for the foreign-born population - Cameroon (%)
Place of birth for the foreign-born population - Congo (%)
Place of birth for the foreign-born population - Democratic Republic of Congo (Zaire) (%)
Place of birth for the foreign-born population - Other Middle Africa (%)
Place of birth for the foreign-born population - Egypt (%)
Place of birth for the foreign-born population - Morocco (%)
Place of birth for the foreign-born population - Sudan (%)
Place of birth for the foreign-born population - Other Northern Africa (%)
Place of birth for the foreign-born population - South Africa (%)
Place of birth for the foreign-born population - Other Southern Africa (%)
Place of birth for the foreign-born population - Cabo Verde (%)
Place of birth for the foreign-born population - Ghana (%)
Place of birth for the foreign-born population - Liberia (%)
Place of birth for the foreign-born population - Nigeria (%)
Place of birth for the foreign-born population - Senegal (%)
Place of birth for the foreign-born population - Sierra Leone (%)
Place of birth for the foreign-born population - Other Western Africa (%)
Place of birth for the foreign-born population - Australia (%)
Place of birth for the foreign-born population - New Zealand (%)
Place of birth for the foreign-born population - Fiji (%)
Place of birth for the foreign-born population - Micronesia (%)
Place of birth for the foreign-born population - Bahamas (%)
Place of birth for the foreign-born population - Barbados (%)
Place of birth for the foreign-born population - Cuba (%)
Place of birth for the foreign-born population - Dominica (%)
Place of birth for the foreign-born population - Dominican Republic (%)
Place of birth for the foreign-born population - Grenada (%)
Place of birth for the foreign-born population - Haiti (%)
Place of birth for the foreign-born population - Jamaica (%)
Place of birth for the foreign-born population - St. Vincent and the Grenadines (%)
Place of birth for the foreign-born population - Trinidad and Tobago (%)
Place of birth for the foreign-born population - West Indies (%)
Place of birth for the foreign-born population - Other Caribbean (%)
Place of birth for the foreign-born population - Belize (%)
Place of birth for the foreign-born population - Costa Rica (%)
Place of birth for the foreign-born population - El Salvador (%)
Place of birth for the foreign-born population - Guatemala (%)
Place of birth for the foreign-born population - Honduras (%)
Place of birth for the foreign-born population - Mexico (%)
Place of birth for the foreign-born population - Nicaragua (%)
Place of birth for the foreign-born population - Panama (%)
Place of birth for the foreign-born population - Other Central America (%)
Place of birth for the foreign-born population - Argentina (%)
Place of birth for the foreign-born population - Bolivia (%)
Place of birth for the foreign-born population - Brazil (%)
Place of birth for the foreign-born population - Chile (%)
Place of birth for the foreign-born population - Colombia (%)
Place of birth for the foreign-born population - Ecuador (%)
Place of birth for the foreign-born population - Guyana (%)
Place of birth for the foreign-born population - Peru (%)
Place of birth for the foreign-born population - Uruguay (%)
Place of birth for the foreign-born population - Venezuela (%)
Place of birth for the foreign-born population - Other South America (%)
Place of birth for the foreign-born population - Canada (%)
Place of birth for the foreign-born population - Other Northern America (%)
Place of birth for the foreign-born population - Other (%)
Latest news about races in Vineyard, CA collected exclusively by city-data.com from local newspapers, TV, and radio stations
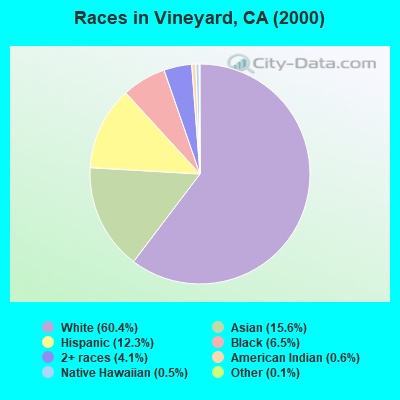
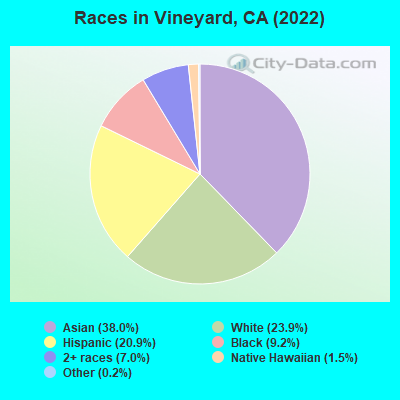
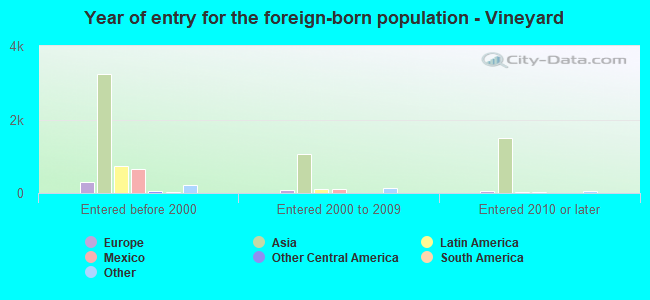
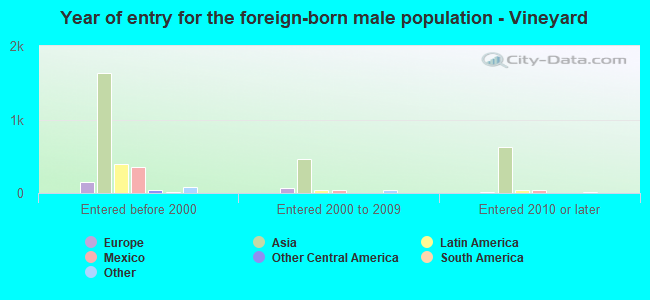
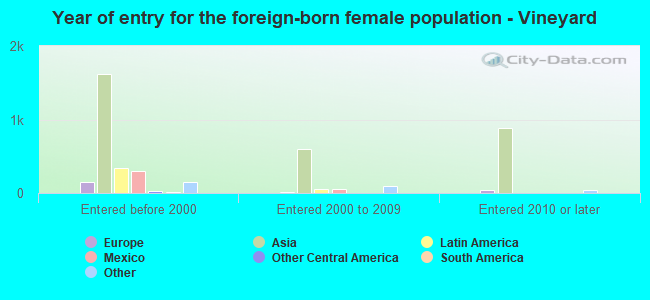
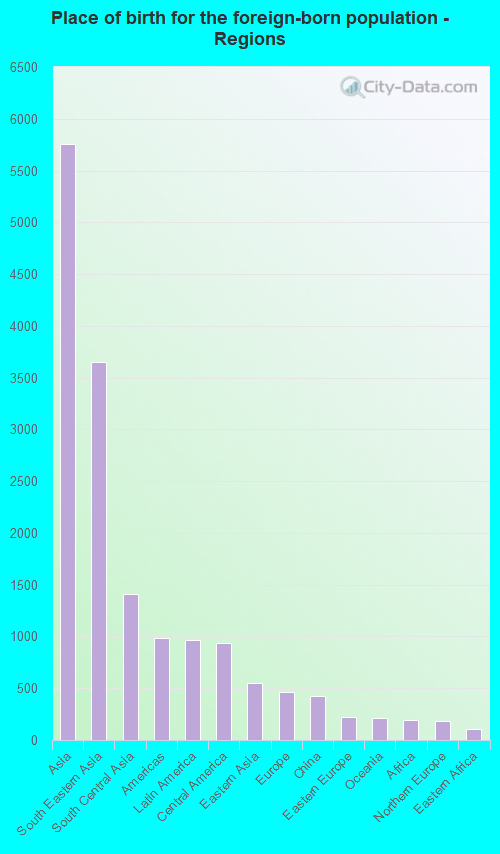
According to 2022 data, the most numerous races in Vineyard, CA are Hispanic (5,601 residents), White alone (8,685 residents), and Asian alone (10,034 residents). 59.6% of Vineyard residents speak English at home. 26.3% of Vineyard, CA residents are foreign-born (20.0% born in Asia, 3.4% born in Latin America), which is about the same as the foreign-born rate of 26.0% across the entire state of California.
Race distribution in Vineyard
2000 2022
15,816,790 46.7% White alone 10,966,556 32.4% Hispanic 3,648,860 10.8% Asian alone 2,181,926 6.4% Black alone 903,115 2.7% Two or more races 178,984 0.5% American Indian alone 103,736 0.3% Native Hawaiian and Other 71,681 0.2% Other race alone
15,732,184 40.3% Hispanic 13,160,426 33.7% White alone 5,957,867 15.3% Asian alone 2,025,218 5.2% Black alone 1,663,222 4.3% Two or more races 251,618 0.6% Other race alone 135,777 0.3% Native Hawaiian and Other 103,030 0.3% American Indian alone
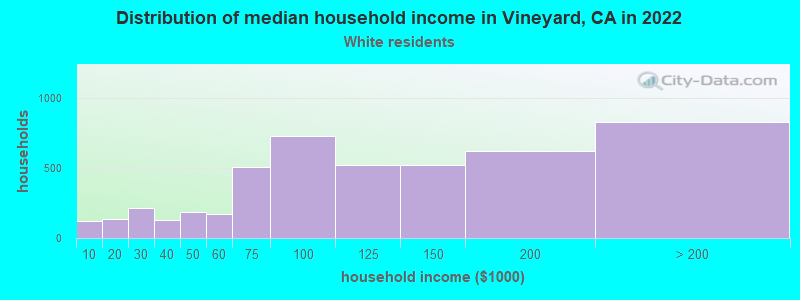
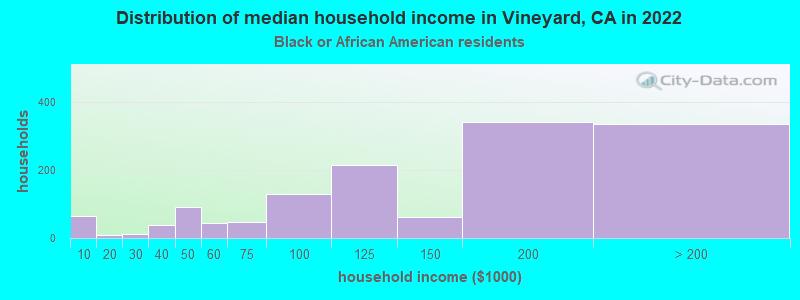
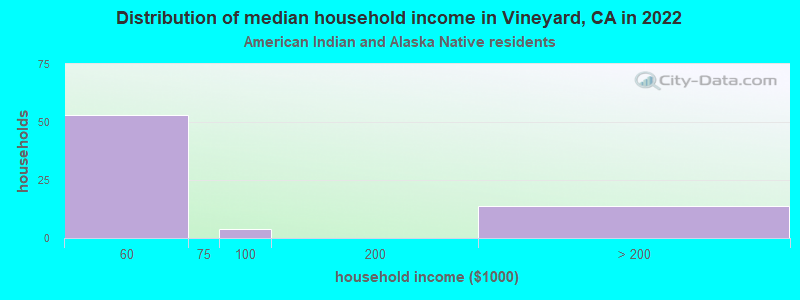
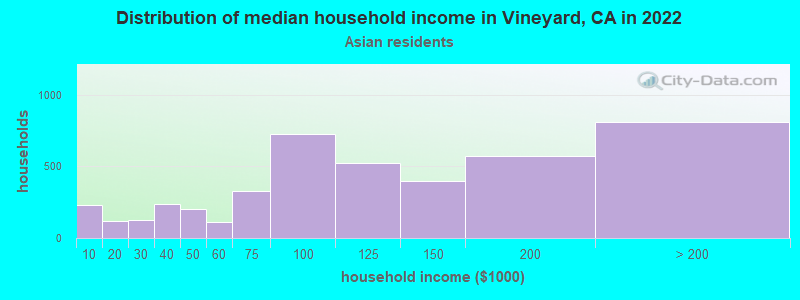
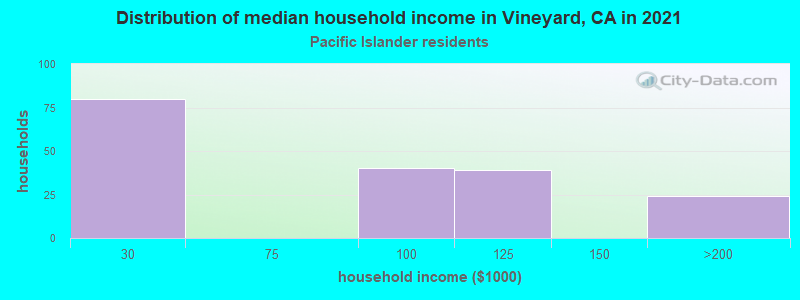
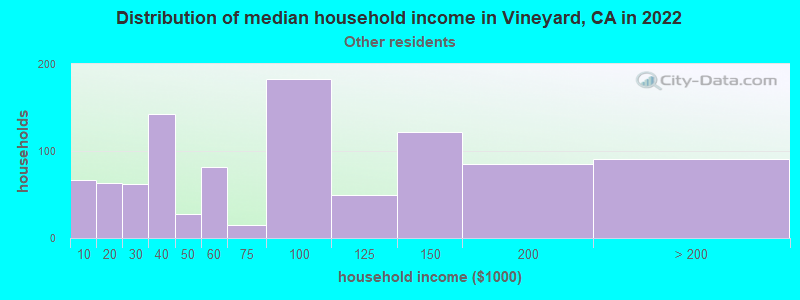
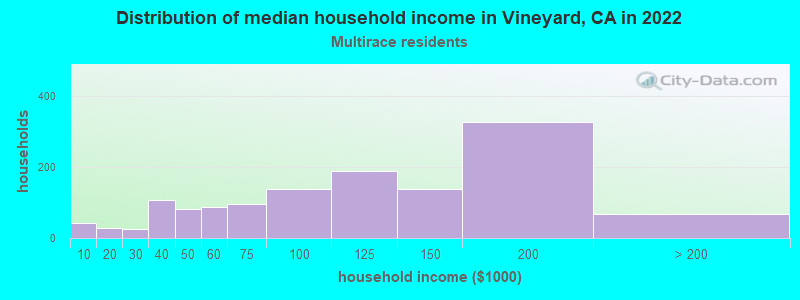
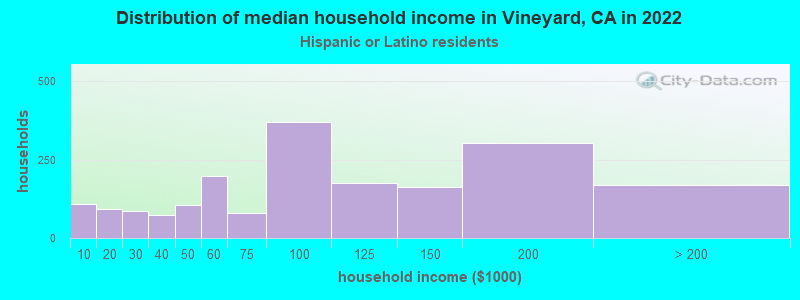
Income and house value in Vineyard Median household income in 2022 $140,013 White non-Hispanic householders$84,445 Black householders$130,469 American Indian and Alaska Native householders$130,714 Asian householders$129,630 Native Hawaiian and other Pacific Islander householders$122,348 Some other race householders$85,026 Two or more races householders$121,430 Hispanic or Latino race householdersMedian 2022 house value $557,890 White Non-Hispanic householders$538,814 Black or African American householders$959,932 American Indian or Alaska Native householders $529,096 Asian householders$501,741 Some other race householders$549,972 Two or more races householders$527,656 Hispanic or Latino householders
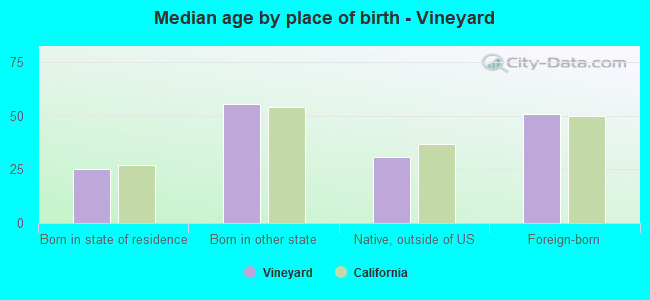
Median age by race in Vineyard
44.4 Median age for White residents44.4 44.5 33.9 Median age for Black or African American residents35.2 33.3 28.7 Median age for American Indian / Alaska Native residents30.4 30.0 37.6 Median age for Asian residents37.5 37.7 37.2 Median age for Native Hawaiian / Pacific Islander residents31.5 38.9 33.0 Median age for Other race residents28.4 36.6 26.7 Median age for Two or more races residents23.2 28.1 46.3 Median age for White alone residents45.6 47.6 27.4 Median age for Hispanic or Latino residents27.7 28.1
Owner/renter occupied households by race in Vineyard
House owners and renters - White residents 3,071 83.9% Owner occupied588 16.1% Renter occupiedHouse owners and renters - Black or African American residents 459 51.0% Owner occupied441 49.0% Renter occupiedHouse owners and renters - American Indian / Alaska Native residents 45 84.9% Owner occupied8 15.1% Renter occupiedHouse owners and renters - Asian residents 2,329 81.5% Owner occupied527 18.5% Renter occupiedHouse owners and renters - Native Hawaiian / Pacific Islander residents 80 87.8% Owner occupied11 12.2% Renter occupiedHouse owners and renters - Other race residents 400 86.6% Owner occupied62 13.4% Renter occupiedHouse owners and renters - Two or more races residents 1,437 72.8% Owner occupied538 27.2% Renter occupiedHouse owners and renters - White alone residents 2,777 84.5% Owner occupied508 15.5% Renter occupiedHouse owners and renters - Hispanic or Latino residents 1,090 78.9% Owner occupied292 21.1% Renter occupied
Language usage in Vineyard
English speakers - Total 59.6% of residents of Vineyard speak English at home.
9.3% of residents speak Spanish at home 1,840 73.5% Speak English very well662 26.5% Speak English less than very well31.6% of residents speak other language at home 4,645 54.9% Speak English very well3,822 45.1% Speak English less than very well
English speakers - Born in the United States 87.2% of residents of Vineyard speak English at home.
3.1% of residents speak Spanish at home 101 91.8% Speak English very well9 8.2% Speak English less than very well10.1% of residents speak other language at home 294 83.1% Speak English very well60 16.9% Speak English less than very well
English speakers - Native, born elsewhere 44.3% of residents of Vineyard speak English at home.
15.7% of residents speak Spanish at home 69 100.0% Speak English very well38.6% of residents speak other language at home 120 70.6% Speak English very well50 29.4% Speak English less than very well
English speakers - Foreign-born 11.1% of residents of Vineyard speak English at home.
11.6% of residents speak Spanish at home 355 41.3% Speak English very well505 58.7% Speak English less than very well78.9% of residents speak other language at home 2,510 42.9% Speak English very well3,339 57.1% Speak English less than very well
White (Caucasian) - Speak only English Native:
96.2% (8,303)Foreign-born:
17.3% (120)
White (Caucasian) - Speak another language Native:
7.2% (622)Foreign-born:
82.3% (572)
Black or African American - Speak only English Native:
97.2% (2,049)Foreign-born:
10.0% (21)
Black or African American - Speak another language Native:
2.6% (54)Foreign-born:
99.9% (211)
Asian - Speak only English Native:
45.2% (1,868)Foreign-born:
12.9% (722)
Asian - Speak another language Native:
54.6% (2,258)Foreign-born:
87.4% (4,883)
Native Hawaiian / Pacific Islander - Speak another language Native:
52.4% (62)Foreign-born:
98.8% (67)
Other race - Speak only English Native:
36.7% (503)Foreign-born:
2.6% (14)
Other race - Speak another language Native:
63.9% (877)Foreign-born:
96.8% (513)
Two or more races - Speak only English Native:
62.3% (3,422)Foreign-born:
2.8% (74)
Two or more races - Speak another language Native:
42.4% (2,329)Foreign-born:
100.0% (2,673)
White alone - Speak only English Native:
94.5% (7,173)Foreign-born:
15.7% (109)
White alone - Speak another language Native:
5.4% (409)Foreign-born:
84.5% (584)
Hispanic or Latino - Speak only English Native:
69.7% (3,120)Foreign-born:
4.6% (41)
Hispanic or Latino - Speak another language Native:
33.1% (1,481)Foreign-born:
95.2% (846)
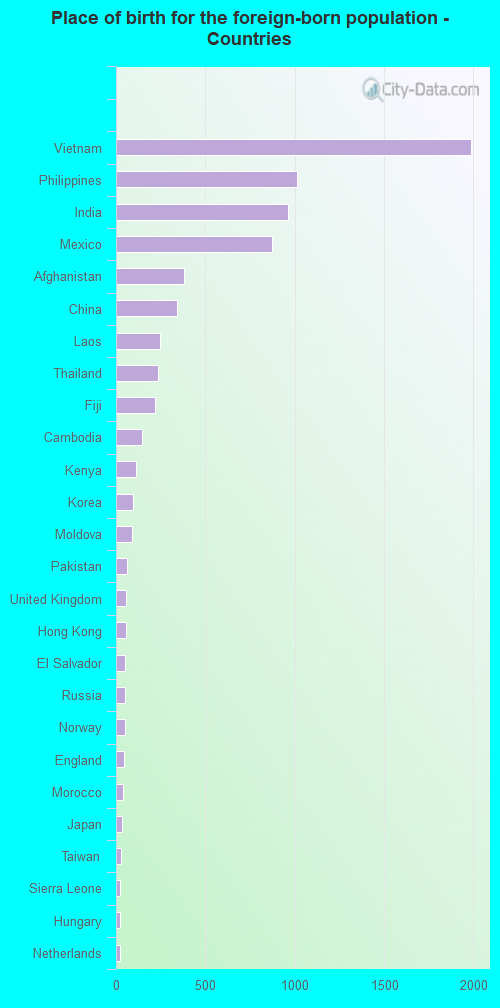
Foreign-born residents in Vineyard 7,615 residents are foreign born (20.0% Asia , 3.4% Latin America ).
This city:
26.3%California:
100.0%
Marital status for residents in Vineyard Marital status - White (Caucasian) population 15 years and over
Males 26.4% Never married65.0% Now married0.6% Separated1.7% Widowed6.3% DivorcedFemales 24.3% Never married55.8% Now married2.2% Separated4.7% Widowed13.0% DivorcedWomen who gave birth in the past 12 months Now married:
100.0% (98)Unmarried:
0.0% (0)
Women who did not give birth in the past 12 months Now married:
50.2% (1,009)Unmarried:
49.8% (1,002)
Marital status - Black or African American population 15 years and over
Males 45.1% Never married42.2% Now married0.0% Separated1.4% Widowed11.3% DivorcedFemales 43.4% Never married29.6% Now married3.7% Separated5.2% Widowed18.2% DivorcedWomen who gave birth in the past 12 months Now married:
61.0% (23)Unmarried:
39.0% (15)
Women who did not give birth in the past 12 months Now married:
28.6% (145)Unmarried:
71.4% (362)
Marital status - American Indian / Alaska Native population 15 years and over
Males 0.0% Never married26.4% Now married0.0% Separated20.8% Widowed52.8% DivorcedFemales 37.0% Never married63.0% Now married0.0% Separated0.0% Widowed0.0% DivorcedWomen who did not give birth in the past 12 months Now married:
56.4% (32)Unmarried:
43.6% (25)
Marital status - Asian population 15 years and over
Males 30.4% Never married60.4% Now married1.7% Separated2.5% Widowed5.1% DivorcedFemales 26.7% Never married58.3% Now married1.3% Separated4.1% Widowed9.5% DivorcedWomen who gave birth in the past 12 months Now married:
100.0% (120)Unmarried:
0.0% (0)
Women who did not give birth in the past 12 months Now married:
52.1% (1,319)Unmarried:
47.9% (1,211)
Marital status - Native Hawaiian / Pacific Islander population 15 years and over
Males 0.0% Never married95.9% Now married0.0% Separated0.0% Widowed4.1% DivorcedFemales 19.1% Never married55.5% Now married0.0% Separated0.0% Widowed25.5% DivorcedWomen who gave birth in the past 12 months Now married:
0.0% (0)Unmarried:
100.0% (27)
Women who did not give birth in the past 12 months Now married:
74.4% (60)Unmarried:
25.6% (20)
Marital status - Other race population 15 years and over
Males 53.2% Never married43.9% Now married0.0% Separated0.0% Widowed3.0% DivorcedFemales 31.9% Never married63.6% Now married0.0% Separated0.0% Widowed4.5% DivorcedWomen who gave birth in the past 12 months Now married:
100.0% (22)Unmarried:
0.0% (0)
Women who did not give birth in the past 12 months Now married:
60.3% (260)Unmarried:
39.7% (172)
Marital status - Two or more races population 15 years and over
Males 46.5% Never married43.1% Now married0.0% Separated0.0% Widowed10.4% DivorcedFemales 46.5% Never married44.0% Now married0.9% Separated4.8% Widowed3.8% DivorcedWomen who gave birth in the past 12 months Now married:
42.2% (62)Unmarried:
57.8% (85)
Women who did not give birth in the past 12 months Now married:
43.2% (923)Unmarried:
56.8% (1,215)
Marital status - White alone, not Hispanic / Latino population 15 years and over
Males 24.3% Never married67.2% Now married0.8% Separated1.8% Widowed5.9% DivorcedFemales 23.7% Never married55.6% Now married2.1% Separated4.4% Widowed14.2% DivorcedWomen who gave birth in the past 12 months Now married:
100.0% (76)Unmarried:
0.0% (0)
Women who did not give birth in the past 12 months Now married:
48.0% (861)Unmarried:
52.0% (932)
Marital status - Hispanic or Latino population 15 years and over
Males 43.2% Never married48.9% Now married0.0% Separated1.4% Widowed6.4% DivorcedFemales 30.4% Never married57.3% Now married2.1% Separated3.6% Widowed6.6% DivorcedWomen who gave birth in the past 12 months Now married:
83.3% (80)Unmarried:
16.7% (16)
Women who did not give birth in the past 12 months Now married:
56.3% (745)Unmarried:
43.7% (578)
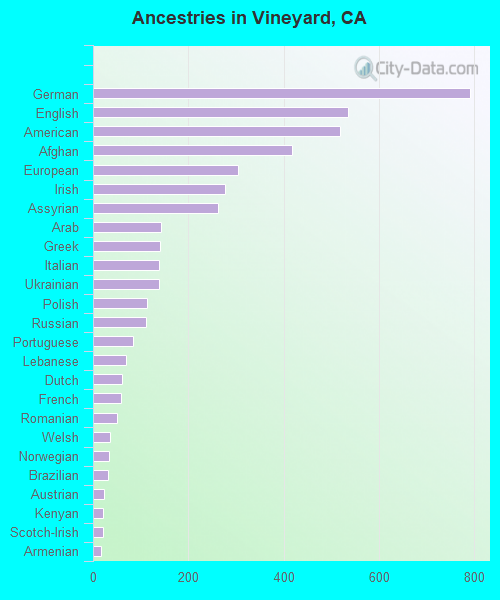
Ancestries in Vineyard
709 4.4% Afghan443 2.8% American377 2.4% German352 2.2% European218 1.4% Irish211 1.3% English188 1.2% Italian178 1.1% African154 1.0% Russian140 0.9% Scandinavian76 0.5% Portuguese74 0.5% Greek68 0.4% Norwegian68 0.4% Romanian62 0.4% Danish58 0.4% French41 0.3% British39 0.2% Polish35 0.2% Czech34 0.2% Arab33 0.2% Lebanese33 0.2% Scotch-Irish31 0.2% Dutch28 0.2% Swiss27 0.2% Hungarian25 0.2% Armenian25 0.2% Eastern European21 0.1% Egyptian21 0.1% Croatian19 0.1% Swedish15 0.09% Ukrainian14 0.09% Serbian14 0.09% French Canadian13 0.08% Scottish12 0.08% Brazilian8 0.05% Northern European7 0.04% Iranian6 0.04% Cape Verdean6 0.04% Lithuanian6 0.04% Finnish4 0.03% Icelander4 0.03% Yugoslavian
Geographical mobility in Vineyard Same house 1 year ago 8,677 92.0% White (Caucasian)1,955 79.9% Black or African American133 80.1% American Indian / Alaska Native9,456 92.9% Asian243 100.0% Native Hawaiian / Pacific Islander1,664 88.6% Other race6,934 92.8% Two or more races8,073 93.4% White alone, not Hispanic / Latino4,774 90.0% Hispanic or LatinoMoved within same county 447 4.7% White / Caucasian371 15.2% Black or African American33 20.1% American Indian / Alaska Native515 5.1% Asian147 7.8% Other race462 6.2% Two or more races338 3.9% White alone, not Hispanic / Latino374 7.1% Hispanic or LatinoMoved within same state 258 2.7% White / Caucasian45 1.8% Black or African American88 0.9% Asian20 1.1% Other race78 1.0% Two or more races188 2.2% White alone, not Hispanic / Latino105 2.0% Hispanic or LatinoMoved from different state 82 0.9% White / Caucasian8 0.3% Black or African American100 1.0% Asian12 0.6% Other race27 0.4% Two or more races72 0.8% White alone, not Hispanic / Latino46 0.9% Hispanic or LatinoMoved from abroad 15 0.2% White24 1.0% Black or African American88 0.9% Asian64 0.9% Two or more races24 0.3% White alone, not Hispanic / Latino
Children Nativity (place of birth) in Vineyard
Children under 6 years - Living with two parents Both parents native 932 100.0% NativeBoth parents foreign-born 493 95.0% Native26 5.0% Foreign-bornOne native, one foreign-born parent 168 100.0% NativeChildren under 6 years - Living with one parent Native parent 280 100.0% NativeForeign-born parent 72 100.0% NativeChildren 6 to 17 years - Living with two parents Both parents native 1,524 100.0% NativeBoth parents foreign-born 1,057 91.6% Native96 8.4% Foreign-bornOne native, one foreign-born parent 916 94.0% Native58 6.0% Foreign-bornChildren 6 to 17 years - Living with one parent Native parent 882 100.0% NativeForeign-born parent 463 54.8% Native382 45.2% Foreign-born
Grandparents responsible for own grandchildren in Vineyard
Grandparents (30 to 59 years) White / Caucasian 42 38.4% Responsible for grandchildren67 61.6% Not responsible for grandchildrenBlack or African American 25 100.0% Responsible for grandchildrenAsian 18 8.7% Responsible for grandchildren185 91.3% Not responsible for grandchildrenNative Hawaiian / Pacific Islander 9 100.0% Responsible for grandchildrenOther race 4 47.5% Responsible for grandchildren5 52.5% Not responsible for grandchildrenTwo or more races 42 38.0% Responsible for grandchildren69 62.0% Not responsible for grandchildrenWhite alone, not Hispanic / Latino 49 40.6% Responsible for grandchildren72 59.4% Not responsible for grandchildrenHispanic or Latino 11 20.8% Responsible for grandchildren41 79.2% Not responsible for grandchildrenGrandparents (60 years and over) White / Caucasian 17 9.6% Responsible for grandchildren158 90.4% Not responsible for grandchildrenBlack or African American 20 67.7% Responsible for grandchildren9 32.3% Not responsible for grandchildrenAsian 9 2.5% Responsible for grandchildren356 97.5% Not responsible for grandchildrenOther race 140 100.0% Not responsible for grandchildrenTwo or more races 56 100.0% Not responsible for grandchildrenWhite alone, not Hispanic / Latino 19 11.3% Responsible for grandchildren148 88.7% Not responsible for grandchildrenHispanic or Latino 186 100.0% Not responsible for grandchildren