Races in Walled Lake, Michigan (MI) Detailed Stats
Data:
Races - White alone (%)
Races - White alone (% change since 2000)
Races - Black alone (%)
Races - Black alone (% change since 2000)
Races - American Indian alone (%)
Races - American Indian alone (% change since 2000)
Races - Asian alone (%)
Races - Asian alone (% change since 2000)
Races - Hispanic (%)
Races - Hispanic (% change since 2000)
Races - Native Hawaiian and Other Pacific Islander alone (%)
Races - Native Hawaiian and Other Pacific Islander alone (% change since 2000)
Races - Two or more races(%)
Races - Two or more races(% change since 2000)
Races - Other race alone (%)
Races - Other race alone (% change since 2000)
Racial diversity
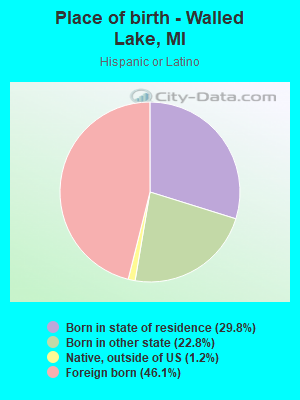
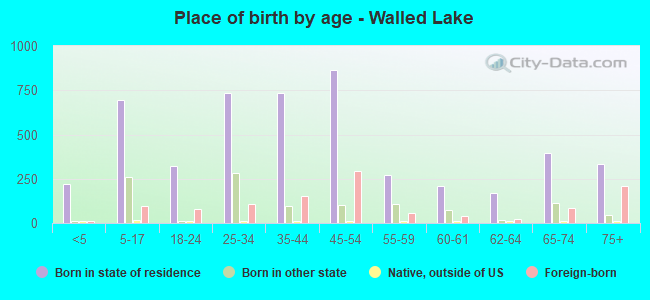
Place of birth - Born in state of residence (%)
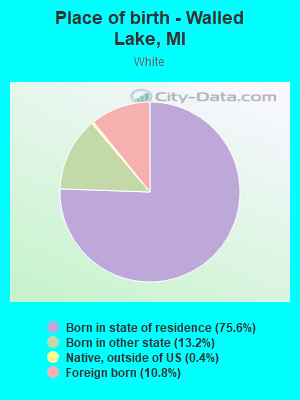
Place of birth - Born in state of residence (%) - White
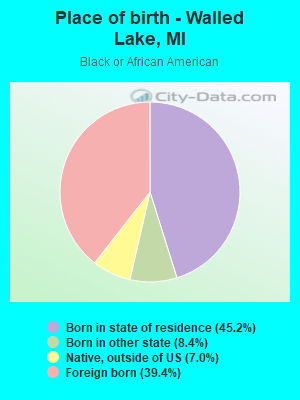
Place of birth - Born in state of residence (%) - Black or African American
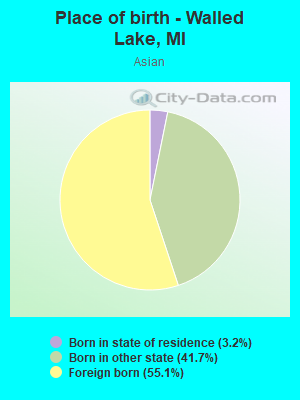
Place of birth - Born in state of residence (%) - Asian
Place of birth - Born in state of residence (%) - Hispanic or Latino
Place of birth - Born in state of residence (%) - American Indian and Alaska Native
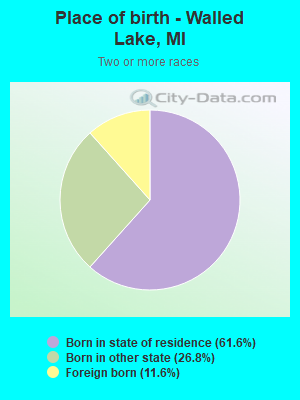
Place of birth - Born in state of residence (%) - Multirace
Place of birth - Born in state of residence (%) - Other Race
Place of birth - Born in other state (%)
Place of birth - Born in other state (%) - White
Place of birth - Born in other state (%) - Black or African American
Place of birth - Born in other state (%) - Asian
Place of birth - Born in other state (%) - Hispanic or Latino
Place of birth - Born in other state (%) - American Indian and Alaska Native
Place of birth - Born in other state (%) - Multirace
Place of birth - Born in other state (%) - Other Race
Place of birth - Native, outside of US (%)
Place of birth - Native, outside of US (%) - White
Place of birth - Native, outside of US (%) - Black or African American
Place of birth - Native, outside of US (%) - Asian
Place of birth - Native, outside of US (%) - Hispanic or Latino
Place of birth - Native, outside of US (%) - American Indian and Alaska Native
Place of birth - Native, outside of US (%) - Multirace
Place of birth - Native, outside of US (%) - Other Race
Place of birth - Foreign born (%)
Place of birth - Foreign born (%) - White
Place of birth - Foreign born (%) - Black or African American
Place of birth - Foreign born (%) - Asian
Place of birth - Foreign born (%) - Hispanic or Latino
Place of birth - Foreign born (%) - American Indian and Alaska Native
Place of birth - Foreign born (%) - Multirace
Place of birth - Foreign born (%) - Other Race
Residents speaking English at home (%)
Residents speaking English at home - Born in the United States (%)
Residents speaking English at home - Native, born elsewhere (%)
Residents speaking English at home - Foreign born (%)
Residents speaking Spanish at home (%)
Residents speaking Spanish at home - Born in the United States (%)
Residents speaking Spanish at home - Native, born elsewhere (%)
Residents speaking Spanish at home - Foreign born (%)
Residents speaking other language at home (%)
Residents speaking other language at home - Born in the United States (%)
Residents speaking other language at home - Native, born elsewhere (%)
Residents speaking other language at home - Foreign born (%)
Marital status - Never married (%)
Marital status - Now married (%)
Marital status - Separated (%)
Marital status - Widowed (%)
Marital status - Divorced (%)
Ancestries Reported - Arab (%)
Ancestries Reported - Czech (%)
Ancestries Reported - Danish (%)
Ancestries Reported - Dutch (%)
Ancestries Reported - English (%)
Ancestries Reported - French (%)
Ancestries Reported - French Canadian (%)
Ancestries Reported - German (%)
Ancestries Reported - Greek (%)
Ancestries Reported - Hungarian (%)
Ancestries Reported - Irish (%)
Ancestries Reported - Italian (%)
Ancestries Reported - Lithuanian (%)
Ancestries Reported - Norwegian (%)
Ancestries Reported - Polish (%)
Ancestries Reported - Portuguese (%)
Ancestries Reported - Russian (%)
Ancestries Reported - Scotch-Irish (%)
Ancestries Reported - Scottish (%)
Ancestries Reported - Slovak (%)
Ancestries Reported - Subsaharan African (%)
Ancestries Reported - Swedish (%)
Ancestries Reported - Swiss (%)
Ancestries Reported - Ukrainian (%)
Ancestries Reported - United States (%)
Ancestries Reported - Welsh (%)
Ancestries Reported - West Indian (%)
Ancestries Reported - Other (%)
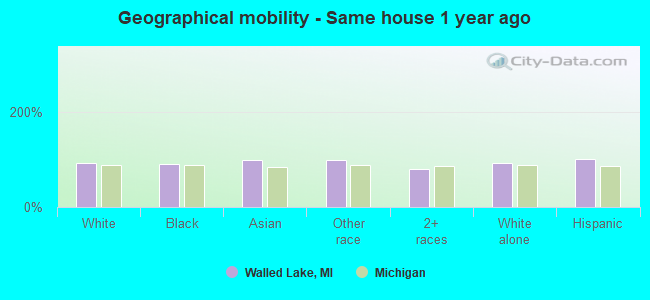
Geographical mobility - Same house 1 year ago (%)
Geographical mobility - Same house 1 year ago (%) - White
Geographical mobility - Same house 1 year ago (%) - Black or African American
Geographical mobility - Same house 1 year ago (%) - Asian
Geographical mobility - Same house 1 year ago (%) - Hispanic or Latino
Geographical mobility - Same house 1 year ago (%) - American Indian and Alaska Native
Geographical mobility - Same house 1 year ago (%) - Multirace
Geographical mobility - Same house 1 year ago (%) - Other Race
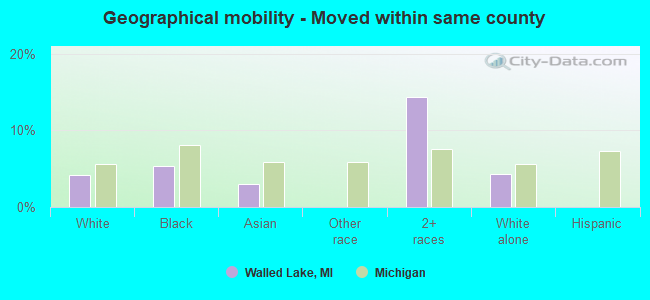
Geographical mobility - Moved within same county (%)
Geographical mobility - Moved within same county (%) - White
Geographical mobility - Moved within same county (%) - Black or African American
Geographical mobility - Moved within same county (%) - Asian
Geographical mobility - Moved within same county (%) - Hispanic or Latino
Geographical mobility - Moved within same county (%) - American Indian and Alaska Native
Geographical mobility - Moved within same county (%) - Multirace
Geographical mobility - Moved within same county (%) - Other Race
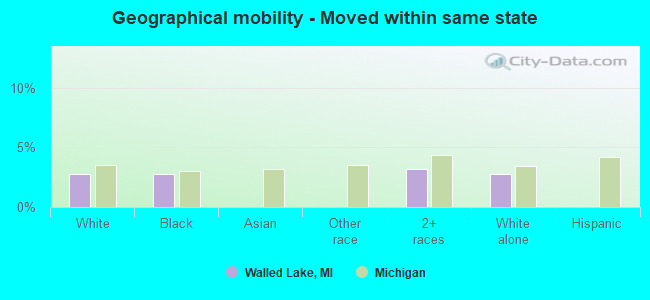
Geographical mobility - Moved from different county within same state (%)
Geographical mobility - Moved from different county within same state (%) - White
Geographical mobility - Moved from different county within same state (%) - Black or African American
Geographical mobility - Moved from different county within same state (%) - Asian
Geographical mobility - Moved from different county within same state (%) - Hispanic or Latino
Geographical mobility - Moved from different county within same state (%) - American Indian and Alaska Native
Geographical mobility - Moved from different county within same state (%) - Multirace
Geographical mobility - Moved from different county within same state (%) - Other Race
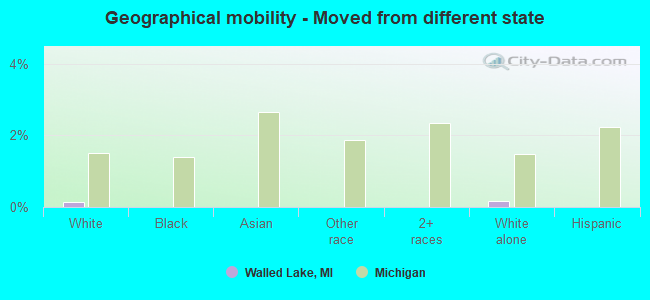
Geographical mobility - Moved from different state (%)
Geographical mobility - Moved from different state (%) - White
Geographical mobility - Moved from different state (%) - Black or African American
Geographical mobility - Moved from different state (%) - Asian
Geographical mobility - Moved from different state (%) - Hispanic or Latino
Geographical mobility - Moved from different state (%) - American Indian and Alaska Native
Geographical mobility - Moved from different state (%) - Multirace
Geographical mobility - Moved from different state (%) - Other Race
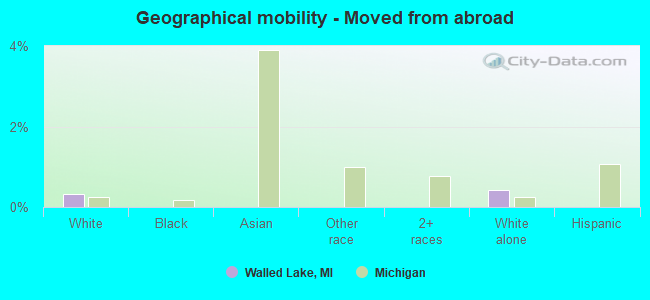
Geographical mobility - Moved from abroad (%)
Geographical mobility - Moved from abroad (%) - White
Geographical mobility - Moved from abroad (%) - Black or African American
Geographical mobility - Moved from abroad (%) - Asian
Geographical mobility - Moved from abroad (%) - Hispanic or Latino
Geographical mobility - Moved from abroad (%) - American Indian and Alaska Native
Geographical mobility - Moved from abroad (%) - Multirace
Geographical mobility - Moved from abroad (%) - Other Race
Place of birth for the foreign-born population - Ireland (%)
Place of birth for the foreign-born population - Denmark (%)
Place of birth for the foreign-born population - Norway (%)
Place of birth for the foreign-born population - Sweden (%)
Place of birth for the foreign-born population - United Kingdom (%)
Place of birth for the foreign-born population - England (%)
Place of birth for the foreign-born population - Scotland (%)
Place of birth for the foreign-born population - Other Northern Europe (%)
Place of birth for the foreign-born population - Austria (%)
Place of birth for the foreign-born population - Belgium (%)
Place of birth for the foreign-born population - France (%)
Place of birth for the foreign-born population - Germany (%)
Place of birth for the foreign-born population - Netherlands (%)
Place of birth for the foreign-born population - Switzerland (%)
Place of birth for the foreign-born population - Other Western Europe (%)
Place of birth for the foreign-born population - Greece (%)
Place of birth for the foreign-born population - Italy (%)
Place of birth for the foreign-born population - Portugal (%)
Place of birth for the foreign-born population - Spain (%)
Place of birth for the foreign-born population - Other Southern Europe (%)
Place of birth for the foreign-born population - Albania (%)
Place of birth for the foreign-born population - Belarus (%)
Place of birth for the foreign-born population - Bosnia and Herzegovina (%)
Place of birth for the foreign-born population - Bulgaria (%)
Place of birth for the foreign-born population - Croatia (%)
Place of birth for the foreign-born population - Czechoslovakia (%)
Place of birth for the foreign-born population - Hungary (%)
Place of birth for the foreign-born population - Latvia (%)
Place of birth for the foreign-born population - Lithuania (%)
Place of birth for the foreign-born population - North Macedonia (Macedonia) (%)
Place of birth for the foreign-born population - Moldova (%)
Place of birth for the foreign-born population - Poland (%)
Place of birth for the foreign-born population - Romania (%)
Place of birth for the foreign-born population - Russia (%)
Place of birth for the foreign-born population - Serbia (%)
Place of birth for the foreign-born population - Ukraine (%)
Place of birth for the foreign-born population - Other Eastern Europe (%)
Place of birth for the foreign-born population - China (%)
Place of birth for the foreign-born population - Hong Kong (%)
Place of birth for the foreign-born population - Taiwan (%)
Place of birth for the foreign-born population - Japan (%)
Place of birth for the foreign-born population - Korea (%)
Place of birth for the foreign-born population - Other Eastern Asia (%)
Place of birth for the foreign-born population - Afghanistan (%)
Place of birth for the foreign-born population - Bangladesh (%)
Place of birth for the foreign-born population - India (%)
Place of birth for the foreign-born population - Iran (%)
Place of birth for the foreign-born population - Kazakhstan (%)
Place of birth for the foreign-born population - Nepal (%)
Place of birth for the foreign-born population - Pakistan (%)
Place of birth for the foreign-born population - Sri Lanka (%)
Place of birth for the foreign-born population - Uzbekistan (%)
Place of birth for the foreign-born population - Other South Central Asia (%)
Place of birth for the foreign-born population - Burma (%)
Place of birth for the foreign-born population - Cambodia (%)
Place of birth for the foreign-born population - Indonesia (%)
Place of birth for the foreign-born population - Laos (%)
Place of birth for the foreign-born population - Malaysia (%)
Place of birth for the foreign-born population - Philippines (%)
Place of birth for the foreign-born population - Singapore (%)
Place of birth for the foreign-born population - Thailand (%)
Place of birth for the foreign-born population - Vietnam (%)
Place of birth for the foreign-born population - Other South Eastern Asia (%)
Place of birth for the foreign-born population - Armenia (%)
Place of birth for the foreign-born population - Iraq (%)
Place of birth for the foreign-born population - Israel (%)
Place of birth for the foreign-born population - Jordan (%)
Place of birth for the foreign-born population - Kuwait (%)
Place of birth for the foreign-born population - Lebanon (%)
Place of birth for the foreign-born population - Saudi Arabia (%)
Place of birth for the foreign-born population - Syria (%)
Place of birth for the foreign-born population - Turkey (%)
Place of birth for the foreign-born population - Yemen (%)
Place of birth for the foreign-born population - Other Western Asia (%)
Place of birth for the foreign-born population - Eritrea (%)
Place of birth for the foreign-born population - Ethiopia (%)
Place of birth for the foreign-born population - Kenya (%)
Place of birth for the foreign-born population - Somalia (%)
Place of birth for the foreign-born population - Uganda (%)
Place of birth for the foreign-born population - Zimbabwe (%)
Place of birth for the foreign-born population - Other Eastern Africa (%)
Place of birth for the foreign-born population - Cameroon (%)
Place of birth for the foreign-born population - Congo (%)
Place of birth for the foreign-born population - Democratic Republic of Congo (Zaire) (%)
Place of birth for the foreign-born population - Other Middle Africa (%)
Place of birth for the foreign-born population - Egypt (%)
Place of birth for the foreign-born population - Morocco (%)
Place of birth for the foreign-born population - Sudan (%)
Place of birth for the foreign-born population - Other Northern Africa (%)
Place of birth for the foreign-born population - South Africa (%)
Place of birth for the foreign-born population - Other Southern Africa (%)
Place of birth for the foreign-born population - Cabo Verde (%)
Place of birth for the foreign-born population - Ghana (%)
Place of birth for the foreign-born population - Liberia (%)
Place of birth for the foreign-born population - Nigeria (%)
Place of birth for the foreign-born population - Senegal (%)
Place of birth for the foreign-born population - Sierra Leone (%)
Place of birth for the foreign-born population - Other Western Africa (%)
Place of birth for the foreign-born population - Australia (%)
Place of birth for the foreign-born population - New Zealand (%)
Place of birth for the foreign-born population - Fiji (%)
Place of birth for the foreign-born population - Micronesia (%)
Place of birth for the foreign-born population - Bahamas (%)
Place of birth for the foreign-born population - Barbados (%)
Place of birth for the foreign-born population - Cuba (%)
Place of birth for the foreign-born population - Dominica (%)
Place of birth for the foreign-born population - Dominican Republic (%)
Place of birth for the foreign-born population - Grenada (%)
Place of birth for the foreign-born population - Haiti (%)
Place of birth for the foreign-born population - Jamaica (%)
Place of birth for the foreign-born population - St. Vincent and the Grenadines (%)
Place of birth for the foreign-born population - Trinidad and Tobago (%)
Place of birth for the foreign-born population - West Indies (%)
Place of birth for the foreign-born population - Other Caribbean (%)
Place of birth for the foreign-born population - Belize (%)
Place of birth for the foreign-born population - Costa Rica (%)
Place of birth for the foreign-born population - El Salvador (%)
Place of birth for the foreign-born population - Guatemala (%)
Place of birth for the foreign-born population - Honduras (%)
Place of birth for the foreign-born population - Mexico (%)
Place of birth for the foreign-born population - Nicaragua (%)
Place of birth for the foreign-born population - Panama (%)
Place of birth for the foreign-born population - Other Central America (%)
Place of birth for the foreign-born population - Argentina (%)
Place of birth for the foreign-born population - Bolivia (%)
Place of birth for the foreign-born population - Brazil (%)
Place of birth for the foreign-born population - Chile (%)
Place of birth for the foreign-born population - Colombia (%)
Place of birth for the foreign-born population - Ecuador (%)
Place of birth for the foreign-born population - Guyana (%)
Place of birth for the foreign-born population - Peru (%)
Place of birth for the foreign-born population - Uruguay (%)
Place of birth for the foreign-born population - Venezuela (%)
Place of birth for the foreign-born population - Other South America (%)
Place of birth for the foreign-born population - Canada (%)
Place of birth for the foreign-born population - Other Northern America (%)
Place of birth for the foreign-born population - Other (%)
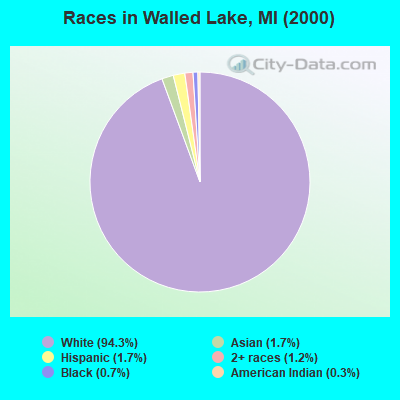
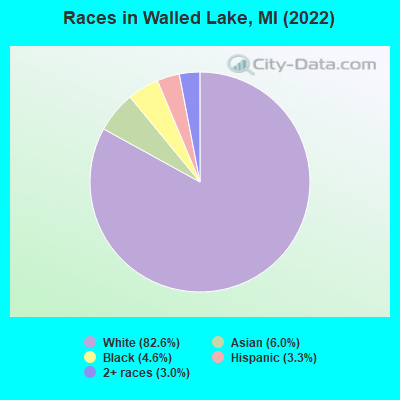
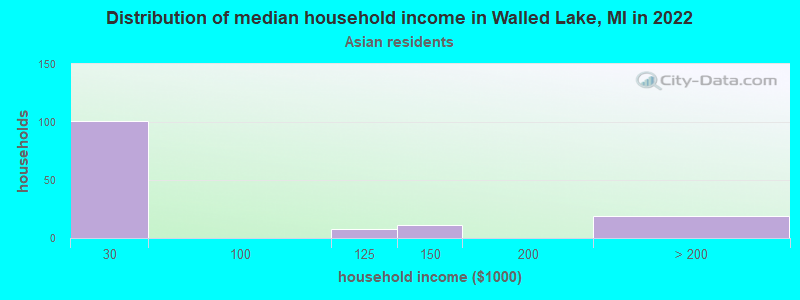
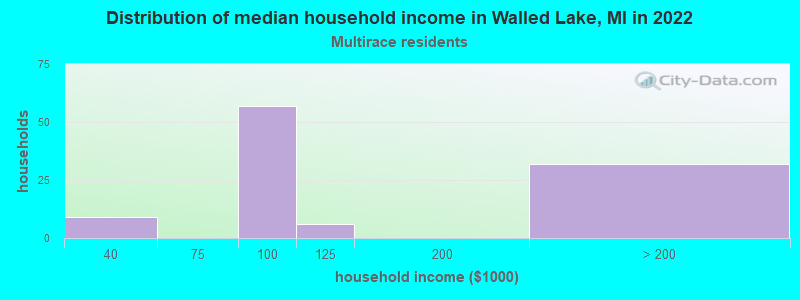
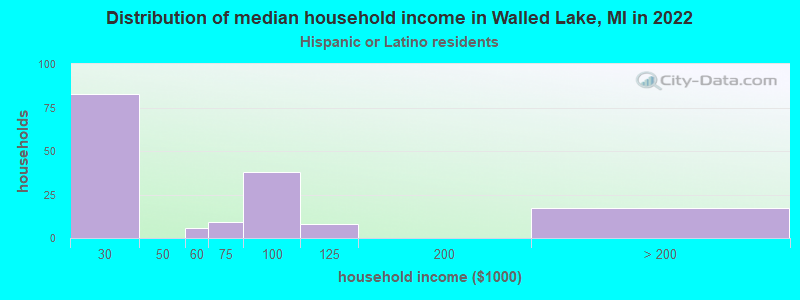
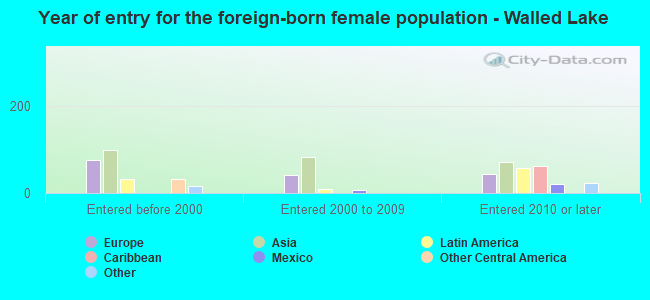
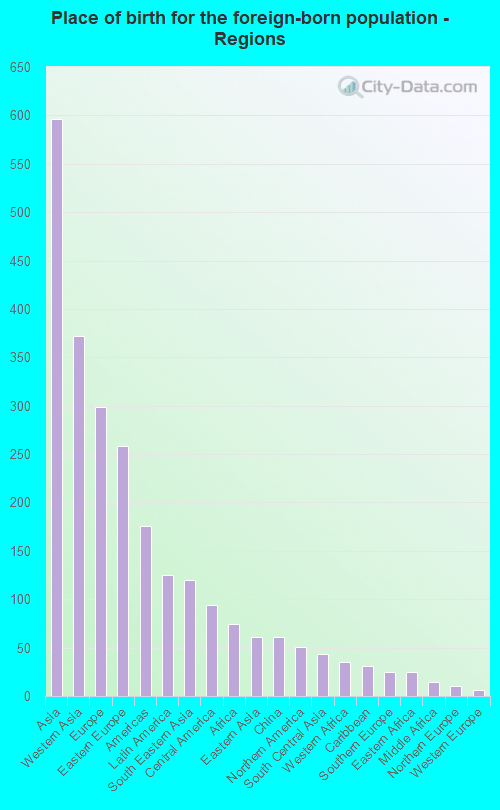
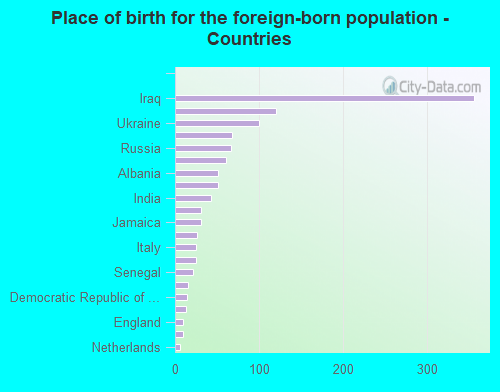
According to 2022 data, the most numerous races in Walled Lake, MI are White alone (5,982 residents), Black alone (331 residents), and Hispanic (241 residents). 82.4% of Walled Lake residents speak English at home. 15.8% of Walled Lake, MI residents are foreign-born (8.2% born in Asia, 4.1% born in Europe, 1.7% born in Latin America), which is 62.0% greater than the foreign-born rate of 6.0% across the entire state of Michigan.
Race distribution in Walled Lake
2000 2022
7,806,691 78.6% White alone 1,402,047 14.1% Black alone 323,877 3.3% Hispanic 175,311 1.8% Asian alone 163,487 1.6% Two or more races 53,421 0.5% American Indian alone 11,465 0.1% Other race alone 2,145 0.02% Native Hawaiian and Other
7,289,051 72.6% White alone 1,310,464 13.1% Black alone 572,405 5.7% Hispanic 450,031 4.5% Two or more races 335,732 3.3% Asian alone 45,217 0.5% Other race alone 29,011 0.3% American Indian alone 2,207 0.02% Native Hawaiian and Other
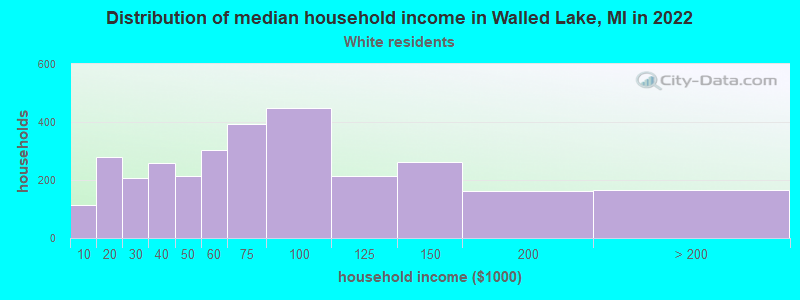
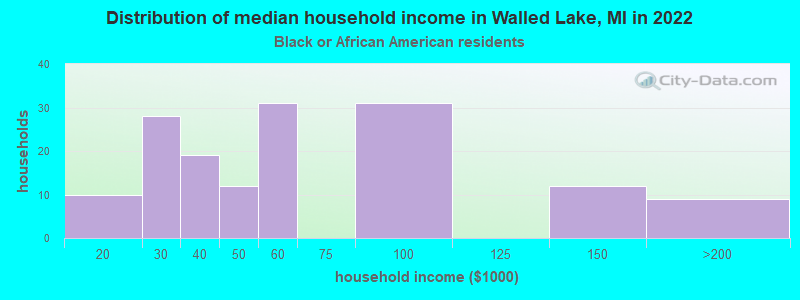
Income and house value in Walled Lake Median household income in 2022 $64,945 White non-Hispanic householders$50,905 Black householdersMedian 2022 house value $227,654 White Non-Hispanic householders$329,106 Black or African American householders $446,707 Asian householders
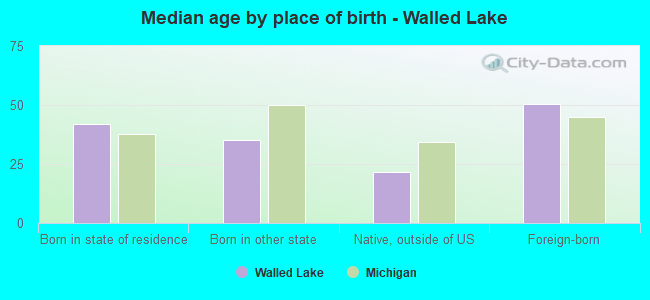
Median age by race in Walled Lake
43.4 Median age for White residents39.7 46.9 34.1 Median age for Black or African American residents25.5 49.9 -718,321,226.1 Median age for American Indian / Alaska Native residents-505,050,504.5 -728,395,061.0 37.5 Median age for Asian residents53.8 12.2 -670,531,400.3 Median age for Native Hawaiian / Pacific Islander residents-674,772,035.8 -699,588,476.7 30.6 Median age for Other race residents-685,416,666.0 -604,609,928.5 36.7 Median age for Two or more races residents38.2 28.3 43.1 Median age for White alone residents39.5 46.6 46.0 Median age for Hispanic or Latino residents45.3 47.0
Owner/renter occupied households by race in Walled Lake
House owners and renters - White residents 1,918 64.1% Owner occupied1,073 35.9% Renter occupiedHouse owners and renters - Black or African American residents 11 6.5% Owner occupied157 93.5% Renter occupiedHouse owners and renters - Asian residents 27 22.6% Owner occupied91 77.4% Renter occupiedHouse owners and renters - Other race residents 10 100.0% Renter occupiedHouse owners and renters - Two or more races residents 80 73.0% Owner occupied29 27.0% Renter occupiedHouse owners and renters - White alone residents 1,895 64.9% Owner occupied1,023 35.1% Renter occupiedHouse owners and renters - Hispanic or Latino residents 58 40.4% Owner occupied85 59.6% Renter occupied
Language usage in Walled Lake
English speakers - Total 82.4% of residents of Walled Lake speak English at home.
2.1% of residents speak Spanish at home 134 93.1% Speak English very well10 6.9% Speak English less than very well15.3% of residents speak other language at home 599 55.9% Speak English very well472 44.1% Speak English less than very well
English speakers - Born in the United States 83.5% of residents of Walled Lake speak English at home.
0.7% of residents speak Spanish at home 8 100.0% Speak English very well13.2% of residents speak other language at home 143 100.0% Speak English very well
English speakers - Native, born elsewhere 54.9% of residents of Walled Lake speak English at home.
54.9% of residents speak other language at home 14 50.0% Speak English very well14 50.0% Speak English less than very well
English speakers - Foreign-born 17.3% of residents of Walled Lake speak English at home.
10.3% of residents speak Spanish at home 106 90.6% Speak English very well11 9.4% Speak English less than very well71.5% of residents speak other language at home 365 44.8% Speak English very well450 55.2% Speak English less than very well
White (Caucasian) - Speak only English Native:
98.8% (5,081)Foreign-born:
18.0% (117)
White (Caucasian) - Speak another language Native:
1.4% (70)Foreign-born:
80.7% (524)
Black or African American - Speak only English Native:
81.9% (186)Foreign-born:
19.2% (24)
Black or African American - Speak another language Native:
17.9% (41)Foreign-born:
85.5% (107)
Asian - Speak only English Native:
15.0% (30)Foreign-born:
23.0% (55)
Asian - Speak another language Native:
82.9% (166)Foreign-born:
77.4% (186)
White alone - Speak only English Native:
98.5% (5,007)Foreign-born:
17.0% (110)
White alone - Speak another language Native:
1.4% (72)Foreign-born:
82.2% (532)
Hispanic or Latino - Speak only English Native:
91.0% (120)Foreign-born:
7.0% (8)
Hispanic or Latino - Speak another language Native:
5.6% (7)Foreign-born:
92.6% (111)
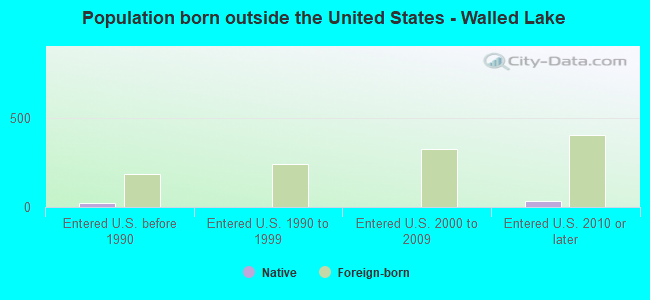
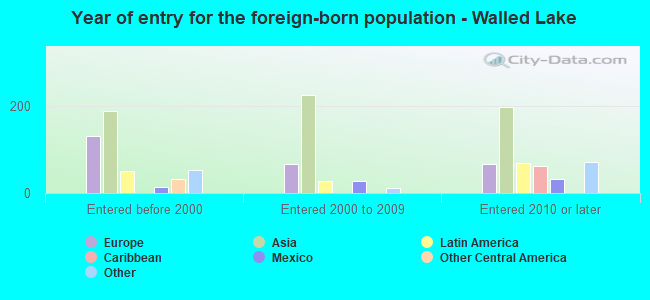
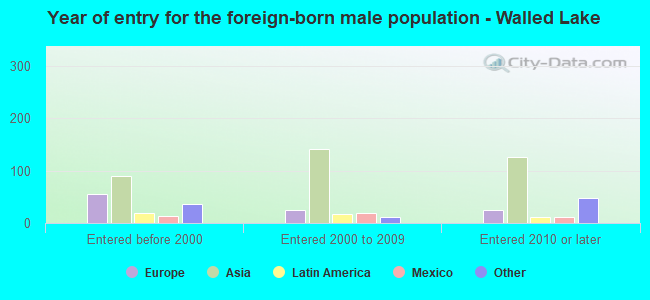
Foreign-born residents in Walled Lake 1,145 residents are foreign born (8.2% Asia , 4.1% Europe , 1.7% Latin America ).
This city:
15.8%Michigan:
6.9%
Marital status for residents in Walled Lake Marital status - White (Caucasian) population 15 years and over
Males 38.2% Never married41.1% Now married1.5% Separated1.7% Widowed17.5% DivorcedFemales 28.9% Never married37.6% Now married0.4% Separated9.4% Widowed23.7% DivorcedWomen who gave birth in the past 12 months Now married:
100.0% (51)Unmarried:
0.0% (0)
Women who did not give birth in the past 12 months Now married:
41.8% (588)Unmarried:
58.2% (821)
Marital status - Black or African American population 15 years and over
Males 63.8% Never married26.0% Now married10.2% Separated0.0% Widowed0.0% DivorcedFemales 46.2% Never married31.6% Now married0.0% Separated0.0% Widowed22.2% DivorcedWomen who did not give birth in the past 12 months Now married:
48.1% (46)Unmarried:
51.9% (50)
Marital status - Asian population 15 years and over
Males 10.0% Never married90.0% Now married0.0% Separated0.0% Widowed0.0% DivorcedFemales 0.0% Never married100.0% Now married0.0% Separated0.0% Widowed0.0% DivorcedWomen who did not give birth in the past 12 months Now married:
100.0% (95)Unmarried:
0.0% (0)
Marital status - Other race population 15 years and over
Males 46.7% Never married53.3% Now married0.0% Separated0.0% Widowed0.0% DivorcedFemales 0.0% Never married100.0% Now married0.0% Separated0.0% Widowed0.0% DivorcedWomen who did not give birth in the past 12 months Now married:
100.0% (29)Unmarried:
0.0% (0)
Marital status - Two or more races population 15 years and over
Males 30.0% Never married35.6% Now married0.0% Separated0.0% Widowed34.4% DivorcedFemales 78.4% Never married9.5% Now married0.0% Separated12.2% Widowed0.0% DivorcedWomen who did not give birth in the past 12 months Now married:
10.2% (7)Unmarried:
89.8% (61)
Marital status - White alone, not Hispanic / Latino population 15 years and over
Males 38.2% Never married41.2% Now married1.5% Separated1.7% Widowed17.4% DivorcedFemales 28.8% Never married38.4% Now married0.4% Separated7.9% Widowed24.4% DivorcedWomen who gave birth in the past 12 months Now married:
100.0% (52)Unmarried:
0.0% (0)
Women who did not give birth in the past 12 months Now married:
42.1% (584)Unmarried:
57.9% (805)
Marital status - Hispanic or Latino population 15 years and over
Males 23.4% Never married64.9% Now married0.0% Separated0.0% Widowed11.7% DivorcedFemales 25.4% Never married28.7% Now married0.0% Separated41.8% Widowed4.1% DivorcedWomen who did not give birth in the past 12 months Now married:
53.0% (38)Unmarried:
47.0% (34)
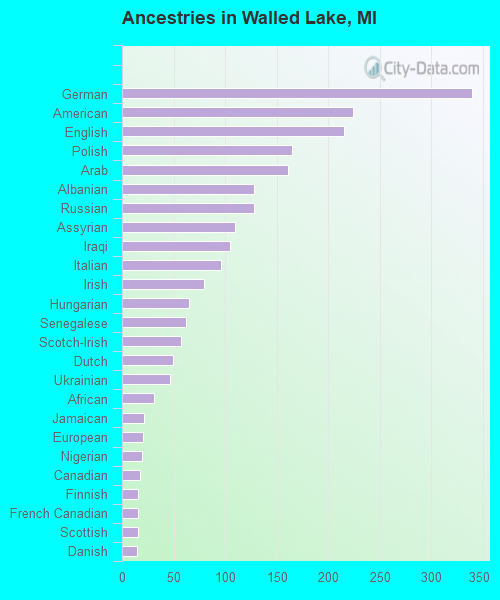
Ancestries in Walled Lake
339 11.5% German224 7.6% American215 7.3% English165 5.6% Polish161 5.4% Arab128 4.3% Albanian128 4.3% Russian110 3.7% Assyrian105 3.6% Iraqi96 3.2% Italian80 2.7% Irish65 2.2% Hungarian62 2.1% Senegalese57 1.9% Scotch-Irish49 1.7% Dutch47 1.6% Ukrainian31 1.0% African21 0.7% Jamaican20 0.7% European19 0.6% Nigerian17 0.6% Canadian16 0.5% Finnish16 0.5% French Canadian16 0.5% Scottish15 0.5% Danish10 0.3% Palestinian10 0.3% Slovak9 0.3% Czech8 0.3% Norwegian6 0.2% Eastern European4 0.1% Swedish
Children Nativity (place of birth) in Walled Lake
Children under 6 years - Living with two parents Both parents native 175 100.0% NativeBoth parents foreign-born 16 100.0% NativeOne native, one foreign-born parent 10 100.0% NativeChildren under 6 years - Living with one parent Native parent 38 100.0% NativeForeign-born parent 37 100.0% NativeChildren 6 to 17 years - Living with two parents Both parents native 426 100.0% NativeBoth parents foreign-born 155 67.6% Native74 32.4% Foreign-bornOne native, one foreign-born parent 31 100.0% NativeChildren 6 to 17 years - Living with one parent Native parent 246 96.3% Native9 3.7% Foreign-bornForeign-born parent 25 100.0% Native
Grandparents responsible for own grandchildren in Walled Lake
Grandparents (30 to 59 years) White / Caucasian 5 100.0% Not responsible for grandchildrenWhite alone, not Hispanic / Latino 5 100.0% Not responsible for grandchildren
Grandparents (60 years and over) White / Caucasian 98 100.0% Not responsible for grandchildrenWhite alone, not Hispanic / Latino 99 100.0% Not responsible for grandchildren