Races in Wawarsing, New York (NY) Detailed Stats
Ancestries, Foreign-born residents, place of birth

Recent posts about races in Wawarsing, New York on our local forum with over 2,400,000 registered users:
 | Hispanic/Latino communities in Upstate NY (804 replies) |
| For those interested in Technology and Economic activity in Upstate NY... (2808 replies) |
9.9% of Wawarsing, NY residents are foreign-born (4.9% born in Latin America, 3.8% born in Europe), which is 122.1% less than the foreign-born rate of 22.0% across the entire state of New York.
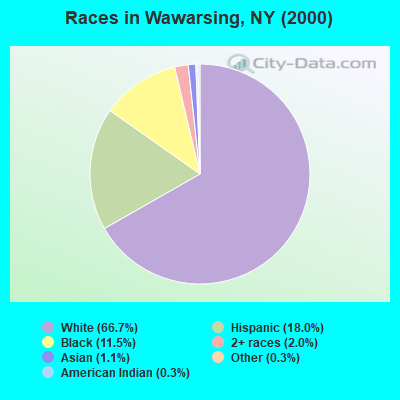
Race distribution in Wawarsing

- 8,60266.7%White alone
- 2,32618.0%Hispanic
- 1,48311.5%Black alone
- 2552.0%Two or more races
- 1471.1%Asian alone
- 400.3%Other race alone
- 350.3%American Indian alone
- 10.01%Native Hawaiian and Other
Pacific Islander alone
2000
2022
-
- 11,760,98162.0%White alone
- 2,867,58315.1%Hispanic
- 2,812,62314.8%Black alone
- 1,035,9265.5%Asian alone
- 366,1161.9%Two or more races
- 75,4990.4%Other race alone
- 52,4990.3%American Indian alone
- 5,2300.03%Native Hawaiian and Other
Pacific Islander alone

-
- 10,408,93352.9%White alone
- 3,867,29919.7%Hispanic
- 2,633,84013.4%Black alone
- 1,776,2869.0%Asian alone
- 732,6703.7%Two or more races
- 216,1101.1%Other race alone
- 35,0820.2%American Indian alone
- 6,9310.04%Native Hawaiian and Other
Pacific Islander alone

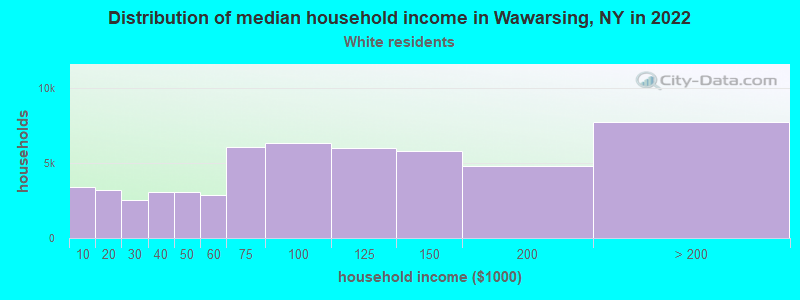
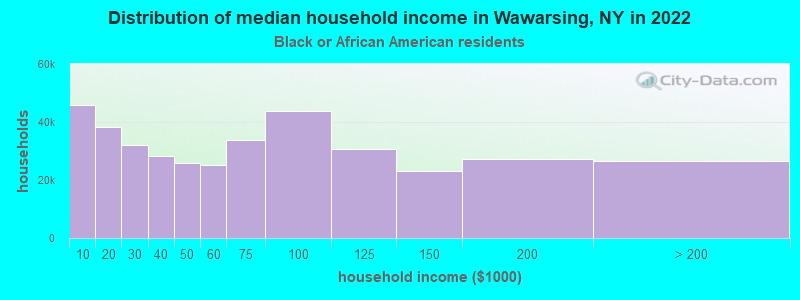
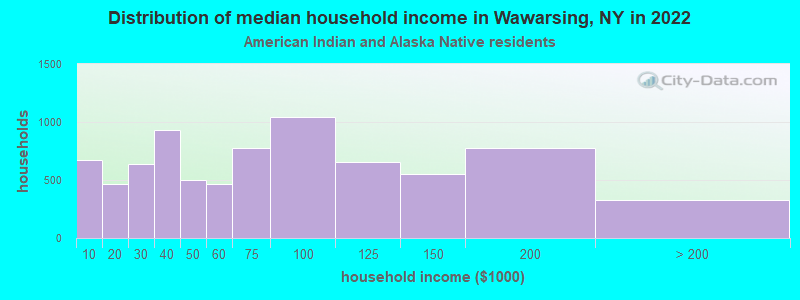
Income and house value in Wawarsing
- Median household income in 2022
- $75,799White non-Hispanic householders
- $44,409Black householders
- $21,186American Indian and Alaska Native householders
- $82,204Asian householders
- $26,181Some other race householders
- $38,522Two or more races householders
- $30,996Hispanic or Latino race householders
- Median 2022 house value
- $270,889White Non-Hispanic householders
- $176,259Black or African American householders
- $626,129Asian householders
- $233,702Some other race householders
- $291,145Two or more races householders
- $292,959Hispanic or Latino householders
Household income for White non-Hispanic householders
Household income for Black householders
Household income for American Indian and Alaska Native householders
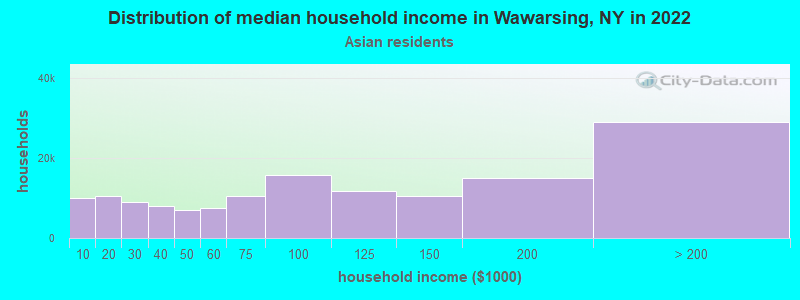
Household income for Asian householders
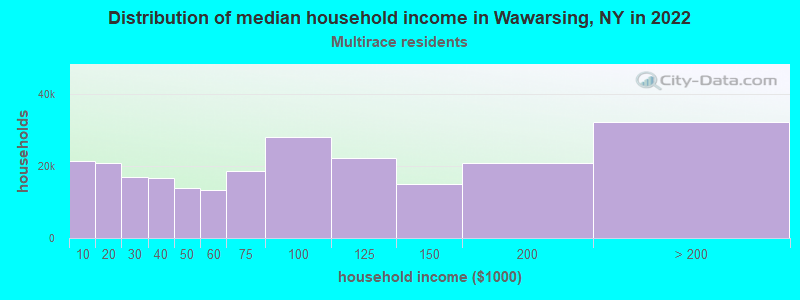
Household income for Two or more races householders
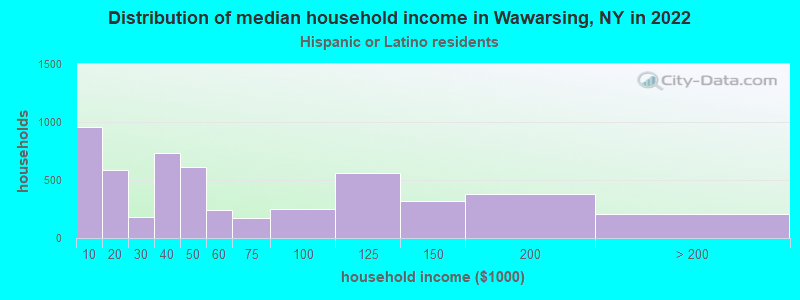
Household income for Hispanic or Latino race householders
Foreign-born residents in Wawarsing
1,277 residents are foreign born (4.9% Latin America, 3.8% Europe).
| This city: | 9.9% |
| New York: | 20.4% |
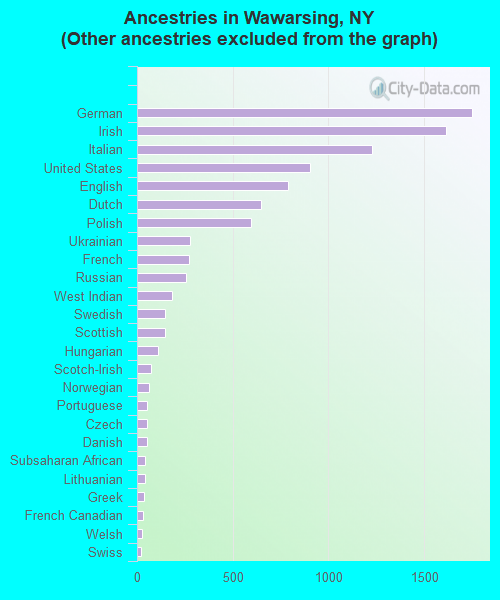
Ancestries in Wawarsing

- 3,41026.5%Other
- 1,75213.6%German
- 1,61312.6%Irish
- 1,2269.5%Italian
- 9057.0%United States
- 7896.1%English
- 6475.0%Dutch
- 5984.7%Polish
- 2792.2%Ukrainian
- 2732.1%French
- 2552.0%Russian
- 1811.4%West Indian
- 1461.1%Swedish
- 1441.1%Scottish
- 1080.8%Hungarian
- 720.6%Scotch-Irish
- 620.5%Norwegian
- 530.4%Portuguese
- 520.4%Czech
- 520.4%Danish
- 440.3%Subsaharan African
- 430.3%Lithuanian
- 340.3%Greek
- 330.3%French Canadian
- 260.2%Welsh
- 210.2%Swiss
- 160.1%Arab
- 110.09%Slovak
Zip codes: 12458.