Races in West Allis, Wisconsin (WI) Detailed Stats
Data:
Races - White alone (%)
Races - White alone (% change since 2000)
Races - Black alone (%)
Races - Black alone (% change since 2000)
Races - American Indian alone (%)
Races - American Indian alone (% change since 2000)
Races - Asian alone (%)
Races - Asian alone (% change since 2000)
Races - Hispanic (%)
Races - Hispanic (% change since 2000)
Races - Native Hawaiian and Other Pacific Islander alone (%)
Races - Native Hawaiian and Other Pacific Islander alone (% change since 2000)
Races - Two or more races(%)
Races - Two or more races(% change since 2000)
Races - Other race alone (%)
Races - Other race alone (% change since 2000)
Racial diversity
Place of birth - Born in state of residence (%)
Place of birth - Born in state of residence (%) - White
Place of birth - Born in state of residence (%) - Black or African American
Place of birth - Born in state of residence (%) - Asian
Place of birth - Born in state of residence (%) - Hispanic or Latino
Place of birth - Born in state of residence (%) - American Indian and Alaska Native
Place of birth - Born in state of residence (%) - Multirace
Place of birth - Born in state of residence (%) - Other Race
Place of birth - Born in other state (%)
Place of birth - Born in other state (%) - White
Place of birth - Born in other state (%) - Black or African American
Place of birth - Born in other state (%) - Asian
Place of birth - Born in other state (%) - Hispanic or Latino
Place of birth - Born in other state (%) - American Indian and Alaska Native
Place of birth - Born in other state (%) - Multirace
Place of birth - Born in other state (%) - Other Race
Place of birth - Native, outside of US (%)
Place of birth - Native, outside of US (%) - White
Place of birth - Native, outside of US (%) - Black or African American
Place of birth - Native, outside of US (%) - Asian
Place of birth - Native, outside of US (%) - Hispanic or Latino
Place of birth - Native, outside of US (%) - American Indian and Alaska Native
Place of birth - Native, outside of US (%) - Multirace
Place of birth - Native, outside of US (%) - Other Race
Place of birth - Foreign born (%)
Place of birth - Foreign born (%) - White
Place of birth - Foreign born (%) - Black or African American
Place of birth - Foreign born (%) - Asian
Place of birth - Foreign born (%) - Hispanic or Latino
Place of birth - Foreign born (%) - American Indian and Alaska Native
Place of birth - Foreign born (%) - Multirace
Place of birth - Foreign born (%) - Other Race
Residents speaking English at home (%)
Residents speaking English at home - Born in the United States (%)
Residents speaking English at home - Native, born elsewhere (%)
Residents speaking English at home - Foreign born (%)
Residents speaking Spanish at home (%)
Residents speaking Spanish at home - Born in the United States (%)
Residents speaking Spanish at home - Native, born elsewhere (%)
Residents speaking Spanish at home - Foreign born (%)
Residents speaking other language at home (%)
Residents speaking other language at home - Born in the United States (%)
Residents speaking other language at home - Native, born elsewhere (%)
Residents speaking other language at home - Foreign born (%)
Marital status - Never married (%)
Marital status - Now married (%)
Marital status - Separated (%)
Marital status - Widowed (%)
Marital status - Divorced (%)
Ancestries Reported - Arab (%)
Ancestries Reported - Czech (%)
Ancestries Reported - Danish (%)
Ancestries Reported - Dutch (%)
Ancestries Reported - English (%)
Ancestries Reported - French (%)
Ancestries Reported - French Canadian (%)
Ancestries Reported - German (%)
Ancestries Reported - Greek (%)
Ancestries Reported - Hungarian (%)
Ancestries Reported - Irish (%)
Ancestries Reported - Italian (%)
Ancestries Reported - Lithuanian (%)
Ancestries Reported - Norwegian (%)
Ancestries Reported - Polish (%)
Ancestries Reported - Portuguese (%)
Ancestries Reported - Russian (%)
Ancestries Reported - Scotch-Irish (%)
Ancestries Reported - Scottish (%)
Ancestries Reported - Slovak (%)
Ancestries Reported - Subsaharan African (%)
Ancestries Reported - Swedish (%)
Ancestries Reported - Swiss (%)
Ancestries Reported - Ukrainian (%)
Ancestries Reported - United States (%)
Ancestries Reported - Welsh (%)
Ancestries Reported - West Indian (%)
Ancestries Reported - Other (%)
Geographical mobility - Same house 1 year ago (%)
Geographical mobility - Same house 1 year ago (%) - White
Geographical mobility - Same house 1 year ago (%) - Black or African American
Geographical mobility - Same house 1 year ago (%) - Asian
Geographical mobility - Same house 1 year ago (%) - Hispanic or Latino
Geographical mobility - Same house 1 year ago (%) - American Indian and Alaska Native
Geographical mobility - Same house 1 year ago (%) - Multirace
Geographical mobility - Same house 1 year ago (%) - Other Race
Geographical mobility - Moved within same county (%)
Geographical mobility - Moved within same county (%) - White
Geographical mobility - Moved within same county (%) - Black or African American
Geographical mobility - Moved within same county (%) - Asian
Geographical mobility - Moved within same county (%) - Hispanic or Latino
Geographical mobility - Moved within same county (%) - American Indian and Alaska Native
Geographical mobility - Moved within same county (%) - Multirace
Geographical mobility - Moved within same county (%) - Other Race
Geographical mobility - Moved from different county within same state (%)
Geographical mobility - Moved from different county within same state (%) - White
Geographical mobility - Moved from different county within same state (%) - Black or African American
Geographical mobility - Moved from different county within same state (%) - Asian
Geographical mobility - Moved from different county within same state (%) - Hispanic or Latino
Geographical mobility - Moved from different county within same state (%) - American Indian and Alaska Native
Geographical mobility - Moved from different county within same state (%) - Multirace
Geographical mobility - Moved from different county within same state (%) - Other Race
Geographical mobility - Moved from different state (%)
Geographical mobility - Moved from different state (%) - White
Geographical mobility - Moved from different state (%) - Black or African American
Geographical mobility - Moved from different state (%) - Asian
Geographical mobility - Moved from different state (%) - Hispanic or Latino
Geographical mobility - Moved from different state (%) - American Indian and Alaska Native
Geographical mobility - Moved from different state (%) - Multirace
Geographical mobility - Moved from different state (%) - Other Race
Geographical mobility - Moved from abroad (%)
Geographical mobility - Moved from abroad (%) - White
Geographical mobility - Moved from abroad (%) - Black or African American
Geographical mobility - Moved from abroad (%) - Asian
Geographical mobility - Moved from abroad (%) - Hispanic or Latino
Geographical mobility - Moved from abroad (%) - American Indian and Alaska Native
Geographical mobility - Moved from abroad (%) - Multirace
Geographical mobility - Moved from abroad (%) - Other Race
Place of birth for the foreign-born population - Ireland (%)
Place of birth for the foreign-born population - Denmark (%)
Place of birth for the foreign-born population - Norway (%)
Place of birth for the foreign-born population - Sweden (%)
Place of birth for the foreign-born population - United Kingdom (%)
Place of birth for the foreign-born population - England (%)
Place of birth for the foreign-born population - Scotland (%)
Place of birth for the foreign-born population - Other Northern Europe (%)
Place of birth for the foreign-born population - Austria (%)
Place of birth for the foreign-born population - Belgium (%)
Place of birth for the foreign-born population - France (%)
Place of birth for the foreign-born population - Germany (%)
Place of birth for the foreign-born population - Netherlands (%)
Place of birth for the foreign-born population - Switzerland (%)
Place of birth for the foreign-born population - Other Western Europe (%)
Place of birth for the foreign-born population - Greece (%)
Place of birth for the foreign-born population - Italy (%)
Place of birth for the foreign-born population - Portugal (%)
Place of birth for the foreign-born population - Spain (%)
Place of birth for the foreign-born population - Other Southern Europe (%)
Place of birth for the foreign-born population - Albania (%)
Place of birth for the foreign-born population - Belarus (%)
Place of birth for the foreign-born population - Bosnia and Herzegovina (%)
Place of birth for the foreign-born population - Bulgaria (%)
Place of birth for the foreign-born population - Croatia (%)
Place of birth for the foreign-born population - Czechoslovakia (%)
Place of birth for the foreign-born population - Hungary (%)
Place of birth for the foreign-born population - Latvia (%)
Place of birth for the foreign-born population - Lithuania (%)
Place of birth for the foreign-born population - North Macedonia (Macedonia) (%)
Place of birth for the foreign-born population - Moldova (%)
Place of birth for the foreign-born population - Poland (%)
Place of birth for the foreign-born population - Romania (%)
Place of birth for the foreign-born population - Russia (%)
Place of birth for the foreign-born population - Serbia (%)
Place of birth for the foreign-born population - Ukraine (%)
Place of birth for the foreign-born population - Other Eastern Europe (%)
Place of birth for the foreign-born population - China (%)
Place of birth for the foreign-born population - Hong Kong (%)
Place of birth for the foreign-born population - Taiwan (%)
Place of birth for the foreign-born population - Japan (%)
Place of birth for the foreign-born population - Korea (%)
Place of birth for the foreign-born population - Other Eastern Asia (%)
Place of birth for the foreign-born population - Afghanistan (%)
Place of birth for the foreign-born population - Bangladesh (%)
Place of birth for the foreign-born population - India (%)
Place of birth for the foreign-born population - Iran (%)
Place of birth for the foreign-born population - Kazakhstan (%)
Place of birth for the foreign-born population - Nepal (%)
Place of birth for the foreign-born population - Pakistan (%)
Place of birth for the foreign-born population - Sri Lanka (%)
Place of birth for the foreign-born population - Uzbekistan (%)
Place of birth for the foreign-born population - Other South Central Asia (%)
Place of birth for the foreign-born population - Burma (%)
Place of birth for the foreign-born population - Cambodia (%)
Place of birth for the foreign-born population - Indonesia (%)
Place of birth for the foreign-born population - Laos (%)
Place of birth for the foreign-born population - Malaysia (%)
Place of birth for the foreign-born population - Philippines (%)
Place of birth for the foreign-born population - Singapore (%)
Place of birth for the foreign-born population - Thailand (%)
Place of birth for the foreign-born population - Vietnam (%)
Place of birth for the foreign-born population - Other South Eastern Asia (%)
Place of birth for the foreign-born population - Armenia (%)
Place of birth for the foreign-born population - Iraq (%)
Place of birth for the foreign-born population - Israel (%)
Place of birth for the foreign-born population - Jordan (%)
Place of birth for the foreign-born population - Kuwait (%)
Place of birth for the foreign-born population - Lebanon (%)
Place of birth for the foreign-born population - Saudi Arabia (%)
Place of birth for the foreign-born population - Syria (%)
Place of birth for the foreign-born population - Turkey (%)
Place of birth for the foreign-born population - Yemen (%)
Place of birth for the foreign-born population - Other Western Asia (%)
Place of birth for the foreign-born population - Eritrea (%)
Place of birth for the foreign-born population - Ethiopia (%)
Place of birth for the foreign-born population - Kenya (%)
Place of birth for the foreign-born population - Somalia (%)
Place of birth for the foreign-born population - Uganda (%)
Place of birth for the foreign-born population - Zimbabwe (%)
Place of birth for the foreign-born population - Other Eastern Africa (%)
Place of birth for the foreign-born population - Cameroon (%)
Place of birth for the foreign-born population - Congo (%)
Place of birth for the foreign-born population - Democratic Republic of Congo (Zaire) (%)
Place of birth for the foreign-born population - Other Middle Africa (%)
Place of birth for the foreign-born population - Egypt (%)
Place of birth for the foreign-born population - Morocco (%)
Place of birth for the foreign-born population - Sudan (%)
Place of birth for the foreign-born population - Other Northern Africa (%)
Place of birth for the foreign-born population - South Africa (%)
Place of birth for the foreign-born population - Other Southern Africa (%)
Place of birth for the foreign-born population - Cabo Verde (%)
Place of birth for the foreign-born population - Ghana (%)
Place of birth for the foreign-born population - Liberia (%)
Place of birth for the foreign-born population - Nigeria (%)
Place of birth for the foreign-born population - Senegal (%)
Place of birth for the foreign-born population - Sierra Leone (%)
Place of birth for the foreign-born population - Other Western Africa (%)
Place of birth for the foreign-born population - Australia (%)
Place of birth for the foreign-born population - New Zealand (%)
Place of birth for the foreign-born population - Fiji (%)
Place of birth for the foreign-born population - Micronesia (%)
Place of birth for the foreign-born population - Bahamas (%)
Place of birth for the foreign-born population - Barbados (%)
Place of birth for the foreign-born population - Cuba (%)
Place of birth for the foreign-born population - Dominica (%)
Place of birth for the foreign-born population - Dominican Republic (%)
Place of birth for the foreign-born population - Grenada (%)
Place of birth for the foreign-born population - Haiti (%)
Place of birth for the foreign-born population - Jamaica (%)
Place of birth for the foreign-born population - St. Vincent and the Grenadines (%)
Place of birth for the foreign-born population - Trinidad and Tobago (%)
Place of birth for the foreign-born population - West Indies (%)
Place of birth for the foreign-born population - Other Caribbean (%)
Place of birth for the foreign-born population - Belize (%)
Place of birth for the foreign-born population - Costa Rica (%)
Place of birth for the foreign-born population - El Salvador (%)
Place of birth for the foreign-born population - Guatemala (%)
Place of birth for the foreign-born population - Honduras (%)
Place of birth for the foreign-born population - Mexico (%)
Place of birth for the foreign-born population - Nicaragua (%)
Place of birth for the foreign-born population - Panama (%)
Place of birth for the foreign-born population - Other Central America (%)
Place of birth for the foreign-born population - Argentina (%)
Place of birth for the foreign-born population - Bolivia (%)
Place of birth for the foreign-born population - Brazil (%)
Place of birth for the foreign-born population - Chile (%)
Place of birth for the foreign-born population - Colombia (%)
Place of birth for the foreign-born population - Ecuador (%)
Place of birth for the foreign-born population - Guyana (%)
Place of birth for the foreign-born population - Peru (%)
Place of birth for the foreign-born population - Uruguay (%)
Place of birth for the foreign-born population - Venezuela (%)
Place of birth for the foreign-born population - Other South America (%)
Place of birth for the foreign-born population - Canada (%)
Place of birth for the foreign-born population - Other Northern America (%)
Place of birth for the foreign-born population - Other (%)
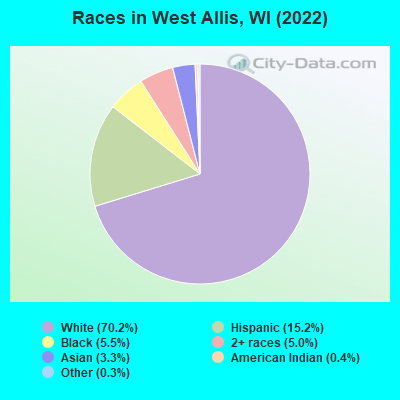
According to 2022 data, the most numerous races in West Allis, WI are White alone (41,424 residents), Hispanic (8,959 residents), and Black alone (3,230 residents). 87.2% of West Allis residents speak English at home. 5.3% of West Allis, WI residents are foreign-born (2.3% born in Latin America, 1.9% born in Asia, 0.8% born in Europe), which is 5.2% greater than the foreign-born rate of 5.0% across the entire state of Wisconsin.
Race distribution in West Allis
2000 2022
4,681,630 87.3% White alone 300,245 5.6% Black alone 192,921 3.6% Hispanic 87,995 1.6% Asian alone 51,921 1.0% Two or more races 43,980 0.8% American Indian alone 3,637 0.07% Other race alone 1,346 0.03% Native Hawaiian and Other
4,654,031 79.0% White alone 447,022 7.6% Hispanic 345,678 5.9% Black alone 217,532 3.7% Two or more races 172,242 2.9% Asian alone 33,762 0.6% American Indian alone 19,680 0.3% Other race alone 2,592 0.04% Native Hawaiian and Other
Income and house value in West Allis Median household income in 2022 $63,988 White non-Hispanic householders$43,735 Black householders$78,999 American Indian and Alaska Native householders$92,857 Asian householders$63,173 Some other race householders$66,836 Two or more races householders$70,078 Hispanic or Latino race householdersMedian 2022 house value $190,596 White Non-Hispanic householders$197,116 Black or African American householders$223,769 American Indian or Alaska Native householders $163,944 Asian householders$168,929 Some other race householders$175,065 Two or more races householders$169,312 Hispanic or Latino householders
Median age by race in West Allis
44.4 Median age for White residents42.6 47.3 32.3 Median age for Black or African American residents33.5 29.7 50.4 Median age for American Indian / Alaska Native residents54.0 45.4 31.9 Median age for Asian residents31.8 32.6 -825,688,072.6 Median age for Native Hawaiian / Pacific Islander residents-862,745,097.2 -732,444,443.7 33.4 Median age for Other race residents38.5 29.4 25.1 Median age for Two or more races residents27.5 23.7 46.0 Median age for White alone residents43.9 48.0 27.1 Median age for Hispanic or Latino residents26.3 27.9
Owner/renter occupied households by race in West Allis
House owners and renters - White residents 12,767 57.7% Owner occupied9,354 42.3% Renter occupiedHouse owners and renters - Black or African American residents 180 11.0% Owner occupied1,455 89.0% Renter occupiedHouse owners and renters - American Indian / Alaska Native residents 39 17.5% Owner occupied184 82.5% Renter occupiedHouse owners and renters - Asian residents 283 49.3% Owner occupied291 50.7% Renter occupiedHouse owners and renters - Other race residents 224 49.1% Owner occupied233 50.9% Renter occupiedHouse owners and renters - Two or more races residents 971 41.7% Owner occupied1,357 58.3% Renter occupiedHouse owners and renters - White alone residents 12,435 57.2% Owner occupied9,323 42.8% Renter occupiedHouse owners and renters - Hispanic or Latino residents 1,299 48.9% Owner occupied1,355 51.1% Renter occupied
Language usage in West Allis
English speakers - Total 87.2% of residents of West Allis speak English at home.
8.3% of residents speak Spanish at home 2,924 63.7% Speak English very well1,665 36.3% Speak English less than very well4.2% of residents speak other language at home 1,600 68.4% Speak English very well739 31.6% Speak English less than very well
English speakers - Born in the United States 85.1% of residents of West Allis speak English at home.
10.9% of residents speak Spanish at home 834 92.1% Speak English very well72 7.9% Speak English less than very well4.2% of residents speak other language at home 319 90.9% Speak English very well32 9.1% Speak English less than very well
English speakers - Native, born elsewhere 19.1% of residents of West Allis speak English at home.
70.9% of residents speak Spanish at home 356 52.4% Speak English very well324 47.6% Speak English less than very well12.9% of residents speak other language at home 124 100.0% Speak English very well
English speakers - Foreign-born 16.1% of residents of West Allis speak English at home.
41.5% of residents speak Spanish at home 350 26.6% Speak English very well967 73.4% Speak English less than very well41.5% of residents speak other language at home 638 48.5% Speak English very well678 51.5% Speak English less than very well
White (Caucasian) - Speak only English Native:
98.6% (39,770)Foreign-born:
38.1% (242)
White (Caucasian) - Speak another language Native:
2.4% (968)Foreign-born:
64.8% (412)
Black or African American - Speak only English Native:
95.5% (3,145)Foreign-born:
7.5% (9)
Black or African American - Speak another language Native:
3.1% (101)Foreign-born:
95.0% (118)
American Indian / Alaska Native - Speak another language Native:
11.2% (40)Foreign-born:
100.0% (11)
Asian - Speak only English Native:
26.2% (216)Foreign-born:
10.7% (114)
Asian - Speak another language Native:
75.0% (619)Foreign-born:
89.4% (945)
Other race - Speak another language Native:
51.9% (579)Foreign-born:
94.6% (305)
Two or more races - Speak only English Native:
66.0% (3,808)Foreign-born:
15.8% (100)
Two or more races - Speak another language Native:
26.1% (1,507)Foreign-born:
82.6% (522)
White alone - Speak only English Native:
98.6% (38,710)Foreign-born:
44.0% (204)
White alone - Speak another language Native:
1.6% (613)Foreign-born:
54.9% (254)
Hispanic or Latino - Speak only English Native:
54.3% (3,493)Foreign-born:
5.6% (81)
Hispanic or Latino - Speak another language Native:
46.1% (2,962)Foreign-born:
94.4% (1,347)
Foreign-born residents in West Allis 3,110 residents are foreign born (2.3% Latin America , 1.9% Asia , 0.8% Europe ).
This city:
5.3%Wisconsin:
5.0%
Marital status for residents in West Allis Marital status - White (Caucasian) population 15 years and over
Males 39.1% Never married43.6% Now married0.2% Separated3.3% Widowed13.9% DivorcedFemales 31.4% Never married40.1% Now married0.9% Separated9.7% Widowed17.9% DivorcedWomen who gave birth in the past 12 months Now married:
56.3% (410)Unmarried:
43.7% (318)
Women who did not give birth in the past 12 months Now married:
36.1% (2,998)Unmarried:
63.9% (5,316)
Marital status - Black or African American population 15 years and over
Males 60.1% Never married29.7% Now married2.4% Separated1.9% Widowed5.8% DivorcedFemales 60.3% Never married23.2% Now married1.5% Separated3.5% Widowed11.6% DivorcedWomen who gave birth in the past 12 months Now married:
74.4% (28)Unmarried:
25.6% (9)
Women who did not give birth in the past 12 months Now married:
27.1% (310)Unmarried:
72.9% (835)
Marital status - American Indian / Alaska Native population 15 years and over
Males 52.4% Never married24.8% Now married0.0% Separated3.8% Widowed19.0% DivorcedFemales 36.0% Never married19.1% Now married0.0% Separated0.0% Widowed44.9% DivorcedWomen who did not give birth in the past 12 months Now married:
14.7% (27)Unmarried:
85.3% (159)
Marital status - Asian population 15 years and over
Males 57.6% Never married36.1% Now married1.4% Separated1.7% Widowed3.2% DivorcedFemales 43.6% Never married51.2% Now married2.6% Separated0.0% Widowed2.6% DivorcedWomen who gave birth in the past 12 months Now married:
100.0% (39)Unmarried:
0.0% (0)
Women who did not give birth in the past 12 months Now married:
39.1% (222)Unmarried:
60.9% (345)
Marital status - Other race population 15 years and over
Males 47.6% Never married34.1% Now married7.4% Separated0.3% Widowed10.7% DivorcedFemales 56.1% Never married31.9% Now married0.0% Separated2.6% Widowed9.4% DivorcedWomen who did not give birth in the past 12 months Now married:
32.1% (154)Unmarried:
67.9% (326)
Marital status - Two or more races population 15 years and over
Males 59.6% Never married28.6% Now married1.1% Separated1.1% Widowed9.6% DivorcedFemales 43.7% Never married28.0% Now married6.1% Separated4.9% Widowed17.2% DivorcedWomen who gave birth in the past 12 months Now married:
47.4% (29)Unmarried:
52.6% (32)
Women who did not give birth in the past 12 months Now married:
32.8% (645)Unmarried:
67.2% (1,321)
Marital status - White alone, not Hispanic / Latino population 15 years and over
Males 38.9% Never married43.0% Now married0.2% Separated3.4% Widowed14.4% DivorcedFemales 30.6% Never married40.5% Now married0.7% Separated9.9% Widowed18.2% DivorcedWomen who gave birth in the past 12 months Now married:
55.3% (372)Unmarried:
44.7% (301)
Women who did not give birth in the past 12 months Now married:
36.3% (2,927)Unmarried:
63.7% (5,137)
Marital status - Hispanic or Latino population 15 years and over
Males 48.9% Never married38.1% Now married3.4% Separated0.1% Widowed9.4% DivorcedFemales 47.3% Never married31.7% Now married3.6% Separated3.6% Widowed13.7% DivorcedWomen who gave birth in the past 12 months Now married:
57.5% (63)Unmarried:
42.5% (46)
Women who did not give birth in the past 12 months Now married:
32.6% (702)Unmarried:
67.4% (1,453)
Ancestries in West Allis
6,890 24.7% German2,556 9.1% Polish1,399 5.0% American1,323 4.7% Irish838 3.0% European638 2.3% English554 2.0% Italian497 1.8% Norwegian145 0.5% Greek116 0.4% French114 0.4% Ukrainian96 0.3% Slavic93 0.3% Scottish87 0.3% Croatian86 0.3% French Canadian80 0.3% Swedish73 0.3% Czech66 0.2% Slovene66 0.2% Slovak64 0.2% Scandinavian60 0.2% Dutch58 0.2% Romanian58 0.2% Canadian50 0.2% Serbian41 0.1% Finnish28 0.1% Lithuanian28 0.1% Danish26 0.09% Portuguese25 0.09% Scotch-Irish25 0.09% Eastern European25 0.09% Swiss25 0.09% Yugoslavian18 0.06% Latvian18 0.06% Hungarian17 0.06% British14 0.05% Northern European14 0.05% Russian14 0.05% Estonian13 0.05% Assyrian13 0.05% African13 0.05% Turkish11 0.04% Iranian7 0.03% Palestinian6 0.02% Austrian4 0.01% Egyptian4 0.01% Welsh
Geographical mobility in West Allis Same house 1 year ago 36,629 87.0% White (Caucasian)2,630 74.5% Black or African American409 80.9% American Indian / Alaska Native1,611 81.7% Asian16 60.6% Native Hawaiian / Pacific Islander1,224 79.3% Other race6,666 83.2% Two or more races36,038 87.9% White alone, not Hispanic / Latino7,267 83.5% Hispanic or LatinoMoved within same county 3,825 9.1% White / Caucasian760 21.5% Black or African American65 12.9% American Indian / Alaska Native311 15.8% Asian10 37.8% Native Hawaiian / Pacific Islander301 19.5% Other race857 10.7% Two or more races3,573 8.7% White alone, not Hispanic / Latino976 11.2% Hispanic or LatinoMoved within same state 979 2.3% White / Caucasian68 1.9% Black or African American30 5.9% American Indian / Alaska Native11 0.6% Asian10 0.7% Other race159 2.0% Two or more races776 1.9% White alone, not Hispanic / Latino296 3.4% Hispanic or LatinoMoved from different state 504 1.2% White / Caucasian67 1.9% Black or African American9 0.6% Other race204 2.5% Two or more races493 1.2% White alone, not Hispanic / Latino30 0.3% Hispanic or LatinoMoved from abroad 66 0.2% White20 0.6% Black or African American2 0.2% Other race39 0.5% Two or more races45 0.1% White alone, not Hispanic / Latino48 0.6% Hispanic or Latino
Children Nativity (place of birth) in West Allis
Children under 6 years - Living with two parents Both parents native 1,926 100.0% NativeBoth parents foreign-born 188 88.5% Native24 11.5% Foreign-bornOne native, one foreign-born parent 416 100.0% NativeChildren under 6 years - Living with one parent Native parent 1,668 100.0% NativeForeign-born parent 80 100.0% NativeChildren 6 to 17 years - Living with two parents Both parents native 3,077 99.3% Native21 0.7% Foreign-bornBoth parents foreign-born 500 88.9% Native63 11.1% Foreign-bornOne native, one foreign-born parent 247 100.0% NativeChildren 6 to 17 years - Living with one parent Native parent 2,838 100.0% NativeForeign-born parent 178 48.9% Native186 51.1% Foreign-born
Grandparents responsible for own grandchildren in West Allis
Grandparents (30 to 59 years) White / Caucasian 241 51.7% Responsible for grandchildren225 48.3% Not responsible for grandchildrenAsian 44 100.0% Not responsible for grandchildrenTwo or more races 60 35.1% Responsible for grandchildren111 64.9% Not responsible for grandchildrenWhite alone, not Hispanic / Latino 325 67.2% Responsible for grandchildren159 32.8% Not responsible for grandchildrenHispanic or Latino 15 100.0% Not responsible for grandchildrenGrandparents (60 years and over) White / Caucasian 23 7.9% Responsible for grandchildren269 92.1% Not responsible for grandchildrenAsian 20 100.0% Not responsible for grandchildrenTwo or more races 62 100.0% Not responsible for grandchildrenWhite alone, not Hispanic / Latino 20 8.5% Responsible for grandchildren213 91.5% Not responsible for grandchildrenHispanic or Latino 5 5.1% Responsible for grandchildren98 94.9% Not responsible for grandchildren