Races in Westville, New Jersey (NJ) Detailed Stats Ancestries, Foreign-born residents, place of birth
Data:
Races - White alone (%)
Races - White alone (% change since 2000)
Races - Black alone (%)
Races - Black alone (% change since 2000)
Races - American Indian alone (%)
Races - American Indian alone (% change since 2000)
Races - Asian alone (%)
Races - Asian alone (% change since 2000)
Races - Hispanic (%)
Races - Hispanic (% change since 2000)
Races - Native Hawaiian and Other Pacific Islander alone (%)
Races - Native Hawaiian and Other Pacific Islander alone (% change since 2000)
Races - Two or more races(%)
Races - Two or more races(% change since 2000)
Races - Other race alone (%)
Races - Other race alone (% change since 2000)
Racial diversity
Place of birth - Born in state of residence (%)
Place of birth - Born in state of residence (%) - White
Place of birth - Born in state of residence (%) - Black or African American
Place of birth - Born in state of residence (%) - Asian
Place of birth - Born in state of residence (%) - Hispanic or Latino
Place of birth - Born in state of residence (%) - American Indian and Alaska Native
Place of birth - Born in state of residence (%) - Multirace
Place of birth - Born in state of residence (%) - Other Race
Place of birth - Born in other state (%)
Place of birth - Born in other state (%) - White
Place of birth - Born in other state (%) - Black or African American
Place of birth - Born in other state (%) - Asian
Place of birth - Born in other state (%) - Hispanic or Latino
Place of birth - Born in other state (%) - American Indian and Alaska Native
Place of birth - Born in other state (%) - Multirace
Place of birth - Born in other state (%) - Other Race
Place of birth - Native, outside of US (%)
Place of birth - Native, outside of US (%) - White
Place of birth - Native, outside of US (%) - Black or African American
Place of birth - Native, outside of US (%) - Asian
Place of birth - Native, outside of US (%) - Hispanic or Latino
Place of birth - Native, outside of US (%) - American Indian and Alaska Native
Place of birth - Native, outside of US (%) - Multirace
Place of birth - Native, outside of US (%) - Other Race
Place of birth - Foreign born (%)
Place of birth - Foreign born (%) - White
Place of birth - Foreign born (%) - Black or African American
Place of birth - Foreign born (%) - Asian
Place of birth - Foreign born (%) - Hispanic or Latino
Place of birth - Foreign born (%) - American Indian and Alaska Native
Place of birth - Foreign born (%) - Multirace
Place of birth - Foreign born (%) - Other Race
Residents speaking English at home (%)
Residents speaking English at home - Born in the United States (%)
Residents speaking English at home - Native, born elsewhere (%)
Residents speaking English at home - Foreign born (%)
Residents speaking Spanish at home (%)
Residents speaking Spanish at home - Born in the United States (%)
Residents speaking Spanish at home - Native, born elsewhere (%)
Residents speaking Spanish at home - Foreign born (%)
Residents speaking other language at home (%)
Residents speaking other language at home - Born in the United States (%)
Residents speaking other language at home - Native, born elsewhere (%)
Residents speaking other language at home - Foreign born (%)
Marital status - Never married (%)
Marital status - Now married (%)
Marital status - Separated (%)
Marital status - Widowed (%)
Marital status - Divorced (%)
Ancestries Reported - Arab (%)
Ancestries Reported - Czech (%)
Ancestries Reported - Danish (%)
Ancestries Reported - Dutch (%)
Ancestries Reported - English (%)
Ancestries Reported - French (%)
Ancestries Reported - French Canadian (%)
Ancestries Reported - German (%)
Ancestries Reported - Greek (%)
Ancestries Reported - Hungarian (%)
Ancestries Reported - Irish (%)
Ancestries Reported - Italian (%)
Ancestries Reported - Lithuanian (%)
Ancestries Reported - Norwegian (%)
Ancestries Reported - Polish (%)
Ancestries Reported - Portuguese (%)
Ancestries Reported - Russian (%)
Ancestries Reported - Scotch-Irish (%)
Ancestries Reported - Scottish (%)
Ancestries Reported - Slovak (%)
Ancestries Reported - Subsaharan African (%)
Ancestries Reported - Swedish (%)
Ancestries Reported - Swiss (%)
Ancestries Reported - Ukrainian (%)
Ancestries Reported - United States (%)
Ancestries Reported - Welsh (%)
Ancestries Reported - West Indian (%)
Ancestries Reported - Other (%)
Geographical mobility - Same house 1 year ago (%)
Geographical mobility - Same house 1 year ago (%) - White
Geographical mobility - Same house 1 year ago (%) - Black or African American
Geographical mobility - Same house 1 year ago (%) - Asian
Geographical mobility - Same house 1 year ago (%) - Hispanic or Latino
Geographical mobility - Same house 1 year ago (%) - American Indian and Alaska Native
Geographical mobility - Same house 1 year ago (%) - Multirace
Geographical mobility - Same house 1 year ago (%) - Other Race
Geographical mobility - Moved within same county (%)
Geographical mobility - Moved within same county (%) - White
Geographical mobility - Moved within same county (%) - Black or African American
Geographical mobility - Moved within same county (%) - Asian
Geographical mobility - Moved within same county (%) - Hispanic or Latino
Geographical mobility - Moved within same county (%) - American Indian and Alaska Native
Geographical mobility - Moved within same county (%) - Multirace
Geographical mobility - Moved within same county (%) - Other Race
Geographical mobility - Moved from different county within same state (%)
Geographical mobility - Moved from different county within same state (%) - White
Geographical mobility - Moved from different county within same state (%) - Black or African American
Geographical mobility - Moved from different county within same state (%) - Asian
Geographical mobility - Moved from different county within same state (%) - Hispanic or Latino
Geographical mobility - Moved from different county within same state (%) - American Indian and Alaska Native
Geographical mobility - Moved from different county within same state (%) - Multirace
Geographical mobility - Moved from different county within same state (%) - Other Race
Geographical mobility - Moved from different state (%)
Geographical mobility - Moved from different state (%) - White
Geographical mobility - Moved from different state (%) - Black or African American
Geographical mobility - Moved from different state (%) - Asian
Geographical mobility - Moved from different state (%) - Hispanic or Latino
Geographical mobility - Moved from different state (%) - American Indian and Alaska Native
Geographical mobility - Moved from different state (%) - Multirace
Geographical mobility - Moved from different state (%) - Other Race
Geographical mobility - Moved from abroad (%)
Geographical mobility - Moved from abroad (%) - White
Geographical mobility - Moved from abroad (%) - Black or African American
Geographical mobility - Moved from abroad (%) - Asian
Geographical mobility - Moved from abroad (%) - Hispanic or Latino
Geographical mobility - Moved from abroad (%) - American Indian and Alaska Native
Geographical mobility - Moved from abroad (%) - Multirace
Geographical mobility - Moved from abroad (%) - Other Race
Place of birth for the foreign-born population - Ireland (%)
Place of birth for the foreign-born population - Denmark (%)
Place of birth for the foreign-born population - Norway (%)
Place of birth for the foreign-born population - Sweden (%)
Place of birth for the foreign-born population - United Kingdom (%)
Place of birth for the foreign-born population - England (%)
Place of birth for the foreign-born population - Scotland (%)
Place of birth for the foreign-born population - Other Northern Europe (%)
Place of birth for the foreign-born population - Austria (%)
Place of birth for the foreign-born population - Belgium (%)
Place of birth for the foreign-born population - France (%)
Place of birth for the foreign-born population - Germany (%)
Place of birth for the foreign-born population - Netherlands (%)
Place of birth for the foreign-born population - Switzerland (%)
Place of birth for the foreign-born population - Other Western Europe (%)
Place of birth for the foreign-born population - Greece (%)
Place of birth for the foreign-born population - Italy (%)
Place of birth for the foreign-born population - Portugal (%)
Place of birth for the foreign-born population - Spain (%)
Place of birth for the foreign-born population - Other Southern Europe (%)
Place of birth for the foreign-born population - Albania (%)
Place of birth for the foreign-born population - Belarus (%)
Place of birth for the foreign-born population - Bosnia and Herzegovina (%)
Place of birth for the foreign-born population - Bulgaria (%)
Place of birth for the foreign-born population - Croatia (%)
Place of birth for the foreign-born population - Czechoslovakia (%)
Place of birth for the foreign-born population - Hungary (%)
Place of birth for the foreign-born population - Latvia (%)
Place of birth for the foreign-born population - Lithuania (%)
Place of birth for the foreign-born population - North Macedonia (Macedonia) (%)
Place of birth for the foreign-born population - Moldova (%)
Place of birth for the foreign-born population - Poland (%)
Place of birth for the foreign-born population - Romania (%)
Place of birth for the foreign-born population - Russia (%)
Place of birth for the foreign-born population - Serbia (%)
Place of birth for the foreign-born population - Ukraine (%)
Place of birth for the foreign-born population - Other Eastern Europe (%)
Place of birth for the foreign-born population - China (%)
Place of birth for the foreign-born population - Hong Kong (%)
Place of birth for the foreign-born population - Taiwan (%)
Place of birth for the foreign-born population - Japan (%)
Place of birth for the foreign-born population - Korea (%)
Place of birth for the foreign-born population - Other Eastern Asia (%)
Place of birth for the foreign-born population - Afghanistan (%)
Place of birth for the foreign-born population - Bangladesh (%)
Place of birth for the foreign-born population - India (%)
Place of birth for the foreign-born population - Iran (%)
Place of birth for the foreign-born population - Kazakhstan (%)
Place of birth for the foreign-born population - Nepal (%)
Place of birth for the foreign-born population - Pakistan (%)
Place of birth for the foreign-born population - Sri Lanka (%)
Place of birth for the foreign-born population - Uzbekistan (%)
Place of birth for the foreign-born population - Other South Central Asia (%)
Place of birth for the foreign-born population - Burma (%)
Place of birth for the foreign-born population - Cambodia (%)
Place of birth for the foreign-born population - Indonesia (%)
Place of birth for the foreign-born population - Laos (%)
Place of birth for the foreign-born population - Malaysia (%)
Place of birth for the foreign-born population - Philippines (%)
Place of birth for the foreign-born population - Singapore (%)
Place of birth for the foreign-born population - Thailand (%)
Place of birth for the foreign-born population - Vietnam (%)
Place of birth for the foreign-born population - Other South Eastern Asia (%)
Place of birth for the foreign-born population - Armenia (%)
Place of birth for the foreign-born population - Iraq (%)
Place of birth for the foreign-born population - Israel (%)
Place of birth for the foreign-born population - Jordan (%)
Place of birth for the foreign-born population - Kuwait (%)
Place of birth for the foreign-born population - Lebanon (%)
Place of birth for the foreign-born population - Saudi Arabia (%)
Place of birth for the foreign-born population - Syria (%)
Place of birth for the foreign-born population - Turkey (%)
Place of birth for the foreign-born population - Yemen (%)
Place of birth for the foreign-born population - Other Western Asia (%)
Place of birth for the foreign-born population - Eritrea (%)
Place of birth for the foreign-born population - Ethiopia (%)
Place of birth for the foreign-born population - Kenya (%)
Place of birth for the foreign-born population - Somalia (%)
Place of birth for the foreign-born population - Uganda (%)
Place of birth for the foreign-born population - Zimbabwe (%)
Place of birth for the foreign-born population - Other Eastern Africa (%)
Place of birth for the foreign-born population - Cameroon (%)
Place of birth for the foreign-born population - Congo (%)
Place of birth for the foreign-born population - Democratic Republic of Congo (Zaire) (%)
Place of birth for the foreign-born population - Other Middle Africa (%)
Place of birth for the foreign-born population - Egypt (%)
Place of birth for the foreign-born population - Morocco (%)
Place of birth for the foreign-born population - Sudan (%)
Place of birth for the foreign-born population - Other Northern Africa (%)
Place of birth for the foreign-born population - South Africa (%)
Place of birth for the foreign-born population - Other Southern Africa (%)
Place of birth for the foreign-born population - Cabo Verde (%)
Place of birth for the foreign-born population - Ghana (%)
Place of birth for the foreign-born population - Liberia (%)
Place of birth for the foreign-born population - Nigeria (%)
Place of birth for the foreign-born population - Senegal (%)
Place of birth for the foreign-born population - Sierra Leone (%)
Place of birth for the foreign-born population - Other Western Africa (%)
Place of birth for the foreign-born population - Australia (%)
Place of birth for the foreign-born population - New Zealand (%)
Place of birth for the foreign-born population - Fiji (%)
Place of birth for the foreign-born population - Micronesia (%)
Place of birth for the foreign-born population - Bahamas (%)
Place of birth for the foreign-born population - Barbados (%)
Place of birth for the foreign-born population - Cuba (%)
Place of birth for the foreign-born population - Dominica (%)
Place of birth for the foreign-born population - Dominican Republic (%)
Place of birth for the foreign-born population - Grenada (%)
Place of birth for the foreign-born population - Haiti (%)
Place of birth for the foreign-born population - Jamaica (%)
Place of birth for the foreign-born population - St. Vincent and the Grenadines (%)
Place of birth for the foreign-born population - Trinidad and Tobago (%)
Place of birth for the foreign-born population - West Indies (%)
Place of birth for the foreign-born population - Other Caribbean (%)
Place of birth for the foreign-born population - Belize (%)
Place of birth for the foreign-born population - Costa Rica (%)
Place of birth for the foreign-born population - El Salvador (%)
Place of birth for the foreign-born population - Guatemala (%)
Place of birth for the foreign-born population - Honduras (%)
Place of birth for the foreign-born population - Mexico (%)
Place of birth for the foreign-born population - Nicaragua (%)
Place of birth for the foreign-born population - Panama (%)
Place of birth for the foreign-born population - Other Central America (%)
Place of birth for the foreign-born population - Argentina (%)
Place of birth for the foreign-born population - Bolivia (%)
Place of birth for the foreign-born population - Brazil (%)
Place of birth for the foreign-born population - Chile (%)
Place of birth for the foreign-born population - Colombia (%)
Place of birth for the foreign-born population - Ecuador (%)
Place of birth for the foreign-born population - Guyana (%)
Place of birth for the foreign-born population - Peru (%)
Place of birth for the foreign-born population - Uruguay (%)
Place of birth for the foreign-born population - Venezuela (%)
Place of birth for the foreign-born population - Other South America (%)
Place of birth for the foreign-born population - Canada (%)
Place of birth for the foreign-born population - Other Northern America (%)
Place of birth for the foreign-born population - Other (%)
Latest news about races in Westville, NJ collected exclusively by city-data.com from local newspapers, TV, and radio stations
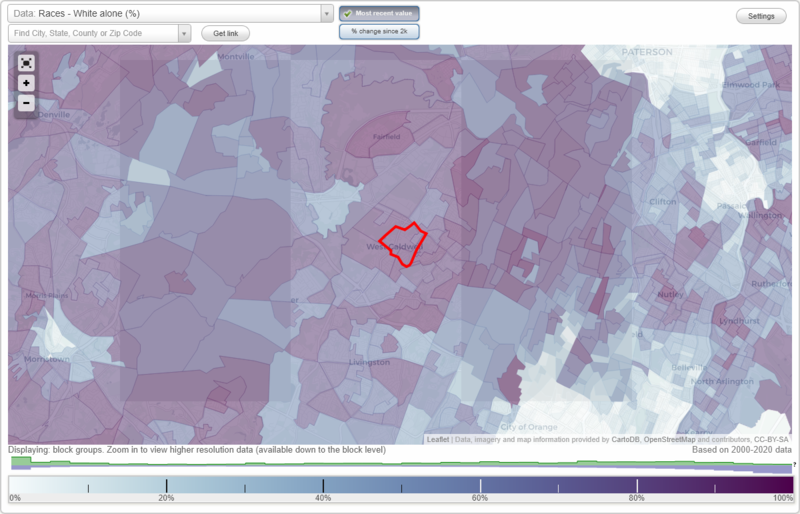
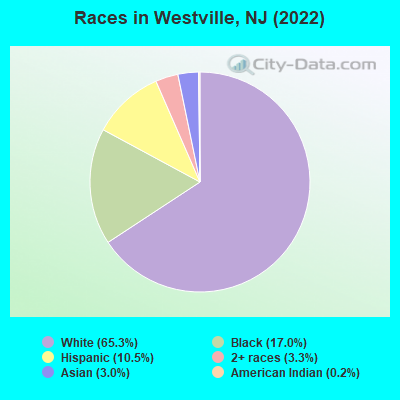
According to 2022 data, the most numerous races in Westville, NJ are White alone (2,829 residents), Hispanic (457 residents), and Black alone (737 residents). 87.6% of Westville residents speak English at home. 7.7% of Westville, NJ residents are foreign-born (2.9% born in Latin America, 2.6% born in Asia, 1.0% born in Africa), which is 199.2% less than the foreign-born rate of 23.0% across the entire state of New Jersey.
Race distribution in Westville
2000
2022
5,557,209 66.0% White alone
1,117,191 13.3% Hispanic
1,096,171 13.0% Black alone
477,012 5.7% Asian alone
133,689 1.6% Two or more races
19,565 0.2% Other race alone
11,338 0.1% American Indian alone
2,175 0.03% Native Hawaiian and Other Pacific Islander alone
4,766,476 51.5% White alone
2,028,470 21.9% Hispanic
1,111,632 12.0% Black alone
923,546 10.0% Asian alone
332,237 3.6% Two or more races
89,847 1.0% Other race alone
8,557 0.09% American Indian alone
934 0.01% Native Hawaiian and Other Pacific Islander alone
Income and house value in Westville Median household income in 2022 $92,147 White non-Hispanic householders
$15,498 Black householders
$24,854 Asian householders
$35,848 Hispanic or Latino race householders
Median 2022 house value $189,604 White Non-Hispanic householders
$155,413 Black or African American householders
$233,120 Asian householders
$186,496 Two or more races householders
$233,120 Hispanic or Latino householders
Median age by race in Westville
47.3 Median age for White residents47.7 Males44.2 Females34.0 Median age for Black or African American residents27.9 Males35.5 Females57.2 Median age for American Indian / Alaska Native residents-670,465,336.5 Males-688,298,917.7 Females46.2 Median age for Asian residents48.3 Males-690,598,289.9 Females-804,177,544.9 Median age for Native Hawaiian / Pacific Islander residents-666,666,666.0 Males-666,666,666.0 Females33.0 Median age for Other race residents26.8 Males26.7 Females43.0 Median age for Two or more races residents43.7 Males12.8 Females50.9 Median age for White alone residents48.7 Males50.7 Females24.0 Median age for Hispanic or Latino residents25.2 Males22.0 Females
Owner/renter occupied households by race in Westville
House owners and renters - White residents 982 79.0% Owner occupied261 21.0% Renter occupiedHouse owners and renters - Black or African American residents 57 17.8% Owner occupied265 82.2% Renter occupiedHouse owners and renters - American Indian / Alaska Native residents 19 54.2% Owner occupied16 45.8% Renter occupiedHouse owners and renters - Asian residents 20 17.6% Owner occupied96 82.4% Renter occupiedHouse owners and renters - Other race residents 33 72.8% Owner occupied12 27.2% Renter occupiedHouse owners and renters - Two or more races residents 17 14.2% Owner occupied105 85.8% Renter occupiedHouse owners and renters - White alone residents 976 82.0% Owner occupied214 18.0% Renter occupiedHouse owners and renters - Hispanic or Latino residents 89 56.8% Owner occupied68 43.2% Renter occupied
Language usage in Westville
English speakers - Total 87.6% of residents of Westville speak English at home.
5.6% of residents speak Spanish at home 124 56.4% Speak English very well96 43.6% Speak English less than very well6.9% of residents speak other language at home 149 55.0% Speak English very well122 45.0% Speak English less than very well
English speakers - Born in the United States 92.4% of residents of Westville speak English at home.
5.4% of residents speak Spanish at home 58 100.0% Speak English very well1.9% of residents speak other language at home 21 100.0% Speak English very well
English speakers - Native, born elsewhere 43.5% of residents of Westville speak English at home.
67.7% of residents speak Spanish at home 42 100.0% Speak English less than very well
English speakers - Foreign-born 25.8% of residents of Westville speak English at home.
23.5% of residents speak Spanish at home 48 56.5% Speak English very well37 43.5% Speak English less than very well51.8% of residents speak other language at home 65 34.8% Speak English very well122 65.2% Speak English less than very well
White (Caucasian) - Speak only English Native:
96.3% (2,523)Foreign-born:
43.1% (43)
White (Caucasian) - Speak another language Native:
3.3% (87)Foreign-born:
58.9% (59)
Black or African American - Speak only English Native:
99.5% (548)Foreign-born:
50.6% (41)
Black or African American - Speak another language Native:
1.3% (7)Foreign-born:
42.1% (35)
American Indian / Alaska Native - Speak only English Native:
74.7% (11)Foreign-born:
65.9% (26)
Asian - Speak only English Native:
100.0% (39)Foreign-born:
0.6% (1)
Two or more races - Speak another language Native:
13.7% (27)Foreign-born:
96.4% (44)
White alone - Speak only English Native:
96.9% (2,466)Foreign-born:
48.9% (31)
White alone - Speak another language Native:
3.0% (77)Foreign-born:
51.5% (33)
Hispanic or Latino - Speak only English Native:
60.6% (189)Foreign-born:
29.2% (33)
Hispanic or Latino - Speak another language Native:
39.5% (123)Foreign-born:
73.5% (84)
Foreign-born residents in Westville 333 residents are foreign born (2.9% Latin America , 2.6% Asia , 1.0% Africa ).
This city:
7.7%New Jersey:
23.2%
Marital status for residents in Westville Marital status - White (Caucasian) population 15 years and over
Males 30.6% Never married52.5% Now married1.0% Separated2.4% Widowed13.4% DivorcedFemales 31.2% Never married41.9% Now married1.7% Separated13.4% Widowed11.8% DivorcedWomen who gave birth in the past 12 months Now married:
86.8% (76)Unmarried:
13.2% (12)
Women who did not give birth in the past 12 months Now married:
27.7% (153)Unmarried:
72.3% (399)
Marital status - Black or African American population 15 years and over
Males 36.7% Never married18.6% Now married27.7% Separated0.0% Widowed17.0% DivorcedFemales 55.2% Never married11.2% Now married0.0% Separated6.2% Widowed27.4% DivorcedWomen who gave birth in the past 12 months Now married:
0.0% (0)Unmarried:
100.0% (61)
Women who did not give birth in the past 12 months Now married:
0.0% (0)Unmarried:
100.0% (101)
Marital status - American Indian / Alaska Native population 15 years and over
Males 43.5% Never married56.5% Now married0.0% Separated0.0% Widowed0.0% DivorcedFemales 0.0% Never married100.0% Now married0.0% Separated0.0% Widowed0.0% DivorcedMarital status - Asian population 15 years and over
Males 80.6% Never married14.7% Now married4.7% Separated0.0% Widowed0.0% DivorcedFemales 100.0% Never married0.0% Now married0.0% Separated0.0% Widowed0.0% DivorcedWomen who did not give birth in the past 12 months Now married:
0.0% (0)Unmarried:
100.0% (12)
Marital status - Other race population 15 years and over
Males 74.6% Never married25.4% Now married0.0% Separated0.0% Widowed0.0% DivorcedFemales 38.5% Never married38.5% Now married0.0% Separated0.0% Widowed23.1% DivorcedWomen who did not give birth in the past 12 months Now married:
50.0% (19)Unmarried:
50.0% (19)
Marital status - Two or more races population 15 years and over
Males 68.9% Never married31.1% Now married0.0% Separated0.0% Widowed0.0% DivorcedFemales 0.0% Never married78.6% Now married0.0% Separated0.0% Widowed21.4% DivorcedWomen who did not give birth in the past 12 months Now married:
100.0% (19)Unmarried:
0.0% (0)
Marital status - White alone, not Hispanic / Latino population 15 years and over
Males 29.7% Never married52.7% Now married1.1% Separated2.5% Widowed14.0% DivorcedFemales 27.6% Never married44.7% Now married1.9% Separated13.3% Widowed12.6% DivorcedWomen who gave birth in the past 12 months Now married:
86.8% (77)Unmarried:
13.2% (12)
Women who did not give birth in the past 12 months Now married:
31.9% (155)Unmarried:
68.1% (330)
Marital status - Hispanic or Latino population 15 years and over
Males 48.3% Never married51.7% Now married0.0% Separated0.0% Widowed0.0% DivorcedFemales 59.1% Never married26.0% Now married0.0% Separated9.1% Widowed5.8% DivorcedWomen who did not give birth in the past 12 months Now married:
22.2% (31)Unmarried:
77.8% (108)
Ancestries in Westville
177 10.6% Irish
164 9.8% German
79 4.7% Italian
70 4.2% American
57 3.4% Polish
49 2.9% European
36 2.2% African
30 1.8% Jamaican
24 1.4% English
21 1.3% Greek
21 1.3% Scottish
7 0.4% Dutch
7 0.4% Hungarian
7 0.4% Norwegian
3 0.2% Swiss
Children Nativity (place of birth) in Westville
Children under 6 years - Living with two parents Both parents native 162 100.0% NativeOne native, one foreign-born parent 49 100.0% NativeChildren under 6 years - Living with one parent Native parent 181 100.0% NativeForeign-born parent 17 100.0% NativeChildren 6 to 17 years - Living with two parents Both parents native 177 100.0% NativeBoth parents foreign-born 19 100.0% NativeOne native, one foreign-born parent 52 100.0% NativeChildren 6 to 17 years - Living with one parent Native parent 193 100.0% NativeForeign-born parent 26 51.1% Native25 48.9% Foreign-born
Grandparents responsible for own grandchildren in Westville
Grandparents (30 to 59 years) White / Caucasian 26 100.0% Not responsible for grandchildrenWhite alone, not Hispanic / Latino 34 100.0% Not responsible for grandchildrenGrandparents (60 years and over) White / Caucasian 7 10.0% Responsible for grandchildren63 90.0% Not responsible for grandchildrenWhite alone, not Hispanic / Latino 7 10.0% Responsible for grandchildren64 90.0% Not responsible for grandchildren