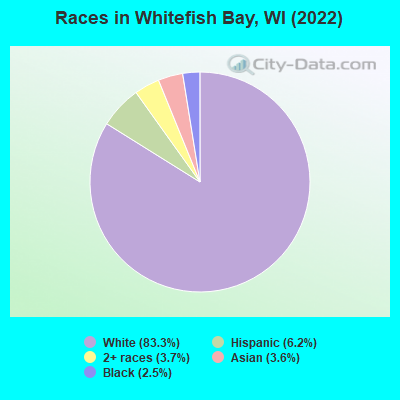
Races in Whitefish Bay, Wisconsin (WI) Detailed Stats
Data:
Races - White alone (%)
Races - White alone (% change since 2000)
Races - Black alone (%)
Races - Black alone (% change since 2000)
Races - American Indian alone (%)
Races - American Indian alone (% change since 2000)
Races - Asian alone (%)
Races - Asian alone (% change since 2000)
Races - Hispanic (%)
Races - Hispanic (% change since 2000)
Races - Native Hawaiian and Other Pacific Islander alone (%)
Races - Native Hawaiian and Other Pacific Islander alone (% change since 2000)
Races - Two or more races(%)
Races - Two or more races(% change since 2000)
Races - Other race alone (%)
Races - Other race alone (% change since 2000)
Racial diversity
Place of birth - Born in state of residence (%)
Place of birth - Born in state of residence (%) - White
Place of birth - Born in state of residence (%) - Black or African American
Place of birth - Born in state of residence (%) - Asian
Place of birth - Born in state of residence (%) - Hispanic or Latino
Place of birth - Born in state of residence (%) - American Indian and Alaska Native
Place of birth - Born in state of residence (%) - Multirace
Place of birth - Born in state of residence (%) - Other Race
Place of birth - Born in other state (%)
Place of birth - Born in other state (%) - White
Place of birth - Born in other state (%) - Black or African American
Place of birth - Born in other state (%) - Asian
Place of birth - Born in other state (%) - Hispanic or Latino
Place of birth - Born in other state (%) - American Indian and Alaska Native
Place of birth - Born in other state (%) - Multirace
Place of birth - Born in other state (%) - Other Race
Place of birth - Native, outside of US (%)
Place of birth - Native, outside of US (%) - White
Place of birth - Native, outside of US (%) - Black or African American
Place of birth - Native, outside of US (%) - Asian
Place of birth - Native, outside of US (%) - Hispanic or Latino
Place of birth - Native, outside of US (%) - American Indian and Alaska Native
Place of birth - Native, outside of US (%) - Multirace
Place of birth - Native, outside of US (%) - Other Race
Place of birth - Foreign born (%)
Place of birth - Foreign born (%) - White
Place of birth - Foreign born (%) - Black or African American
Place of birth - Foreign born (%) - Asian
Place of birth - Foreign born (%) - Hispanic or Latino
Place of birth - Foreign born (%) - American Indian and Alaska Native
Place of birth - Foreign born (%) - Multirace
Place of birth - Foreign born (%) - Other Race
Residents speaking English at home (%)
Residents speaking English at home - Born in the United States (%)
Residents speaking English at home - Native, born elsewhere (%)
Residents speaking English at home - Foreign born (%)
Residents speaking Spanish at home (%)
Residents speaking Spanish at home - Born in the United States (%)
Residents speaking Spanish at home - Native, born elsewhere (%)
Residents speaking Spanish at home - Foreign born (%)
Residents speaking other language at home (%)
Residents speaking other language at home - Born in the United States (%)
Residents speaking other language at home - Native, born elsewhere (%)
Residents speaking other language at home - Foreign born (%)
Marital status - Never married (%)
Marital status - Now married (%)
Marital status - Separated (%)
Marital status - Widowed (%)
Marital status - Divorced (%)
Ancestries Reported - Arab (%)
Ancestries Reported - Czech (%)
Ancestries Reported - Danish (%)
Ancestries Reported - Dutch (%)
Ancestries Reported - English (%)
Ancestries Reported - French (%)
Ancestries Reported - French Canadian (%)
Ancestries Reported - German (%)
Ancestries Reported - Greek (%)
Ancestries Reported - Hungarian (%)
Ancestries Reported - Irish (%)
Ancestries Reported - Italian (%)
Ancestries Reported - Lithuanian (%)
Ancestries Reported - Norwegian (%)
Ancestries Reported - Polish (%)
Ancestries Reported - Portuguese (%)
Ancestries Reported - Russian (%)
Ancestries Reported - Scotch-Irish (%)
Ancestries Reported - Scottish (%)
Ancestries Reported - Slovak (%)
Ancestries Reported - Subsaharan African (%)
Ancestries Reported - Swedish (%)
Ancestries Reported - Swiss (%)
Ancestries Reported - Ukrainian (%)
Ancestries Reported - United States (%)
Ancestries Reported - Welsh (%)
Ancestries Reported - West Indian (%)
Ancestries Reported - Other (%)
Geographical mobility - Same house 1 year ago (%)
Geographical mobility - Same house 1 year ago (%) - White
Geographical mobility - Same house 1 year ago (%) - Black or African American
Geographical mobility - Same house 1 year ago (%) - Asian
Geographical mobility - Same house 1 year ago (%) - Hispanic or Latino
Geographical mobility - Same house 1 year ago (%) - American Indian and Alaska Native
Geographical mobility - Same house 1 year ago (%) - Multirace
Geographical mobility - Same house 1 year ago (%) - Other Race
Geographical mobility - Moved within same county (%)
Geographical mobility - Moved within same county (%) - White
Geographical mobility - Moved within same county (%) - Black or African American
Geographical mobility - Moved within same county (%) - Asian
Geographical mobility - Moved within same county (%) - Hispanic or Latino
Geographical mobility - Moved within same county (%) - American Indian and Alaska Native
Geographical mobility - Moved within same county (%) - Multirace
Geographical mobility - Moved within same county (%) - Other Race
Geographical mobility - Moved from different county within same state (%)
Geographical mobility - Moved from different county within same state (%) - White
Geographical mobility - Moved from different county within same state (%) - Black or African American
Geographical mobility - Moved from different county within same state (%) - Asian
Geographical mobility - Moved from different county within same state (%) - Hispanic or Latino
Geographical mobility - Moved from different county within same state (%) - American Indian and Alaska Native
Geographical mobility - Moved from different county within same state (%) - Multirace
Geographical mobility - Moved from different county within same state (%) - Other Race
Geographical mobility - Moved from different state (%)
Geographical mobility - Moved from different state (%) - White
Geographical mobility - Moved from different state (%) - Black or African American
Geographical mobility - Moved from different state (%) - Asian
Geographical mobility - Moved from different state (%) - Hispanic or Latino
Geographical mobility - Moved from different state (%) - American Indian and Alaska Native
Geographical mobility - Moved from different state (%) - Multirace
Geographical mobility - Moved from different state (%) - Other Race
Geographical mobility - Moved from abroad (%)
Geographical mobility - Moved from abroad (%) - White
Geographical mobility - Moved from abroad (%) - Black or African American
Geographical mobility - Moved from abroad (%) - Asian
Geographical mobility - Moved from abroad (%) - Hispanic or Latino
Geographical mobility - Moved from abroad (%) - American Indian and Alaska Native
Geographical mobility - Moved from abroad (%) - Multirace
Geographical mobility - Moved from abroad (%) - Other Race
Place of birth for the foreign-born population - Ireland (%)
Place of birth for the foreign-born population - Denmark (%)
Place of birth for the foreign-born population - Norway (%)
Place of birth for the foreign-born population - Sweden (%)
Place of birth for the foreign-born population - United Kingdom (%)
Place of birth for the foreign-born population - England (%)
Place of birth for the foreign-born population - Scotland (%)
Place of birth for the foreign-born population - Other Northern Europe (%)
Place of birth for the foreign-born population - Austria (%)
Place of birth for the foreign-born population - Belgium (%)
Place of birth for the foreign-born population - France (%)
Place of birth for the foreign-born population - Germany (%)
Place of birth for the foreign-born population - Netherlands (%)
Place of birth for the foreign-born population - Switzerland (%)
Place of birth for the foreign-born population - Other Western Europe (%)
Place of birth for the foreign-born population - Greece (%)
Place of birth for the foreign-born population - Italy (%)
Place of birth for the foreign-born population - Portugal (%)
Place of birth for the foreign-born population - Spain (%)
Place of birth for the foreign-born population - Other Southern Europe (%)
Place of birth for the foreign-born population - Albania (%)
Place of birth for the foreign-born population - Belarus (%)
Place of birth for the foreign-born population - Bosnia and Herzegovina (%)
Place of birth for the foreign-born population - Bulgaria (%)
Place of birth for the foreign-born population - Croatia (%)
Place of birth for the foreign-born population - Czechoslovakia (%)
Place of birth for the foreign-born population - Hungary (%)
Place of birth for the foreign-born population - Latvia (%)
Place of birth for the foreign-born population - Lithuania (%)
Place of birth for the foreign-born population - North Macedonia (Macedonia) (%)
Place of birth for the foreign-born population - Moldova (%)
Place of birth for the foreign-born population - Poland (%)
Place of birth for the foreign-born population - Romania (%)
Place of birth for the foreign-born population - Russia (%)
Place of birth for the foreign-born population - Serbia (%)
Place of birth for the foreign-born population - Ukraine (%)
Place of birth for the foreign-born population - Other Eastern Europe (%)
Place of birth for the foreign-born population - China (%)
Place of birth for the foreign-born population - Hong Kong (%)
Place of birth for the foreign-born population - Taiwan (%)
Place of birth for the foreign-born population - Japan (%)
Place of birth for the foreign-born population - Korea (%)
Place of birth for the foreign-born population - Other Eastern Asia (%)
Place of birth for the foreign-born population - Afghanistan (%)
Place of birth for the foreign-born population - Bangladesh (%)
Place of birth for the foreign-born population - India (%)
Place of birth for the foreign-born population - Iran (%)
Place of birth for the foreign-born population - Kazakhstan (%)
Place of birth for the foreign-born population - Nepal (%)
Place of birth for the foreign-born population - Pakistan (%)
Place of birth for the foreign-born population - Sri Lanka (%)
Place of birth for the foreign-born population - Uzbekistan (%)
Place of birth for the foreign-born population - Other South Central Asia (%)
Place of birth for the foreign-born population - Burma (%)
Place of birth for the foreign-born population - Cambodia (%)
Place of birth for the foreign-born population - Indonesia (%)
Place of birth for the foreign-born population - Laos (%)
Place of birth for the foreign-born population - Malaysia (%)
Place of birth for the foreign-born population - Philippines (%)
Place of birth for the foreign-born population - Singapore (%)
Place of birth for the foreign-born population - Thailand (%)
Place of birth for the foreign-born population - Vietnam (%)
Place of birth for the foreign-born population - Other South Eastern Asia (%)
Place of birth for the foreign-born population - Armenia (%)
Place of birth for the foreign-born population - Iraq (%)
Place of birth for the foreign-born population - Israel (%)
Place of birth for the foreign-born population - Jordan (%)
Place of birth for the foreign-born population - Kuwait (%)
Place of birth for the foreign-born population - Lebanon (%)
Place of birth for the foreign-born population - Saudi Arabia (%)
Place of birth for the foreign-born population - Syria (%)
Place of birth for the foreign-born population - Turkey (%)
Place of birth for the foreign-born population - Yemen (%)
Place of birth for the foreign-born population - Other Western Asia (%)
Place of birth for the foreign-born population - Eritrea (%)
Place of birth for the foreign-born population - Ethiopia (%)
Place of birth for the foreign-born population - Kenya (%)
Place of birth for the foreign-born population - Somalia (%)
Place of birth for the foreign-born population - Uganda (%)
Place of birth for the foreign-born population - Zimbabwe (%)
Place of birth for the foreign-born population - Other Eastern Africa (%)
Place of birth for the foreign-born population - Cameroon (%)
Place of birth for the foreign-born population - Congo (%)
Place of birth for the foreign-born population - Democratic Republic of Congo (Zaire) (%)
Place of birth for the foreign-born population - Other Middle Africa (%)
Place of birth for the foreign-born population - Egypt (%)
Place of birth for the foreign-born population - Morocco (%)
Place of birth for the foreign-born population - Sudan (%)
Place of birth for the foreign-born population - Other Northern Africa (%)
Place of birth for the foreign-born population - South Africa (%)
Place of birth for the foreign-born population - Other Southern Africa (%)
Place of birth for the foreign-born population - Cabo Verde (%)
Place of birth for the foreign-born population - Ghana (%)
Place of birth for the foreign-born population - Liberia (%)
Place of birth for the foreign-born population - Nigeria (%)
Place of birth for the foreign-born population - Senegal (%)
Place of birth for the foreign-born population - Sierra Leone (%)
Place of birth for the foreign-born population - Other Western Africa (%)
Place of birth for the foreign-born population - Australia (%)
Place of birth for the foreign-born population - New Zealand (%)
Place of birth for the foreign-born population - Fiji (%)
Place of birth for the foreign-born population - Micronesia (%)
Place of birth for the foreign-born population - Bahamas (%)
Place of birth for the foreign-born population - Barbados (%)
Place of birth for the foreign-born population - Cuba (%)
Place of birth for the foreign-born population - Dominica (%)
Place of birth for the foreign-born population - Dominican Republic (%)
Place of birth for the foreign-born population - Grenada (%)
Place of birth for the foreign-born population - Haiti (%)
Place of birth for the foreign-born population - Jamaica (%)
Place of birth for the foreign-born population - St. Vincent and the Grenadines (%)
Place of birth for the foreign-born population - Trinidad and Tobago (%)
Place of birth for the foreign-born population - West Indies (%)
Place of birth for the foreign-born population - Other Caribbean (%)
Place of birth for the foreign-born population - Belize (%)
Place of birth for the foreign-born population - Costa Rica (%)
Place of birth for the foreign-born population - El Salvador (%)
Place of birth for the foreign-born population - Guatemala (%)
Place of birth for the foreign-born population - Honduras (%)
Place of birth for the foreign-born population - Mexico (%)
Place of birth for the foreign-born population - Nicaragua (%)
Place of birth for the foreign-born population - Panama (%)
Place of birth for the foreign-born population - Other Central America (%)
Place of birth for the foreign-born population - Argentina (%)
Place of birth for the foreign-born population - Bolivia (%)
Place of birth for the foreign-born population - Brazil (%)
Place of birth for the foreign-born population - Chile (%)
Place of birth for the foreign-born population - Colombia (%)
Place of birth for the foreign-born population - Ecuador (%)
Place of birth for the foreign-born population - Guyana (%)
Place of birth for the foreign-born population - Peru (%)
Place of birth for the foreign-born population - Uruguay (%)
Place of birth for the foreign-born population - Venezuela (%)
Place of birth for the foreign-born population - Other South America (%)
Place of birth for the foreign-born population - Canada (%)
Place of birth for the foreign-born population - Other Northern America (%)
Place of birth for the foreign-born population - Other (%)
According to 2022 data, the most numerous races in Whitefish Bay, WI are White alone (12,141 residents), Hispanic (908 residents), and Black alone (368 residents). 91.7% of Whitefish Bay residents speak English at home. 5.9% of Whitefish Bay, WI residents are foreign-born (2.4% born in Asia, 2.4% born in Europe, 1.0% born in Latin America), which is 15.9% greater than the foreign-born rate of 5.0% across the entire state of Wisconsin.
Race distribution in Whitefish Bay
2000 2022
4,681,630 87.3% White alone 300,245 5.6% Black alone 192,921 3.6% Hispanic 87,995 1.6% Asian alone 51,921 1.0% Two or more races 43,980 0.8% American Indian alone 3,637 0.07% Other race alone 1,346 0.03% Native Hawaiian and Other
4,654,031 79.0% White alone 447,022 7.6% Hispanic 345,678 5.9% Black alone 217,532 3.7% Two or more races 172,242 2.9% Asian alone 33,762 0.6% American Indian alone 19,680 0.3% Other race alone 2,592 0.04% Native Hawaiian and Other
Income and house value in Whitefish Bay Median household income in 2022 $141,998 White non-Hispanic householders$34,793 Black householders$132,340 Asian householders$140,326 Two or more races householdersover $200,000 Hispanic or Latino race householdersMedian 2022 house value $512,646 White Non-Hispanic householders$590,002 Black or African American householders$360,556 American Indian or Alaska Native householders $129,013 Asian householders$721,113 Some other race householders$355,836 Two or more races householders$385,205 Hispanic or Latino householders
Median age by race in Whitefish Bay
43.0 Median age for White residents41.8 44.7 16.4 Median age for Black or African American residents16.8 16.0 -699,907,663.2 Median age for American Indian / Alaska Native residents-833,824,974.6 -627,763,040.9 43.0 Median age for Asian residents42.6 43.2 -825,688,072.6 Median age for Native Hawaiian / Pacific Islander residents-862,745,097.2 -732,444,443.7 13.4 Median age for Other race residents47.0 13.2 16.6 Median age for Two or more races residents14.5 17.9 42.7 Median age for White alone residents41.7 44.0 15.1 Median age for Hispanic or Latino residents15.0 15.2
Owner/renter occupied households by race in Whitefish Bay
House owners and renters - White residents 4,179 84.7% Owner occupied756 15.3% Renter occupiedHouse owners and renters - Black or African American residents 80 100.0% Renter occupiedHouse owners and renters - Asian residents 116 70.3% Owner occupied49 29.7% Renter occupiedHouse owners and renters - Other race residents 32 100.0% Owner occupiedHouse owners and renters - Two or more races residents 98 38.2% Owner occupied158 61.8% Renter occupiedHouse owners and renters - White alone residents 4,228 84.9% Owner occupied755 15.1% Renter occupiedHouse owners and renters - Hispanic or Latino residents 104 71.7% Owner occupied41 28.3% Renter occupied
Language usage in Whitefish Bay
English speakers - Total 91.7% of residents of Whitefish Bay speak English at home.
2.5% of residents speak Spanish at home 311 90.9% Speak English very well31 9.1% Speak English less than very well5.4% of residents speak other language at home 646 87.8% Speak English very well90 12.2% Speak English less than very well
English speakers - Born in the United States 94.2% of residents of Whitefish Bay speak English at home.
1.5% of residents speak Spanish at home 54 74.0% Speak English very well19 26.0% Speak English less than very well3.5% of residents speak other language at home 167 100.0% Speak English very well
English speakers - Native, born elsewhere 75.8% of residents of Whitefish Bay speak English at home.
33.2% of residents speak Spanish at home 74 100.0% Speak English very well
English speakers - Foreign-born 38.4% of residents of Whitefish Bay speak English at home.
6.2% of residents speak Spanish at home 55 100.0% Speak English very well51.3% of residents speak other language at home 366 80.1% Speak English very well91 19.9% Speak English less than very well
White (Caucasian) - Speak only English Native:
98.6% (10,796)Foreign-born:
44.0% (103)
White (Caucasian) - Speak another language Native:
2.3% (256)Foreign-born:
60.7% (142)
Asian - Speak only English Native:
79.7% (143)Foreign-born:
40.7% (136)
Asian - Speak another language Native:
17.7% (32)Foreign-born:
57.2% (191)
Other race - Speak only English Native:
100.0% (114)Foreign-born:
89.1% (52)
Other race - Speak another language Native:
9.7% (11)Foreign-born:
50.2% (30)
Two or more races - Speak only English Native:
70.1% (633)Foreign-born:
40.7% (25)
Two or more races - Speak another language Native:
19.3% (174)Foreign-born:
53.8% (34)
White alone - Speak only English Native:
97.1% (10,672)Foreign-born:
26.6% (76)
White alone - Speak another language Native:
2.8% (308)Foreign-born:
73.7% (211)
Hispanic or Latino - Speak only English Native:
85.3% (592)Foreign-born:
55.2% (107)
Hispanic or Latino - Speak another language Native:
16.0% (111)Foreign-born:
51.0% (98)
Foreign-born residents in Whitefish Bay 867 residents are foreign born (2.4% Asia , 2.4% Europe , 1.0% Latin America ).
This city:
5.9%Wisconsin:
5.0%
Marital status for residents in Whitefish Bay Marital status - White (Caucasian) population 15 years and over
Males 20.7% Never married72.4% Now married0.0% Separated1.5% Widowed5.4% DivorcedFemales 23.2% Never married62.7% Now married2.6% Separated3.8% Widowed7.7% DivorcedWomen who gave birth in the past 12 months Now married:
100.0% (92)Unmarried:
0.0% (0)
Women who did not give birth in the past 12 months Now married:
59.1% (1,497)Unmarried:
40.9% (1,036)
Marital status - Black or African American population 15 years and over
Males 68.5% Never married21.7% Now married9.8% Separated0.0% Widowed0.0% DivorcedFemales 33.1% Never married57.6% Now married0.0% Separated5.9% Widowed3.4% DivorcedWomen who gave birth in the past 12 months Now married:
0.0% (0)Unmarried:
100.0% (9)
Women who did not give birth in the past 12 months Now married:
66.7% (65)Unmarried:
33.3% (32)
Marital status - Asian population 15 years and over
Males 32.9% Never married67.1% Now married0.0% Separated0.0% Widowed0.0% DivorcedFemales 8.9% Never married91.1% Now married0.0% Separated0.0% Widowed0.0% DivorcedWomen who gave birth in the past 12 months Now married:
100.0% (9)Unmarried:
0.0% (0)
Women who did not give birth in the past 12 months Now married:
87.5% (122)Unmarried:
12.5% (17)
Marital status - Other race population 15 years and over
Males 0.0% Never married100.0% Now married0.0% Separated0.0% Widowed0.0% DivorcedFemales 24.2% Never married64.5% Now married0.0% Separated0.0% Widowed11.3% DivorcedWomen who did not give birth in the past 12 months Now married:
68.8% (19)Unmarried:
31.3% (9)
Marital status - Two or more races population 15 years and over
Males 64.4% Never married35.6% Now married0.0% Separated0.0% Widowed0.0% DivorcedFemales 28.6% Never married44.2% Now married0.0% Separated0.0% Widowed27.2% DivorcedWomen who did not give birth in the past 12 months Now married:
45.1% (141)Unmarried:
54.9% (172)
Marital status - White alone, not Hispanic / Latino population 15 years and over
Males 19.9% Never married73.0% Now married0.0% Separated1.5% Widowed5.6% DivorcedFemales 22.4% Never married63.2% Now married2.6% Separated3.9% Widowed7.8% DivorcedWomen who gave birth in the past 12 months Now married:
100.0% (97)Unmarried:
0.0% (0)
Women who did not give birth in the past 12 months Now married:
60.6% (1,563)Unmarried:
39.4% (1,014)
Marital status - Hispanic or Latino population 15 years and over
Males 38.6% Never married61.4% Now married0.0% Separated0.0% Widowed0.0% DivorcedFemales 32.5% Never married61.9% Now married0.0% Separated0.0% Widowed5.5% DivorcedWomen who did not give birth in the past 12 months Now married:
51.0% (101)Unmarried:
49.0% (97)
Ancestries in Whitefish Bay
1,147 19.8% German483 8.4% Irish453 7.8% English317 5.5% Polish300 5.2% European198 3.4% American184 3.2% Italian151 2.6% French148 2.6% Russian136 2.4% Norwegian128 2.2% Romanian117 2.0% Scotch-Irish108 1.9% Dutch65 1.1% Eastern European48 0.8% Greek41 0.7% Swedish38 0.7% Belgian35 0.6% Scottish33 0.6% Czech32 0.6% Bulgarian32 0.6% Scandinavian22 0.4% Ukrainian20 0.3% Northern European18 0.3% British18 0.3% Slovene16 0.3% Danish16 0.3% Hungarian12 0.2% Swiss11 0.2% Slovak9 0.2% Luxembourger8 0.1% Finnish8 0.1% French Canadian8 0.1% Welsh7 0.1% Lebanese7 0.1% Turkish7 0.1% Latvian6 0.1% Austrian4 0.07% African4 0.07% Serbian3 0.05% Lithuanian
Children Nativity (place of birth) in Whitefish Bay
Children under 6 years - Living with two parents Both parents native 1,168 99.1% Native10 0.9% Foreign-bornBoth parents foreign-born 15 100.0% NativeOne native, one foreign-born parent 72 100.0% NativeChildren under 6 years - Living with one parent Native parent 9 100.0% NativeChildren 6 to 17 years - Living with two parents Both parents native 1,959 98.8% Native23 1.2% Foreign-bornBoth parents foreign-born 249 92.6% Native20 7.4% Foreign-bornOne native, one foreign-born parent 164 100.0% NativeChildren 6 to 17 years - Living with one parent Native parent 726 100.0% NativeForeign-born parent 66 52.5% Native59 47.5% Foreign-born
Grandparents responsible for own grandchildren in Whitefish Bay
Grandparents (30 to 59 years) White / Caucasian 1 100.0% Not responsible for grandchildrenBlack or African American 8 100.0% Not responsible for grandchildrenWhite alone, not Hispanic / Latino 1 90.1% Not responsible for grandchildren
Grandparents (60 years and over)