Races in Whiteman AFB, Missouri (MO) Detailed Stats
Data:
Races - White alone (%)
Races - White alone (% change since 2000)
Races - Black alone (%)
Races - Black alone (% change since 2000)
Races - American Indian alone (%)
Races - American Indian alone (% change since 2000)
Races - Asian alone (%)
Races - Asian alone (% change since 2000)
Races - Hispanic (%)
Races - Hispanic (% change since 2000)
Races - Native Hawaiian and Other Pacific Islander alone (%)
Races - Native Hawaiian and Other Pacific Islander alone (% change since 2000)
Races - Two or more races(%)
Races - Two or more races(% change since 2000)
Races - Other race alone (%)
Races - Other race alone (% change since 2000)
Racial diversity
Place of birth - Born in state of residence (%)
Place of birth - Born in state of residence (%) - White
Place of birth - Born in state of residence (%) - Black or African American
Place of birth - Born in state of residence (%) - Asian
Place of birth - Born in state of residence (%) - Hispanic or Latino
Place of birth - Born in state of residence (%) - American Indian and Alaska Native
Place of birth - Born in state of residence (%) - Multirace
Place of birth - Born in state of residence (%) - Other Race
Place of birth - Born in other state (%)
Place of birth - Born in other state (%) - White
Place of birth - Born in other state (%) - Black or African American
Place of birth - Born in other state (%) - Asian
Place of birth - Born in other state (%) - Hispanic or Latino
Place of birth - Born in other state (%) - American Indian and Alaska Native
Place of birth - Born in other state (%) - Multirace
Place of birth - Born in other state (%) - Other Race
Place of birth - Native, outside of US (%)
Place of birth - Native, outside of US (%) - White
Place of birth - Native, outside of US (%) - Black or African American
Place of birth - Native, outside of US (%) - Asian
Place of birth - Native, outside of US (%) - Hispanic or Latino
Place of birth - Native, outside of US (%) - American Indian and Alaska Native
Place of birth - Native, outside of US (%) - Multirace
Place of birth - Native, outside of US (%) - Other Race
Place of birth - Foreign born (%)
Place of birth - Foreign born (%) - White
Place of birth - Foreign born (%) - Black or African American
Place of birth - Foreign born (%) - Asian
Place of birth - Foreign born (%) - Hispanic or Latino
Place of birth - Foreign born (%) - American Indian and Alaska Native
Place of birth - Foreign born (%) - Multirace
Place of birth - Foreign born (%) - Other Race
Residents speaking English at home (%)
Residents speaking English at home - Born in the United States (%)
Residents speaking English at home - Native, born elsewhere (%)
Residents speaking English at home - Foreign born (%)
Residents speaking Spanish at home (%)
Residents speaking Spanish at home - Born in the United States (%)
Residents speaking Spanish at home - Native, born elsewhere (%)
Residents speaking Spanish at home - Foreign born (%)
Residents speaking other language at home (%)
Residents speaking other language at home - Born in the United States (%)
Residents speaking other language at home - Native, born elsewhere (%)
Residents speaking other language at home - Foreign born (%)
Marital status - Never married (%)
Marital status - Now married (%)
Marital status - Separated (%)
Marital status - Widowed (%)
Marital status - Divorced (%)
Ancestries Reported - Arab (%)
Ancestries Reported - Czech (%)
Ancestries Reported - Danish (%)
Ancestries Reported - Dutch (%)
Ancestries Reported - English (%)
Ancestries Reported - French (%)
Ancestries Reported - French Canadian (%)
Ancestries Reported - German (%)
Ancestries Reported - Greek (%)
Ancestries Reported - Hungarian (%)
Ancestries Reported - Irish (%)
Ancestries Reported - Italian (%)
Ancestries Reported - Lithuanian (%)
Ancestries Reported - Norwegian (%)
Ancestries Reported - Polish (%)
Ancestries Reported - Portuguese (%)
Ancestries Reported - Russian (%)
Ancestries Reported - Scotch-Irish (%)
Ancestries Reported - Scottish (%)
Ancestries Reported - Slovak (%)
Ancestries Reported - Subsaharan African (%)
Ancestries Reported - Swedish (%)
Ancestries Reported - Swiss (%)
Ancestries Reported - Ukrainian (%)
Ancestries Reported - United States (%)
Ancestries Reported - Welsh (%)
Ancestries Reported - West Indian (%)
Ancestries Reported - Other (%)
Geographical mobility - Same house 1 year ago (%)
Geographical mobility - Same house 1 year ago (%) - White
Geographical mobility - Same house 1 year ago (%) - Black or African American
Geographical mobility - Same house 1 year ago (%) - Asian
Geographical mobility - Same house 1 year ago (%) - Hispanic or Latino
Geographical mobility - Same house 1 year ago (%) - American Indian and Alaska Native
Geographical mobility - Same house 1 year ago (%) - Multirace
Geographical mobility - Same house 1 year ago (%) - Other Race
Geographical mobility - Moved within same county (%)
Geographical mobility - Moved within same county (%) - White
Geographical mobility - Moved within same county (%) - Black or African American
Geographical mobility - Moved within same county (%) - Asian
Geographical mobility - Moved within same county (%) - Hispanic or Latino
Geographical mobility - Moved within same county (%) - American Indian and Alaska Native
Geographical mobility - Moved within same county (%) - Multirace
Geographical mobility - Moved within same county (%) - Other Race
Geographical mobility - Moved from different county within same state (%)
Geographical mobility - Moved from different county within same state (%) - White
Geographical mobility - Moved from different county within same state (%) - Black or African American
Geographical mobility - Moved from different county within same state (%) - Asian
Geographical mobility - Moved from different county within same state (%) - Hispanic or Latino
Geographical mobility - Moved from different county within same state (%) - American Indian and Alaska Native
Geographical mobility - Moved from different county within same state (%) - Multirace
Geographical mobility - Moved from different county within same state (%) - Other Race
Geographical mobility - Moved from different state (%)
Geographical mobility - Moved from different state (%) - White
Geographical mobility - Moved from different state (%) - Black or African American
Geographical mobility - Moved from different state (%) - Asian
Geographical mobility - Moved from different state (%) - Hispanic or Latino
Geographical mobility - Moved from different state (%) - American Indian and Alaska Native
Geographical mobility - Moved from different state (%) - Multirace
Geographical mobility - Moved from different state (%) - Other Race
Geographical mobility - Moved from abroad (%)
Geographical mobility - Moved from abroad (%) - White
Geographical mobility - Moved from abroad (%) - Black or African American
Geographical mobility - Moved from abroad (%) - Asian
Geographical mobility - Moved from abroad (%) - Hispanic or Latino
Geographical mobility - Moved from abroad (%) - American Indian and Alaska Native
Geographical mobility - Moved from abroad (%) - Multirace
Geographical mobility - Moved from abroad (%) - Other Race
Place of birth for the foreign-born population - Ireland (%)
Place of birth for the foreign-born population - Denmark (%)
Place of birth for the foreign-born population - Norway (%)
Place of birth for the foreign-born population - Sweden (%)
Place of birth for the foreign-born population - United Kingdom (%)
Place of birth for the foreign-born population - England (%)
Place of birth for the foreign-born population - Scotland (%)
Place of birth for the foreign-born population - Other Northern Europe (%)
Place of birth for the foreign-born population - Austria (%)
Place of birth for the foreign-born population - Belgium (%)
Place of birth for the foreign-born population - France (%)
Place of birth for the foreign-born population - Germany (%)
Place of birth for the foreign-born population - Netherlands (%)
Place of birth for the foreign-born population - Switzerland (%)
Place of birth for the foreign-born population - Other Western Europe (%)
Place of birth for the foreign-born population - Greece (%)
Place of birth for the foreign-born population - Italy (%)
Place of birth for the foreign-born population - Portugal (%)
Place of birth for the foreign-born population - Spain (%)
Place of birth for the foreign-born population - Other Southern Europe (%)
Place of birth for the foreign-born population - Albania (%)
Place of birth for the foreign-born population - Belarus (%)
Place of birth for the foreign-born population - Bosnia and Herzegovina (%)
Place of birth for the foreign-born population - Bulgaria (%)
Place of birth for the foreign-born population - Croatia (%)
Place of birth for the foreign-born population - Czechoslovakia (%)
Place of birth for the foreign-born population - Hungary (%)
Place of birth for the foreign-born population - Latvia (%)
Place of birth for the foreign-born population - Lithuania (%)
Place of birth for the foreign-born population - North Macedonia (Macedonia) (%)
Place of birth for the foreign-born population - Moldova (%)
Place of birth for the foreign-born population - Poland (%)
Place of birth for the foreign-born population - Romania (%)
Place of birth for the foreign-born population - Russia (%)
Place of birth for the foreign-born population - Serbia (%)
Place of birth for the foreign-born population - Ukraine (%)
Place of birth for the foreign-born population - Other Eastern Europe (%)
Place of birth for the foreign-born population - China (%)
Place of birth for the foreign-born population - Hong Kong (%)
Place of birth for the foreign-born population - Taiwan (%)
Place of birth for the foreign-born population - Japan (%)
Place of birth for the foreign-born population - Korea (%)
Place of birth for the foreign-born population - Other Eastern Asia (%)
Place of birth for the foreign-born population - Afghanistan (%)
Place of birth for the foreign-born population - Bangladesh (%)
Place of birth for the foreign-born population - India (%)
Place of birth for the foreign-born population - Iran (%)
Place of birth for the foreign-born population - Kazakhstan (%)
Place of birth for the foreign-born population - Nepal (%)
Place of birth for the foreign-born population - Pakistan (%)
Place of birth for the foreign-born population - Sri Lanka (%)
Place of birth for the foreign-born population - Uzbekistan (%)
Place of birth for the foreign-born population - Other South Central Asia (%)
Place of birth for the foreign-born population - Burma (%)
Place of birth for the foreign-born population - Cambodia (%)
Place of birth for the foreign-born population - Indonesia (%)
Place of birth for the foreign-born population - Laos (%)
Place of birth for the foreign-born population - Malaysia (%)
Place of birth for the foreign-born population - Philippines (%)
Place of birth for the foreign-born population - Singapore (%)
Place of birth for the foreign-born population - Thailand (%)
Place of birth for the foreign-born population - Vietnam (%)
Place of birth for the foreign-born population - Other South Eastern Asia (%)
Place of birth for the foreign-born population - Armenia (%)
Place of birth for the foreign-born population - Iraq (%)
Place of birth for the foreign-born population - Israel (%)
Place of birth for the foreign-born population - Jordan (%)
Place of birth for the foreign-born population - Kuwait (%)
Place of birth for the foreign-born population - Lebanon (%)
Place of birth for the foreign-born population - Saudi Arabia (%)
Place of birth for the foreign-born population - Syria (%)
Place of birth for the foreign-born population - Turkey (%)
Place of birth for the foreign-born population - Yemen (%)
Place of birth for the foreign-born population - Other Western Asia (%)
Place of birth for the foreign-born population - Eritrea (%)
Place of birth for the foreign-born population - Ethiopia (%)
Place of birth for the foreign-born population - Kenya (%)
Place of birth for the foreign-born population - Somalia (%)
Place of birth for the foreign-born population - Uganda (%)
Place of birth for the foreign-born population - Zimbabwe (%)
Place of birth for the foreign-born population - Other Eastern Africa (%)
Place of birth for the foreign-born population - Cameroon (%)
Place of birth for the foreign-born population - Congo (%)
Place of birth for the foreign-born population - Democratic Republic of Congo (Zaire) (%)
Place of birth for the foreign-born population - Other Middle Africa (%)
Place of birth for the foreign-born population - Egypt (%)
Place of birth for the foreign-born population - Morocco (%)
Place of birth for the foreign-born population - Sudan (%)
Place of birth for the foreign-born population - Other Northern Africa (%)
Place of birth for the foreign-born population - South Africa (%)
Place of birth for the foreign-born population - Other Southern Africa (%)
Place of birth for the foreign-born population - Cabo Verde (%)
Place of birth for the foreign-born population - Ghana (%)
Place of birth for the foreign-born population - Liberia (%)
Place of birth for the foreign-born population - Nigeria (%)
Place of birth for the foreign-born population - Senegal (%)
Place of birth for the foreign-born population - Sierra Leone (%)
Place of birth for the foreign-born population - Other Western Africa (%)
Place of birth for the foreign-born population - Australia (%)
Place of birth for the foreign-born population - New Zealand (%)
Place of birth for the foreign-born population - Fiji (%)
Place of birth for the foreign-born population - Micronesia (%)
Place of birth for the foreign-born population - Bahamas (%)
Place of birth for the foreign-born population - Barbados (%)
Place of birth for the foreign-born population - Cuba (%)
Place of birth for the foreign-born population - Dominica (%)
Place of birth for the foreign-born population - Dominican Republic (%)
Place of birth for the foreign-born population - Grenada (%)
Place of birth for the foreign-born population - Haiti (%)
Place of birth for the foreign-born population - Jamaica (%)
Place of birth for the foreign-born population - St. Vincent and the Grenadines (%)
Place of birth for the foreign-born population - Trinidad and Tobago (%)
Place of birth for the foreign-born population - West Indies (%)
Place of birth for the foreign-born population - Other Caribbean (%)
Place of birth for the foreign-born population - Belize (%)
Place of birth for the foreign-born population - Costa Rica (%)
Place of birth for the foreign-born population - El Salvador (%)
Place of birth for the foreign-born population - Guatemala (%)
Place of birth for the foreign-born population - Honduras (%)
Place of birth for the foreign-born population - Mexico (%)
Place of birth for the foreign-born population - Nicaragua (%)
Place of birth for the foreign-born population - Panama (%)
Place of birth for the foreign-born population - Other Central America (%)
Place of birth for the foreign-born population - Argentina (%)
Place of birth for the foreign-born population - Bolivia (%)
Place of birth for the foreign-born population - Brazil (%)
Place of birth for the foreign-born population - Chile (%)
Place of birth for the foreign-born population - Colombia (%)
Place of birth for the foreign-born population - Ecuador (%)
Place of birth for the foreign-born population - Guyana (%)
Place of birth for the foreign-born population - Peru (%)
Place of birth for the foreign-born population - Uruguay (%)
Place of birth for the foreign-born population - Venezuela (%)
Place of birth for the foreign-born population - Other South America (%)
Place of birth for the foreign-born population - Canada (%)
Place of birth for the foreign-born population - Other Northern America (%)
Place of birth for the foreign-born population - Other (%)
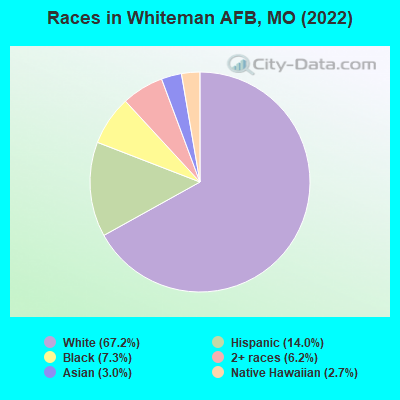
According to 2022 data, the most numerous races in Whiteman AFB, MO are White alone (2,780 residents), Black alone (303 residents), and Two or more races (255 residents). 84.8% of Whiteman AFB residents speak English at home. 8.5% of Whiteman AFB, MO residents are foreign-born (3.2% born in Asia, 2.2% born in Oceania, 1.3% born in Latin America, 1.3% born in Europe), which is 53.1% greater than the foreign-born rate of 4.0% across the entire state of Missouri.
Race distribution in Whiteman AFB
2000 2022
4,686,474 83.8% White alone 625,667 11.2% Black alone 118,592 2.1% Hispanic 71,905 1.3% Two or more races 61,041 1.1% Asian alone 23,302 0.4% American Indian alone 5,291 0.09% Other race alone 2,939 0.05% Native Hawaiian and Other
4,733,411 76.6% White alone 656,739 10.6% Black alone 316,300 5.1% Two or more races 291,763 4.7% Hispanic 132,436 2.1% Asian alone 27,467 0.4% Other race alone 12,313 0.2% American Indian alone 7,528 0.1% Native Hawaiian and Other
Income and house value in Whiteman AFB Median household income in 2022 $56,885 White non-Hispanic householders$71,274 Black householders$61,336 Asian householders$82,770 Two or more races householders$77,606 Hispanic or Latino race householders
Median age by race in Whiteman AFB
22.6 Median age for White residents22.6 22.6 21.3 Median age for Black or African American residents21.0 14.7 20.4 Median age for American Indian / Alaska Native residents22.0 -576,856,648.8 34.0 Median age for Asian residents31.6 36.3 32.8 Median age for Native Hawaiian / Pacific Islander residents-683,513,838.1 -752,136,751.4 24.1 Median age for Other race residents-694,252,872.9 23.7 22.5 Median age for Two or more races residents20.7 24.3 22.5 Median age for White alone residents22.6 22.4 22.9 Median age for Hispanic or Latino residents21.3 23.2
Owner/renter occupied households by race in Whiteman AFB
House owners and renters - White residents 29 3.5% Owner occupied804 96.5% Renter occupiedHouse owners and renters - Black or African American residents 44 100.0% Renter occupiedHouse owners and renters - American Indian / Alaska Native residents 1 100.0% Renter occupiedHouse owners and renters - Asian residents 32 100.0% Renter occupiedHouse owners and renters - Native Hawaiian / Pacific Islander residents 27 100.0% Renter occupiedHouse owners and renters - Other race residents 9 100.0% Renter occupiedHouse owners and renters - Two or more races residents 135 100.0% Renter occupiedHouse owners and renters - White alone residents 29 3.6% Owner occupied781 96.4% Renter occupiedHouse owners and renters - Hispanic or Latino residents 104 100.0% Renter occupied
Language usage in Whiteman AFB
English speakers - Total 84.8% of residents of Whiteman AFB speak English at home.
5.7% of residents speak Spanish at home 158 75.6% Speak English very well51 24.4% Speak English less than very well9.5% of residents speak other language at home 192 55.5% Speak English very well154 44.5% Speak English less than very well
English speakers - Born in the United States 93.3% of residents of Whiteman AFB speak English at home.
4.2% of residents speak Spanish at home 105 92.1% Speak English very well9 7.9% Speak English less than very well2.5% of residents speak other language at home 61 89.7% Speak English very well7 10.3% Speak English less than very well
English speakers - Native, born elsewhere 55.1% of residents of Whiteman AFB speak English at home.
19.6% of residents speak Spanish at home 21 100.0% Speak English very well18.7% of residents speak other language at home 20 100.0% Speak English very well
English speakers - Foreign-born 13.0% of residents of Whiteman AFB speak English at home.
21.2% of residents speak Spanish at home 32 42.7% Speak English very well43 57.3% Speak English less than very well66.0% of residents speak other language at home 87 37.3% Speak English very well146 62.7% Speak English less than very well
White (Caucasian) - Speak only English Native:
94.9% (2,464)Foreign-born:
35.3% (23)
White (Caucasian) - Speak another language Native:
4.7% (123)Foreign-born:
64.8% (41)
Black or African American - Speak another language Native:
6.8% (18)Foreign-born:
99.5% (34)
Asian - Speak only English Native:
100.0% (12)Foreign-born:
18.9% (21)
Native Hawaiian / Pacific Islander - Speak another language Native:
61.6% (18)Foreign-born:
94.6% (61)
Two or more races - Speak another language Native:
30.4% (103)Foreign-born:
100.0% (66)
White alone - Speak only English Native:
96.7% (2,378)Foreign-born:
87.5% (7)
Hispanic or Latino - Speak only English Native:
72.7% (300)Foreign-born:
21.9% (21)
Hispanic or Latino - Speak another language Native:
27.6% (114)Foreign-born:
78.7% (77)
Foreign-born residents in Whiteman AFB 353 residents are foreign born (3.2% Asia , 2.2% Oceania , 1.3% Latin America , 1.3% Europe ).
This city:
8.5%Missouri:
4.2%
Marital status for residents in Whiteman AFB Marital status - White (Caucasian) population 15 years and over
Males 44.2% Never married53.6% Now married0.0% Separated0.0% Widowed2.3% DivorcedFemales 11.8% Never married84.1% Now married2.4% Separated0.0% Widowed1.7% DivorcedWomen who gave birth in the past 12 months Now married:
100.0% (160)Unmarried:
0.0% (0)
Women who did not give birth in the past 12 months Now married:
83.6% (617)Unmarried:
16.4% (121)
Marital status - Black or African American population 15 years and over
Males 81.1% Never married18.9% Now married0.0% Separated0.0% Widowed0.0% DivorcedFemales 36.0% Never married64.0% Now married0.0% Separated0.0% Widowed0.0% DivorcedWomen who did not give birth in the past 12 months Now married:
64.0% (15)Unmarried:
36.0% (8)
Marital status - Asian population 15 years and over
Males 34.1% Never married65.9% Now married0.0% Separated0.0% Widowed0.0% DivorcedFemales 17.2% Never married82.8% Now married0.0% Separated0.0% Widowed0.0% DivorcedWomen who gave birth in the past 12 months Now married:
100.0% (10)Unmarried:
0.0% (0)
Women who did not give birth in the past 12 months Now married:
80.0% (48)Unmarried:
20.0% (12)
Marital status - Native Hawaiian / Pacific Islander population 15 years and over
Males 100.0% Never married0.0% Now married0.0% Separated0.0% Widowed0.0% DivorcedFemales 100.0% Never married0.0% Now married0.0% Separated0.0% Widowed0.0% DivorcedWomen who did not give birth in the past 12 months Now married:
0.0% (0)Unmarried:
100.0% (24)
Marital status - Other race population 15 years and over
Males 0.0% Never married100.0% Now married0.0% Separated0.0% Widowed0.0% DivorcedFemales 0.0% Never married100.0% Now married0.0% Separated0.0% Widowed0.0% DivorcedWomen who did not give birth in the past 12 months Now married:
100.0% (55)Unmarried:
0.0% (0)
Marital status - Two or more races population 15 years and over
Males 58.5% Never married41.5% Now married0.0% Separated0.0% Widowed0.0% DivorcedFemales 22.0% Never married78.0% Now married0.0% Separated0.0% Widowed0.0% DivorcedWomen who gave birth in the past 12 months Now married:
100.0% (37)Unmarried:
0.0% (0)
Women who did not give birth in the past 12 months Now married:
71.4% (90)Unmarried:
28.6% (36)
Marital status - White alone, not Hispanic / Latino population 15 years and over
Males 43.1% Never married54.5% Now married0.0% Separated0.0% Widowed2.4% DivorcedFemales 7.8% Never married87.4% Now married2.8% Separated0.0% Widowed2.0% DivorcedWomen who gave birth in the past 12 months Now married:
100.0% (161)Unmarried:
0.0% (0)
Women who did not give birth in the past 12 months Now married:
87.7% (549)Unmarried:
12.3% (77)
Marital status - Hispanic or Latino population 15 years and over
Males 55.9% Never married44.1% Now married0.0% Separated0.0% Widowed0.0% DivorcedFemales 20.6% Never married79.4% Now married0.0% Separated0.0% Widowed0.0% DivorcedWomen who gave birth in the past 12 months Now married:
100.0% (13)Unmarried:
0.0% (0)
Women who did not give birth in the past 12 months Now married:
78.4% (198)Unmarried:
21.6% (55)
Ancestries in Whiteman AFB
186 12.6% European149 10.1% German112 7.6% Irish57 3.9% English34 2.3% French Canadian31 2.1% American23 1.6% Polish21 1.4% Scottish19 1.3% Italian9 0.6% Hungarian3 0.2% Norwegian
Children Nativity (place of birth) in Whiteman AFB
Children under 6 years - Living with two parents Both parents native 486 100.0% NativeBoth parents foreign-born 19 100.0% NativeOne native, one foreign-born parent 7 100.0% NativeChildren under 6 years - Living with one parent Native parent 52 100.0% NativeChildren 6 to 17 years - Living with two parents Both parents native 317 97.4% Native8 2.6% Foreign-bornBoth parents foreign-born 13 52.0% Native12 48.0% Foreign-bornOne native, one foreign-born parent 118 100.0% NativeChildren 6 to 17 years - Living with one parent Native parent 66 100.0% NativeForeign-born parent 28 51.6% Native26 48.4% Foreign-born
Grandparents responsible for own grandchildren in Whiteman AFB
Grandparents (30 to 59 years) White / Caucasian 43 100.0% Not responsible for grandchildrenWhite alone, not Hispanic / Latino 43 100.0% Not responsible for grandchildren
Grandparents (60 years and over)