Races in Woodstock, New Hampshire (NH) Detailed Stats
Ancestries, Foreign-born residents, place of birth

Recent posts about races in Woodstock, New Hampshire on our local forum with over 2,400,000 registered users:
 | Tiny house living possible in NH? (18 replies) |
| Why are houses cheaper in NH than in VT? (13 replies) |
| Relocating from FL to NH (65 replies) |
| relocating to lebanon/hanover area (5 replies) |
| propane users: do you own or "lease" your tank? (17 replies) |
| N. H. doesn't exist anymore (92 replies) |
Latest news about races in Woodstock, NH collected exclusively by city-data.com from local newspapers, TV, and radio stations
2.7% of Woodstock, NH residents are foreign-born (1.0% born in Asia, 0.6% born in Europe, 0.6% born in North America, 0.4% born in Latin America), which is 83.7% less than the foreign-born rate of 5.0% across the entire state of New Hampshire.
Race distribution in Woodstock

- 1,10597.0%White alone
- 171.5%Two or more races
- 80.7%Hispanic
- 40.4%American Indian alone
- 20.2%Asian alone
- 20.2%Other race alone
- 10.09%Black alone

2000
2022
-
- 1,175,25295.1%White alone
- 20,4891.7%Hispanic
- 15,8031.3%Asian alone
- 11,6060.9%Two or more races
- 8,3540.7%Black alone
- 2,6980.2%American Indian alone
- 1,2540.1%Other race alone
- 3300.03%Native Hawaiian and Other
Pacific Islander alone

-
- 1,208,10186.6%White alone
- 63,4794.5%Hispanic
- 60,7244.4%Two or more races
- 36,5192.6%Asian alone
- 17,9311.3%Black alone
- 6,6150.5%Other race alone
- 1,0140.07%American Indian alone
- 8480.06%Native Hawaiian and Other
Pacific Islander alone

Income and house value in Woodstock
- Median household income in 2022
- $69,651White non-Hispanic householders
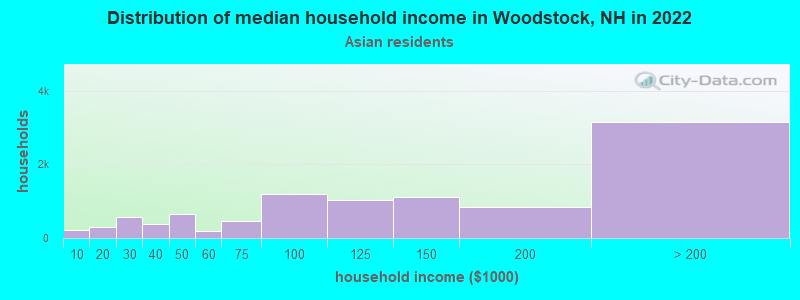
- $179,087Asian householders
- $83,219Two or more races householders
- $55,904Hispanic or Latino race householders
- Median 2022 house value
- $301,084White Non-Hispanic householders
- $271,679Two or more races householders
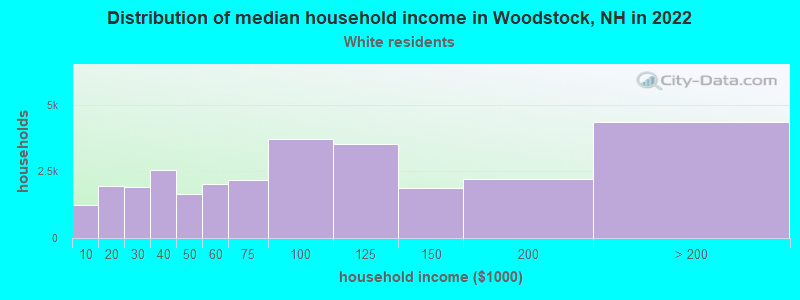
Household income for White non-Hispanic householders
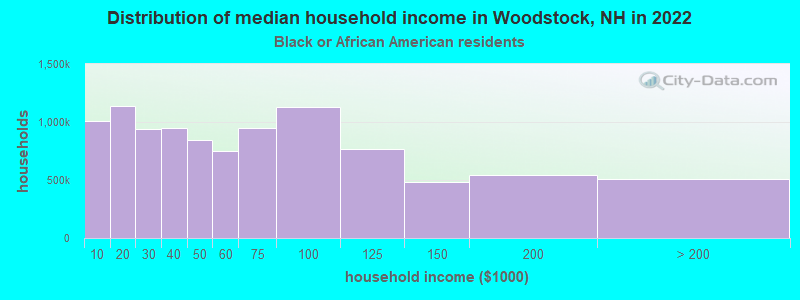
Household income for Black householders
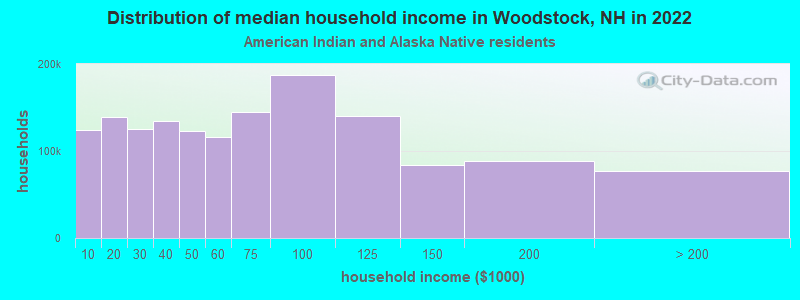
Household income for American Indian and Alaska Native householders
Household income for Asian householders
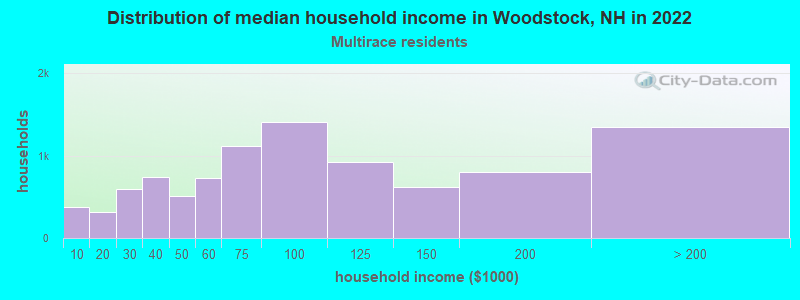
Household income for Two or more races householders
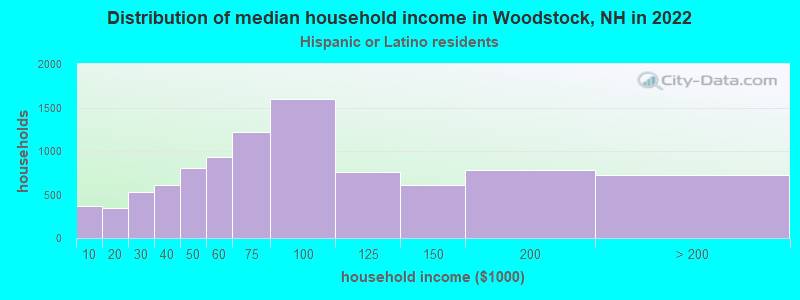
Household income for Hispanic or Latino race householders
Foreign-born residents in Woodstock
31 residents are foreign born (1.0% Asia, 0.6% Europe, 0.6% North America, 0.4% Latin America).
| This city: | 2.7% |
| New Hampshire: | 4.4% |
Ancestries in Woodstock

- 23415.7%French
- 22415.0%Irish
- 21714.5%English
- 18312.3%Other
- 1127.5%Scottish
- 1036.9%German
- 1006.7%United States
- 815.4%Italian
- 573.8%Polish
- 473.1%Scotch-Irish
- 332.2%French Canadian
- 332.2%Swedish
- 211.4%Dutch
- 130.9%Portuguese
- 70.5%Ukrainian
- 60.4%Norwegian
- 60.4%Russian
- 50.3%Lithuanian
- 50.3%Welsh
- 20.1%Danish
- 20.1%Hungarian
- 20.1%West Indian

Zip codes: 03223.