Races in Yorkshire, Virginia (VA) Detailed Stats
Data:
Races - White alone (%)
Races - White alone (% change since 2000)
Races - Black alone (%)
Races - Black alone (% change since 2000)
Races - American Indian alone (%)
Races - American Indian alone (% change since 2000)
Races - Asian alone (%)
Races - Asian alone (% change since 2000)
Races - Hispanic (%)
Races - Hispanic (% change since 2000)
Races - Native Hawaiian and Other Pacific Islander alone (%)
Races - Native Hawaiian and Other Pacific Islander alone (% change since 2000)
Races - Two or more races(%)
Races - Two or more races(% change since 2000)
Races - Other race alone (%)
Races - Other race alone (% change since 2000)
Racial diversity
Place of birth - Born in state of residence (%)
Place of birth - Born in state of residence (%) - White
Place of birth - Born in state of residence (%) - Black or African American
Place of birth - Born in state of residence (%) - Asian
Place of birth - Born in state of residence (%) - Hispanic or Latino
Place of birth - Born in state of residence (%) - American Indian and Alaska Native
Place of birth - Born in state of residence (%) - Multirace
Place of birth - Born in state of residence (%) - Other Race
Place of birth - Born in other state (%)
Place of birth - Born in other state (%) - White
Place of birth - Born in other state (%) - Black or African American
Place of birth - Born in other state (%) - Asian
Place of birth - Born in other state (%) - Hispanic or Latino
Place of birth - Born in other state (%) - American Indian and Alaska Native
Place of birth - Born in other state (%) - Multirace
Place of birth - Born in other state (%) - Other Race
Place of birth - Native, outside of US (%)
Place of birth - Native, outside of US (%) - White
Place of birth - Native, outside of US (%) - Black or African American
Place of birth - Native, outside of US (%) - Asian
Place of birth - Native, outside of US (%) - Hispanic or Latino
Place of birth - Native, outside of US (%) - American Indian and Alaska Native
Place of birth - Native, outside of US (%) - Multirace
Place of birth - Native, outside of US (%) - Other Race
Place of birth - Foreign born (%)
Place of birth - Foreign born (%) - White
Place of birth - Foreign born (%) - Black or African American
Place of birth - Foreign born (%) - Asian
Place of birth - Foreign born (%) - Hispanic or Latino
Place of birth - Foreign born (%) - American Indian and Alaska Native
Place of birth - Foreign born (%) - Multirace
Place of birth - Foreign born (%) - Other Race
Residents speaking English at home (%)
Residents speaking English at home - Born in the United States (%)
Residents speaking English at home - Native, born elsewhere (%)
Residents speaking English at home - Foreign born (%)
Residents speaking Spanish at home (%)
Residents speaking Spanish at home - Born in the United States (%)
Residents speaking Spanish at home - Native, born elsewhere (%)
Residents speaking Spanish at home - Foreign born (%)
Residents speaking other language at home (%)
Residents speaking other language at home - Born in the United States (%)
Residents speaking other language at home - Native, born elsewhere (%)
Residents speaking other language at home - Foreign born (%)
Marital status - Never married (%)
Marital status - Now married (%)
Marital status - Separated (%)
Marital status - Widowed (%)
Marital status - Divorced (%)
Ancestries Reported - Arab (%)
Ancestries Reported - Czech (%)
Ancestries Reported - Danish (%)
Ancestries Reported - Dutch (%)
Ancestries Reported - English (%)
Ancestries Reported - French (%)
Ancestries Reported - French Canadian (%)
Ancestries Reported - German (%)
Ancestries Reported - Greek (%)
Ancestries Reported - Hungarian (%)
Ancestries Reported - Irish (%)
Ancestries Reported - Italian (%)
Ancestries Reported - Lithuanian (%)
Ancestries Reported - Norwegian (%)
Ancestries Reported - Polish (%)
Ancestries Reported - Portuguese (%)
Ancestries Reported - Russian (%)
Ancestries Reported - Scotch-Irish (%)
Ancestries Reported - Scottish (%)
Ancestries Reported - Slovak (%)
Ancestries Reported - Subsaharan African (%)
Ancestries Reported - Swedish (%)
Ancestries Reported - Swiss (%)
Ancestries Reported - Ukrainian (%)
Ancestries Reported - United States (%)
Ancestries Reported - Welsh (%)
Ancestries Reported - West Indian (%)
Ancestries Reported - Other (%)
Geographical mobility - Same house 1 year ago (%)
Geographical mobility - Same house 1 year ago (%) - White
Geographical mobility - Same house 1 year ago (%) - Black or African American
Geographical mobility - Same house 1 year ago (%) - Asian
Geographical mobility - Same house 1 year ago (%) - Hispanic or Latino
Geographical mobility - Same house 1 year ago (%) - American Indian and Alaska Native
Geographical mobility - Same house 1 year ago (%) - Multirace
Geographical mobility - Same house 1 year ago (%) - Other Race
Geographical mobility - Moved within same county (%)
Geographical mobility - Moved within same county (%) - White
Geographical mobility - Moved within same county (%) - Black or African American
Geographical mobility - Moved within same county (%) - Asian
Geographical mobility - Moved within same county (%) - Hispanic or Latino
Geographical mobility - Moved within same county (%) - American Indian and Alaska Native
Geographical mobility - Moved within same county (%) - Multirace
Geographical mobility - Moved within same county (%) - Other Race
Geographical mobility - Moved from different county within same state (%)
Geographical mobility - Moved from different county within same state (%) - White
Geographical mobility - Moved from different county within same state (%) - Black or African American
Geographical mobility - Moved from different county within same state (%) - Asian
Geographical mobility - Moved from different county within same state (%) - Hispanic or Latino
Geographical mobility - Moved from different county within same state (%) - American Indian and Alaska Native
Geographical mobility - Moved from different county within same state (%) - Multirace
Geographical mobility - Moved from different county within same state (%) - Other Race
Geographical mobility - Moved from different state (%)
Geographical mobility - Moved from different state (%) - White
Geographical mobility - Moved from different state (%) - Black or African American
Geographical mobility - Moved from different state (%) - Asian
Geographical mobility - Moved from different state (%) - Hispanic or Latino
Geographical mobility - Moved from different state (%) - American Indian and Alaska Native
Geographical mobility - Moved from different state (%) - Multirace
Geographical mobility - Moved from different state (%) - Other Race
Geographical mobility - Moved from abroad (%)
Geographical mobility - Moved from abroad (%) - White
Geographical mobility - Moved from abroad (%) - Black or African American
Geographical mobility - Moved from abroad (%) - Asian
Geographical mobility - Moved from abroad (%) - Hispanic or Latino
Geographical mobility - Moved from abroad (%) - American Indian and Alaska Native
Geographical mobility - Moved from abroad (%) - Multirace
Geographical mobility - Moved from abroad (%) - Other Race
Place of birth for the foreign-born population - Ireland (%)
Place of birth for the foreign-born population - Denmark (%)
Place of birth for the foreign-born population - Norway (%)
Place of birth for the foreign-born population - Sweden (%)
Place of birth for the foreign-born population - United Kingdom (%)
Place of birth for the foreign-born population - England (%)
Place of birth for the foreign-born population - Scotland (%)
Place of birth for the foreign-born population - Other Northern Europe (%)
Place of birth for the foreign-born population - Austria (%)
Place of birth for the foreign-born population - Belgium (%)
Place of birth for the foreign-born population - France (%)
Place of birth for the foreign-born population - Germany (%)
Place of birth for the foreign-born population - Netherlands (%)
Place of birth for the foreign-born population - Switzerland (%)
Place of birth for the foreign-born population - Other Western Europe (%)
Place of birth for the foreign-born population - Greece (%)
Place of birth for the foreign-born population - Italy (%)
Place of birth for the foreign-born population - Portugal (%)
Place of birth for the foreign-born population - Spain (%)
Place of birth for the foreign-born population - Other Southern Europe (%)
Place of birth for the foreign-born population - Albania (%)
Place of birth for the foreign-born population - Belarus (%)
Place of birth for the foreign-born population - Bosnia and Herzegovina (%)
Place of birth for the foreign-born population - Bulgaria (%)
Place of birth for the foreign-born population - Croatia (%)
Place of birth for the foreign-born population - Czechoslovakia (%)
Place of birth for the foreign-born population - Hungary (%)
Place of birth for the foreign-born population - Latvia (%)
Place of birth for the foreign-born population - Lithuania (%)
Place of birth for the foreign-born population - North Macedonia (Macedonia) (%)
Place of birth for the foreign-born population - Moldova (%)
Place of birth for the foreign-born population - Poland (%)
Place of birth for the foreign-born population - Romania (%)
Place of birth for the foreign-born population - Russia (%)
Place of birth for the foreign-born population - Serbia (%)
Place of birth for the foreign-born population - Ukraine (%)
Place of birth for the foreign-born population - Other Eastern Europe (%)
Place of birth for the foreign-born population - China (%)
Place of birth for the foreign-born population - Hong Kong (%)
Place of birth for the foreign-born population - Taiwan (%)
Place of birth for the foreign-born population - Japan (%)
Place of birth for the foreign-born population - Korea (%)
Place of birth for the foreign-born population - Other Eastern Asia (%)
Place of birth for the foreign-born population - Afghanistan (%)
Place of birth for the foreign-born population - Bangladesh (%)
Place of birth for the foreign-born population - India (%)
Place of birth for the foreign-born population - Iran (%)
Place of birth for the foreign-born population - Kazakhstan (%)
Place of birth for the foreign-born population - Nepal (%)
Place of birth for the foreign-born population - Pakistan (%)
Place of birth for the foreign-born population - Sri Lanka (%)
Place of birth for the foreign-born population - Uzbekistan (%)
Place of birth for the foreign-born population - Other South Central Asia (%)
Place of birth for the foreign-born population - Burma (%)
Place of birth for the foreign-born population - Cambodia (%)
Place of birth for the foreign-born population - Indonesia (%)
Place of birth for the foreign-born population - Laos (%)
Place of birth for the foreign-born population - Malaysia (%)
Place of birth for the foreign-born population - Philippines (%)
Place of birth for the foreign-born population - Singapore (%)
Place of birth for the foreign-born population - Thailand (%)
Place of birth for the foreign-born population - Vietnam (%)
Place of birth for the foreign-born population - Other South Eastern Asia (%)
Place of birth for the foreign-born population - Armenia (%)
Place of birth for the foreign-born population - Iraq (%)
Place of birth for the foreign-born population - Israel (%)
Place of birth for the foreign-born population - Jordan (%)
Place of birth for the foreign-born population - Kuwait (%)
Place of birth for the foreign-born population - Lebanon (%)
Place of birth for the foreign-born population - Saudi Arabia (%)
Place of birth for the foreign-born population - Syria (%)
Place of birth for the foreign-born population - Turkey (%)
Place of birth for the foreign-born population - Yemen (%)
Place of birth for the foreign-born population - Other Western Asia (%)
Place of birth for the foreign-born population - Eritrea (%)
Place of birth for the foreign-born population - Ethiopia (%)
Place of birth for the foreign-born population - Kenya (%)
Place of birth for the foreign-born population - Somalia (%)
Place of birth for the foreign-born population - Uganda (%)
Place of birth for the foreign-born population - Zimbabwe (%)
Place of birth for the foreign-born population - Other Eastern Africa (%)
Place of birth for the foreign-born population - Cameroon (%)
Place of birth for the foreign-born population - Congo (%)
Place of birth for the foreign-born population - Democratic Republic of Congo (Zaire) (%)
Place of birth for the foreign-born population - Other Middle Africa (%)
Place of birth for the foreign-born population - Egypt (%)
Place of birth for the foreign-born population - Morocco (%)
Place of birth for the foreign-born population - Sudan (%)
Place of birth for the foreign-born population - Other Northern Africa (%)
Place of birth for the foreign-born population - South Africa (%)
Place of birth for the foreign-born population - Other Southern Africa (%)
Place of birth for the foreign-born population - Cabo Verde (%)
Place of birth for the foreign-born population - Ghana (%)
Place of birth for the foreign-born population - Liberia (%)
Place of birth for the foreign-born population - Nigeria (%)
Place of birth for the foreign-born population - Senegal (%)
Place of birth for the foreign-born population - Sierra Leone (%)
Place of birth for the foreign-born population - Other Western Africa (%)
Place of birth for the foreign-born population - Australia (%)
Place of birth for the foreign-born population - New Zealand (%)
Place of birth for the foreign-born population - Fiji (%)
Place of birth for the foreign-born population - Micronesia (%)
Place of birth for the foreign-born population - Bahamas (%)
Place of birth for the foreign-born population - Barbados (%)
Place of birth for the foreign-born population - Cuba (%)
Place of birth for the foreign-born population - Dominica (%)
Place of birth for the foreign-born population - Dominican Republic (%)
Place of birth for the foreign-born population - Grenada (%)
Place of birth for the foreign-born population - Haiti (%)
Place of birth for the foreign-born population - Jamaica (%)
Place of birth for the foreign-born population - St. Vincent and the Grenadines (%)
Place of birth for the foreign-born population - Trinidad and Tobago (%)
Place of birth for the foreign-born population - West Indies (%)
Place of birth for the foreign-born population - Other Caribbean (%)
Place of birth for the foreign-born population - Belize (%)
Place of birth for the foreign-born population - Costa Rica (%)
Place of birth for the foreign-born population - El Salvador (%)
Place of birth for the foreign-born population - Guatemala (%)
Place of birth for the foreign-born population - Honduras (%)
Place of birth for the foreign-born population - Mexico (%)
Place of birth for the foreign-born population - Nicaragua (%)
Place of birth for the foreign-born population - Panama (%)
Place of birth for the foreign-born population - Other Central America (%)
Place of birth for the foreign-born population - Argentina (%)
Place of birth for the foreign-born population - Bolivia (%)
Place of birth for the foreign-born population - Brazil (%)
Place of birth for the foreign-born population - Chile (%)
Place of birth for the foreign-born population - Colombia (%)
Place of birth for the foreign-born population - Ecuador (%)
Place of birth for the foreign-born population - Guyana (%)
Place of birth for the foreign-born population - Peru (%)
Place of birth for the foreign-born population - Uruguay (%)
Place of birth for the foreign-born population - Venezuela (%)
Place of birth for the foreign-born population - Other South America (%)
Place of birth for the foreign-born population - Canada (%)
Place of birth for the foreign-born population - Other Northern America (%)
Place of birth for the foreign-born population - Other (%)
Latest news about races in Yorkshire, VA collected exclusively by city-data.com from local newspapers, TV, and radio stations
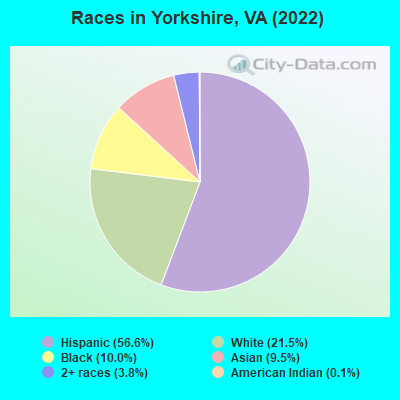
According to 2022 data, the most numerous races in Yorkshire, VA are White alone (2,301 residents), Black alone (1,068 residents), and Hispanic (6,052 residents). 40.0% of Yorkshire residents speak English at home. 43.6% of Yorkshire, VA residents are foreign-born (35.1% born in Latin America, 7.5% born in Asia), which is 72.5% greater than the foreign-born rate of 12.0% across the entire state of Virginia.
Race distribution in Yorkshire
2000 2022
4,965,637 70.2% White alone 1,376,378 19.4% Black alone 329,540 4.7% Hispanic 259,277 3.7% Asian alone 114,022 1.6% Two or more races 18,596 0.3% American Indian alone 11,685 0.2% Other race alone 3,380 0.05% Native Hawaiian and Other
5,095,130 58.7% White alone 1,594,785 18.4% Black alone 905,750 10.4% Hispanic 602,881 6.9% Asian alone 406,047 4.7% Two or more races 60,419 0.7% Other race alone 11,738 0.1% American Indian alone 6,869 0.08% Native Hawaiian and Other
Income and house value in Yorkshire Median household income in 2022 $125,121 White non-Hispanic householders$54,719 Black householdersover $200,000 Asian householders$131,237 Some other race householders$112,963 Two or more races householders$95,443 Hispanic or Latino race householdersMedian 2022 house value $478,901 White Non-Hispanic householders$372,357 Black or African American householders $396,721 Asian householders$386,539 Some other race householders$457,083 Two or more races householders$333,449 Hispanic or Latino householders
Median age by race in Yorkshire
27.8 Median age for White residents35.9 26.4 36.5 Median age for Black or African American residents24.8 40.2 48.6 Median age for American Indian / Alaska Native residents51.1 50.6 46.9 Median age for Asian residents49.2 46.5 -611,955,419.9 Median age for Native Hawaiian / Pacific Islander residents-541,531,822.5 -714,150,046.8 34.1 Median age for Other race residents26.1 32.3 22.6 Median age for Two or more races residents20.0 26.5 37.0 Median age for White alone residents40.4 30.4 25.5 Median age for Hispanic or Latino residents27.1 25.3
Owner/renter occupied households by race in Yorkshire
House owners and renters - White residents 734 48.1% Owner occupied792 51.9% Renter occupiedHouse owners and renters - Black or African American residents 106 30.0% Owner occupied248 70.0% Renter occupiedHouse owners and renters - American Indian / Alaska Native residents 46 100.0% Owner occupiedHouse owners and renters - Asian residents 293 80.7% Owner occupied70 19.3% Renter occupiedHouse owners and renters - Other race residents 246 65.2% Owner occupied131 34.8% Renter occupiedHouse owners and renters - Two or more races residents 108 24.6% Owner occupied330 75.4% Renter occupiedHouse owners and renters - White alone residents 571 72.1% Owner occupied221 27.9% Renter occupiedHouse owners and renters - Hispanic or Latino residents 547 35.9% Owner occupied978 64.1% Renter occupied
Language usage in Yorkshire
English speakers - Total 40.0% of residents of Yorkshire speak English at home.
51.6% of residents speak Spanish at home 2,790 55.2% Speak English very well2,261 44.8% Speak English less than very well7.6% of residents speak other language at home 488 65.9% Speak English very well253 34.1% Speak English less than very well
English speakers - Born in the United States 88.1% of residents of Yorkshire speak English at home.
11.9% of residents speak Spanish at home 215 71.4% Speak English very well86 28.6% Speak English less than very well1.0% of residents speak other language at home 20 83.3% Speak English very well4 16.7% Speak English less than very well
English speakers - Native, born elsewhere 19.9% of residents of Yorkshire speak English at home.
73.5% of residents speak Spanish at home 144 100.0% Speak English very well17.9% of residents speak other language at home 35 100.0% Speak English very well
English speakers - Foreign-born 5.3% of residents of Yorkshire speak English at home.
80.5% of residents speak Spanish at home 1,516 42.2% Speak English very well2,079 57.8% Speak English less than very well13.9% of residents speak other language at home 409 65.8% Speak English very well213 34.2% Speak English less than very well
White (Caucasian) - Speak only English Native:
76.7% (2,034)Foreign-born:
0.3% (3)
White (Caucasian) - Speak another language Native:
17.3% (459)Foreign-born:
98.3% (1,167)
Black or African American - Speak only English Native:
97.8% (1,055)Foreign-born:
30.1% (7)
Black or African American - Speak another language Native:
1.9% (20)Foreign-born:
57.4% (13)
American Indian / Alaska Native - Speak another language Native:
57.1% (38)Foreign-born:
100.0% (55)
Asian - Speak only English Native:
44.2% (38)Foreign-born:
28.3% (233)
Asian - Speak another language Native:
53.2% (46)Foreign-born:
71.3% (587)
Other race - Speak another language Native:
83.4% (407)Foreign-born:
97.0% (675)
Two or more races - Speak only English Native:
48.0% (462)Foreign-born:
3.0% (35)
Two or more races - Speak another language Native:
59.3% (570)Foreign-born:
95.9% (1,119)
White alone - Speak only English Native:
98.6% (2,023)Foreign-born:
6.5% (4)
White alone - Speak another language Native:
1.7% (34)Foreign-born:
100.0% (56)
Hispanic or Latino - Speak only English Native:
12.7% (218)Foreign-born:
0.8% (30)
Hispanic or Latino - Speak another language Native:
85.7% (1,466)Foreign-born:
96.4% (3,568)
Foreign-born residents in Yorkshire 4,664 residents are foreign born (35.1% Latin America , 7.5% Asia ).
This city:
43.6%Virginia:
12.6%
Marital status for residents in Yorkshire Marital status - White (Caucasian) population 15 years and over
Males 47.8% Never married41.8% Now married0.0% Separated3.1% Widowed7.3% DivorcedFemales 49.1% Never married39.3% Now married6.8% Separated1.9% Widowed2.9% DivorcedWomen who gave birth in the past 12 months Now married:
36.6% (25)Unmarried:
63.4% (43)
Women who did not give birth in the past 12 months Now married:
40.3% (545)Unmarried:
59.7% (806)
Marital status - Black or African American population 15 years and over
Males 55.6% Never married38.9% Now married1.6% Separated0.0% Widowed3.9% DivorcedFemales 19.6% Never married74.4% Now married4.3% Separated0.0% Widowed1.7% DivorcedWomen who did not give birth in the past 12 months Now married:
72.8% (164)Unmarried:
27.2% (61)
Marital status - American Indian / Alaska Native population 15 years and over
Males 35.1% Never married35.1% Now married0.0% Separated29.8% Widowed0.0% DivorcedFemales 44.9% Never married34.7% Now married0.0% Separated0.0% Widowed20.4% DivorcedWomen who did not give birth in the past 12 months Now married:
0.0% (0)Unmarried:
100.0% (34)
Marital status - Asian population 15 years and over
Males 8.6% Never married73.8% Now married2.6% Separated0.0% Widowed14.9% DivorcedFemales 13.9% Never married64.4% Now married0.0% Separated21.7% Widowed0.0% DivorcedWomen who gave birth in the past 12 months Now married:
100.0% (19)Unmarried:
0.0% (0)
Women who did not give birth in the past 12 months Now married:
76.8% (204)Unmarried:
23.2% (62)
Marital status - Other race population 15 years and over
Males 44.8% Never married55.2% Now married0.0% Separated0.0% Widowed0.0% DivorcedFemales 26.9% Never married51.5% Now married14.4% Separated0.0% Widowed7.2% DivorcedWomen who gave birth in the past 12 months Now married:
100.0% (90)Unmarried:
0.0% (0)
Women who did not give birth in the past 12 months Now married:
66.0% (90)Unmarried:
34.0% (47)
Marital status - Two or more races population 15 years and over
Males 50.4% Never married49.6% Now married0.0% Separated0.0% Widowed0.0% DivorcedFemales 27.5% Never married62.8% Now married0.0% Separated0.0% Widowed9.7% DivorcedWomen who gave birth in the past 12 months Now married:
37.3% (33)Unmarried:
62.7% (56)
Women who did not give birth in the past 12 months Now married:
63.8% (269)Unmarried:
36.2% (153)
Marital status - White alone, not Hispanic / Latino population 15 years and over
Males 42.2% Never married49.3% Now married0.0% Separated1.0% Widowed7.5% DivorcedFemales 36.0% Never married53.1% Now married0.0% Separated4.3% Widowed6.7% DivorcedWomen who gave birth in the past 12 months Now married:
100.0% (29)Unmarried:
0.0% (0)
Women who did not give birth in the past 12 months Now married:
37.7% (190)Unmarried:
62.3% (314)
Marital status - Hispanic or Latino population 15 years and over
Males 48.0% Never married45.4% Now married0.0% Separated2.7% Widowed3.9% DivorcedFemales 47.8% Never married38.9% Now married10.3% Separated0.0% Widowed3.1% DivorcedWomen who gave birth in the past 12 months Now married:
61.5% (86)Unmarried:
38.5% (54)
Women who did not give birth in the past 12 months Now married:
46.1% (708)Unmarried:
53.9% (828)
Ancestries in Yorkshire
168 2.8% African122 2.0% American80 1.3% Irish79 1.3% German65 1.1% Swedish40 0.7% Italian37 0.6% French36 0.6% European28 0.5% Egyptian19 0.3% Iranian14 0.2% Scottish13 0.2% Norwegian11 0.2% Ghanaian10 0.2% Scandinavian9 0.2% English5 0.08% Brazilian5 0.08% Haitian
Children Nativity (place of birth) in Yorkshire
Children under 6 years - Living with two parents Both parents native 313 99.7% Native1 0.3% Foreign-bornBoth parents foreign-born 150 72.0% Native58 28.0% Foreign-bornOne native, one foreign-born parent 72 100.0% NativeChildren under 6 years - Living with one parent Native parent 217 100.0% NativeForeign-born parent 254 98.1% Native5 1.9% Foreign-bornChildren 6 to 17 years - Living with two parents Both parents native 305 100.0% NativeBoth parents foreign-born 411 58.8% Native288 41.2% Foreign-bornOne native, one foreign-born parent 77 100.0% NativeChildren 6 to 17 years - Living with one parent Native parent 72 30.2% Native166 69.8% Foreign-bornForeign-born parent 568 82.4% Native122 17.6% Foreign-born
Grandparents responsible for own grandchildren in Yorkshire
Grandparents (30 to 59 years) White / Caucasian 99 100.0% Not responsible for grandchildrenBlack or African American 2 100.0% Responsible for grandchildrenWhite alone, not Hispanic / Latino 60 100.0% Not responsible for grandchildrenHispanic or Latino 58 100.0% Not responsible for grandchildren
Grandparents (60 years and over) White / Caucasian 19 100.0% Not responsible for grandchildrenWhite alone, not Hispanic / Latino 25 100.0% Not responsible for grandchildren