Work and Jobs in Belvedere, California (CA) Detailed Stats
Occupations, Industries, Unemployment, Workers, Commute
Settings
X


Recent posts about work in Belvedere, California on our local forum with over 2,400,000 registered users:

Latest news about work in Belvedere, CA collected exclusively by city-data.com from local newspapers, TV, and radio stations
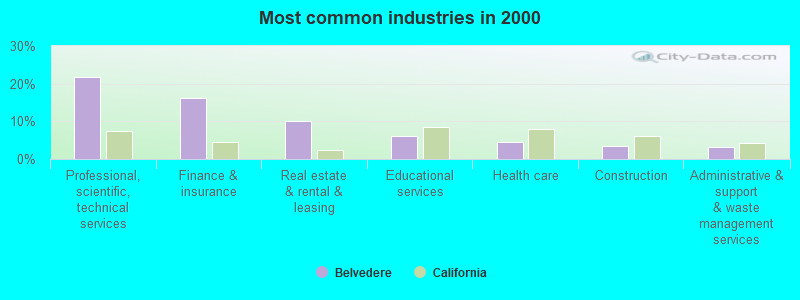
The most common industries in Belvedere are: Professional, scientific, technical services (21.8% of civilian employees), Finance & insurance (16.1% of civilian employees), Real estate & rental & leasing (10.1% of civilian employees). 67.6% of workers work in Marin County and 43.0% of all workers work at home. 57.9% of workers are employees of private companies, which is 14.8% less than the rate of 66.5% across the entire state of California.
Whole page based on the data from 2000 / 2022 when the population of Belvedere, California was 2,125 / 2,287
Whole page based on the data from 2000 / 2022 when the population of Belvedere, California was 2,125 / 2,287
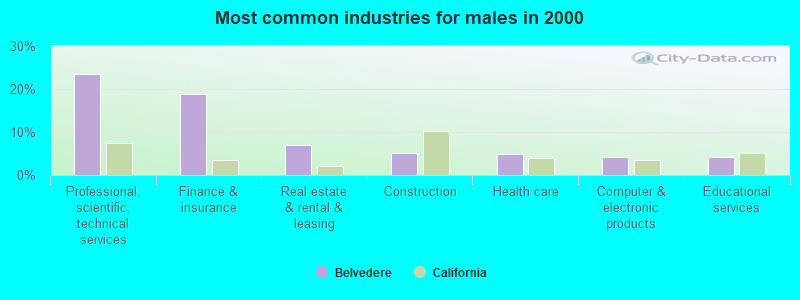
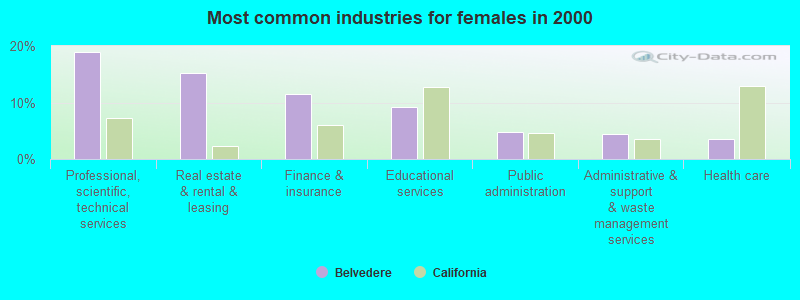
Most common industries
Most common industries | |||
|---|---|---|---|
Industry | All | Males | Females |
| Professional, scientific, and technical services | 21.8% (191) | 23.5% (127) | 19.0% (64) |
| Finance and insurance | 16.1% (141) | 18.9% (102) | 11.6% (39) |
| Real estate and rental and leasing | 10.1% (89) | 7.0% (38) | 15.1% (51) |
| Educational services | 6.0% (53) | 4.1% (22) | 9.2% (31) |
| Health care | 4.4% (39) | 5.0% (27) | 3.6% (12) |
| Construction | 3.5% (31) | 5.2% (28) | 0.9% (3) |
| Administrative and support and waste management services | 3.3% (29) | 2.6% (14) | 4.5% (15) |
| Public administration | 2.7% (24) | 1.5% (8) | 4.7% (16) |
| Computer and electronic products | 2.6% (23) | 4.3% (23) | 0.0% (0) |
| Private households | 2.3% (20) | 2.4% (13) | 2.1% (7) |
| Religious, grantmaking, civic, professional, and similar organizations | 2.2% (19) | 1.5% (8) | 3.3% (11) |
| Publishing, and motion picture and sound recording industries | 1.9% (17) | 1.1% (6) | 3.3% (11) |
| Personal and laundry services | 1.9% (17) | 3.1% (17) | 0.0% (0) |
| Food and beverage stores | 1.6% (14) | 2.6% (14) | 0.0% (0) |
| Arts, entertainment, and recreation | 1.4% (12) | 0.7% (4) | 2.4% (8) |
| Used merchandise, gift, novelty, and souvenir, and other miscellaneous stores | 1.4% (12) | 0.7% (4) | 2.4% (8) |
| Chemicals | 1.4% (12) | 2.2% (12) | 0.0% (0) |
| Social assistance | 1.3% (11) | 0.0% (0) | 3.3% (11) |
| Radio, TV, and computer stores | 1.3% (11) | 0.0% (0) | 3.3% (11) |
| Broadcasting and telecommunications | 1.1% (10) | 1.1% (6) | 1.2% (4) |
| Other transportation, and support activities, and couriers | 1.0% (9) | 1.7% (9) | 0.0% (0) |
| Furniture and home furnishings, and household appliance stores | 0.8% (7) | 0.0% (0) | 2.1% (7) |
| Agriculture, forestry, fishing and hunting | 0.8% (7) | 0.7% (4) | 0.9% (3) |
| Beverage and tobacco products | 0.6% (5) | 0.9% (5) | 0.0% (0) |
| Motor vehicle and parts dealers | 0.6% (5) | 0.9% (5) | 0.0% (0) |
| Miscellaneous manufacturing | 0.6% (5) | 0.9% (5) | 0.0% (0) |
| Printing and related support activities | 0.6% (5) | 0.9% (5) | 0.0% (0) |
| Data processing, libraries, and other information services | 0.6% (5) | 0.0% (0) | 1.5% (5) |
| Paper and paper products merchant wholesalers | 0.6% (5) | 0.9% (5) | 0.0% (0) |
| Health and personal care, except drug, stores | 0.5% (4) | 0.0% (0) | 1.2% (4) |
| Paper | 0.5% (4) | 0.7% (4) | 0.0% (0) |
| Miscellaneous nondurable goods merchant wholesalers | 0.5% (4) | 0.7% (4) | 0.0% (0) |
| Utilities | 0.5% (4) | 0.7% (4) | 0.0% (0) |
| Farm supplies merchant wholesalers | 0.5% (4) | 0.7% (4) | 0.0% (0) |
| Water transportation | 0.5% (4) | 0.0% (0) | 1.2% (4) |
| Electronic shopping and mail-order houses | 0.5% (4) | 0.0% (0) | 1.2% (4) |
| Groceries and related products merchant wholesalers | 0.5% (4) | 0.7% (4) | 0.0% (0) |
| Professional and commercial equipment and supplies merchant wholesalers | 0.3% (3) | 0.6% (3) | 0.0% (0) |
| Department and other general merchandise stores | 0.3% (3) | 0.0% (0) | 0.9% (3) |
| Management of companies and enterprises | 0.3% (3) | 0.6% (3) | 0.0% (0) |
| Clothing and accessories, including shoe, stores | 0.3% (3) | 0.0% (0) | 0.9% (3) |
| Motor vehicles, parts and supplies merchant wholesalers | 0.3% (3) | 0.6% (3) | 0.0% (0) |
| Accommodation and food services | 0.2% (2) | 0.0% (0) | 0.6% (2) |
Unemployment in Belvedere
- Unemployment by race in 2022
- Unemployment rate for White non-Hispanic residents
- 1.8%Males
- 1.3%Females
- Unemployment by race in 2000
- Unemployment rate for White non-Hispanic residents
- 2.6%Males
- 1.6%Females
- Unemployment rate for Hispanic or Latino residents
- 37.5%Males
Time leaving home to go to work

6:00 a.m. to 6:29 a.m.:
| Belvedere: | 1.1% (5) |
| California: | 8.3% (1,273,588) |
6:30 a.m. to 6:59 a.m.:
| Belvedere: | 4.9% (22) |
| California: | 7.5% (1,156,338) |
7:00 a.m. to 7:29 a.m.:
| Belvedere: | 13.5% (59) |
| California: | 13.2% (2,027,702) |
7:30 a.m. to 7:59 a.m.:
| Belvedere: | 15.7% (68) |
| California: | 10.1% (1,550,402) |
8:00 a.m. to 8:29 a.m.:
| Belvedere: | 30.7% (134) |
| California: | 12.7% (1,953,986) |
8:30 a.m. to 8:59 a.m.:
| Belvedere: | 8.9% (39) |
| California: | 5.8% (890,950) |
9:00 a.m. to 9:59 a.m.:
| Belvedere: | 18.6% (81) |
| California: | 8.4% (1,288,499) |
10:00 a.m. to 10:59 a.m.:
| Belvedere: | 5.4% (23) |
| California: | 4.0% (613,193) |
12:00 p.m. to 3:59 p.m.:
| Belvedere: | 2.8% (12) |
| California: | 7.0% (1,075,505) |
4:00 p.m. to 11:59 p.m.:
| Belvedere: | 2.4% (11) |
| California: | 5.8% (891,240) |

<5am:
| Belvedere: | 1.0% (9) |
| California: | 4.2% (606,086) |
6am:
| Belvedere: | 6.9% (60) |
| California: | 4.8% (692,256) |
6:30am:
| Belvedere: | 1.5% (13) |
| California: | 8.4% (1,216,867) |
7am:
| Belvedere: | 8.7% (75) |
| California: | 9.4% (1,362,830) |
7:30am:
| Belvedere: | 12.3% (106) |
| California: | 13.8% (2,006,950) |
8am:
| Belvedere: | 18.9% (163) |
| California: | 13.7% (1,986,831) |
8:30am:
| Belvedere: | 13.3% (115) |
| California: | 10.9% (1,577,815) |
9am:
| Belvedere: | 6.0% (52) |
| California: | 5.4% (778,152) |
10am:
| Belvedere: | 9.4% (81) |
| California: | 6.7% (972,355) |
11am:
| Belvedere: | 3.6% (31) |
| California: | 2.9% (414,479) |
12pm:
| Belvedere: | 1.0% (9) |
| California: | 1.3% (189,005) |
4pm:
| Belvedere: | 2.5% (22) |
| California: | 6.0% (865,284) |
>4pm:
| Belvedere: | 0.5% (4) |
| California: | 5.3% (776,167) |

6:00 a.m. to 6:29 a.m. - Males:
| Belvedere: | 2.1% (6) |
| California: | 9.8% (842,941) |
6:30 a.m. to 6:59 a.m. - Males:
| Belvedere: | 4.4% (12) |
| California: | 7.7% (657,557) |
7:00 a.m. to 7:29 a.m. - Males:
| Belvedere: | 16.7% (47) |
| California: | 12.4% (1,058,532) |
7:30 a.m. to 7:59 a.m. - Males:
| Belvedere: | 15.0% (43) |
| California: | 8.2% (702,727) |
8:00 a.m. to 8:29 a.m. - Males:
| Belvedere: | 35.1% (100) |
| California: | 11.5% (984,538) |
8:30 a.m. to 8:59 a.m. - Males:
| Belvedere: | 4.0% (11) |
| California: | 4.8% (414,815) |
9:00 a.m. to 9:59 a.m. - Males:
| Belvedere: | 19.7% (56) |
| California: | 7.7% (655,038) |
10:00 a.m. to 10:59 a.m. - Males:
| Belvedere: | 0.8% (2) |
| California: | 3.5% (301,425) |
12:00 p.m. to 3:59 p.m. - Males:
| Belvedere: | 3.9% (11) |
| California: | 7.0% (594,847) |
4:00 p.m. to 11:59 p.m. - Males:
| Belvedere: | 4.3% (12) |
| California: | 5.8% (499,471) |

6:30 a.m. to 6:59 a.m. - Females:
| Belvedere: | 5.3% (8) |
| California: | 7.3% (498,781) |
7:00 a.m. to 7:29 a.m. - Females:
| Belvedere: | 9.3% (14) |
| California: | 14.1% (969,170) |
7:30 a.m. to 7:59 a.m. - Females:
| Belvedere: | 13.2% (20) |
| California: | 12.4% (847,675) |
8:00 a.m. to 8:29 a.m. - Females:
| Belvedere: | 23.1% (35) |
| California: | 14.1% (969,448) |
8:30 a.m. to 8:59 a.m. - Females:
| Belvedere: | 18.5% (28) |
| California: | 6.9% (476,135) |
9:00 a.m. to 9:59 a.m. - Females:
| Belvedere: | 18.1% (27) |
| California: | 9.2% (633,461) |
10:00 a.m. to 10:59 a.m. - Females:
| Belvedere: | 15.4% (23) |
| California: | 4.5% (311,768) |
4:00 p.m. to 11:59 p.m. - Females:
| Belvedere: | 2.3% (3) |
| California: | 5.7% (391,769) |
Travel time to work
Percentage of workers working in this county: 67.6%
Number of people working at home: 361 (43.0% of all workers)
Number of people working at home: 361 (43.0% of all workers)


Less than 5 minutes:
| Belvedere: | 4.1% (35) |
| California: | 2.2% (324,703) |
5 to 9 minutes:
| Belvedere: | 9.0% (78) |
| California: | 8.8% (1,280,443) |
10 to 14 minutes:
| Belvedere: | 4.3% (37) |
| California: | 13.3% (1,930,263) |
15 to 19 minutes:
| Belvedere: | 8.6% (74) |
| California: | 14.9% (2,157,970) |
20 to 24 minutes:
| Belvedere: | 8.1% (70) |
| California: | 13.8% (2,004,060) |
25 to 29 minutes:
| Belvedere: | 4.5% (39) |
| California: | 5.4% (782,241) |
30 to 34 minutes:
| Belvedere: | 8.0% (69) |
| California: | 13.9% (2,025,657) |
35 to 39 minutes:
| Belvedere: | 3.8% (33) |
| California: | 2.5% (366,487) |
40 to 44 minutes:
| Belvedere: | 8.2% (71) |
| California: | 3.6% (528,043) |
45 to 59 minutes:
| Belvedere: | 11.9% (103) |
| California: | 7.9% (1,151,598) |
60 to 89 minutes:
| Belvedere: | 11.6% (100) |
| California: | 6.4% (933,123) |
90 or more minutes:
| Belvedere: | 3.6% (31) |
| California: | 3.3% (483,698) |
Means of transportation to work
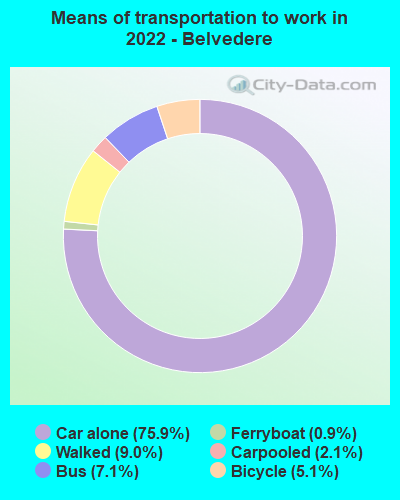

Drove car alone:
| Belvedere: | 75.9% (329) |
| California: | 79.1% (5,345,368) |
Carpooled:
| Belvedere: | 2.1% (9) |
| California: | 11.9% (878,699) |
Bus:
| Belvedere: | 7.1% (31) |
| California: | 2.2% (170,574) |
Ferryboat:
| Belvedere: | 0.9% (4) |
| California: | 0.1% (3,989) |
Bicycle:
| Belvedere: | 5.1% (22) |
| California: | 0.9% (39,197) |
Walked:
| Belvedere: | 9.0% (39) |
| California: | 2.9% (218,374) |


Drove car alone:
| Belvedere: | 62.6% (541) |
| California: | 71.8% (10,432,462) |
Carpooled:
| Belvedere: | 3.1% (27) |
| California: | 14.5% (2,113,313) |
Bus or trolley bus:
| Belvedere: | 1.4% (12) |
| California: | 3.8% (549,425) |
Ferryboat:
| Belvedere: | 10.9% (94) |
| California: | 0.0% (6,831) |
Taxicab:
| Belvedere: | 0.8% (7) |
| California: | 0.1% (9,890) |
Walked:
| Belvedere: | 6.2% (54) |
| California: | 2.9% (414,581) |
Other means:
| Belvedere: | 0.6% (5) |
| California: | 0.8% (115,064) |


Drove car alone - Males:
| Belvedere: | 71.1% (194) |
| California: | 80.0% (5,345,368) |
Bus - Males:
| Belvedere: | 7.0% (19) |
| California: | 2.0% (170,574) |
Ferryboat - Males:
| Belvedere: | 1.5% (4) |
| California: | 0.1% (3,989) |
Bicycle - Males:
| Belvedere: | 8.1% (22) |
| California: | 1.1% (39,197) |
Walked - Males:
| Belvedere: | 12.2% (33) |
| California: | 2.7% (218,374) |


Drove car alone - Females:
| Belvedere: | 83.6% (135) |
| California: | 77.9% (5,345,368) |
Carpooled - Females:
| Belvedere: | 5.5% (9) |
| California: | 12.8% (878,699) |
Bus - Females:
| Belvedere: | 7.3% (12) |
| California: | 2.5% (170,574) |
Walked - Females:
| Belvedere: | 3.6% (6) |
| California: | 3.2% (218,374) |
Private vehicle occupancy

Drove alone:
| Belvedere: | 95.8% (313) |
| California: | 86.9% (12,187,486) |
In 2 person carpool:
| Belvedere: | 3.0% (10) |
| California: | 9.2% (1,295,561) |
In 5-6 person carpool:
| Belvedere: | 1.2% (4) |
| California: | 0.5% (70,825) |

Drove alone:
| Belvedere: | 95.2% (541) |
| California: | 83.2% (10,432,462) |
In 2 person carpool:
| Belvedere: | 3.9% (22) |
| California: | 12.5% (1,564,905) |
In 3 person carpool:
| Belvedere: | 0.9% (5) |
| California: | 2.6% (330,732) |
Class of workers

Employee of private company:
| Belvedere: | 57.9% (516) |
| California: | 66.5% (12,596,030) |
Self-employed in own incorporated business:
| Belvedere: | 9.2% (82) |
| California: | 4.1% (784,709) |
Private not-for-profit wage and salary workers:
| Belvedere: | 2.1% (18) |
| California: | 7.5% (1,417,407) |
Local government workers:
| Belvedere: | 6.3% (56) |
| California: | 8.2% (1,547,056) |
State government workers:
| Belvedere: | 2.7% (24) |
| California: | 4.1% (780,915) |
Federal government workers:
| Belvedere: | 0.5% (5) |
| California: | 2.0% (369,858) |
Self-employed workers in own not incorporated business:
| Belvedere: | 20.8% (185) |
| California: | 7.4% (1,410,735) |
Unpaid family workers:
| Belvedere: | 0.4% (4) |
| California: | 0.2% (36,267) |

Employee of private company:
| Belvedere: | 49.1% (431) |
| California: | 68.0% (10,009,465) |
Self-employed in own incorporated business:
| Belvedere: | 15.7% (138) |
| California: | 2.7% (402,392) |
Private not-for-profit wage and salary workers:
| Belvedere: | 4.4% (39) |
| California: | 5.7% (845,536) |
Local government workers:
| Belvedere: | 5.2% (46) |
| California: | 8.3% (1,218,764) |
State government workers:
| Belvedere: | 2.4% (21) |
| California: | 4.0% (594,953) |
Federal government workers:
| Belvedere: | 0.7% (6) |
| California: | 2.3% (344,354) |
Self-employed workers in own not incorporated business:
| Belvedere: | 21.6% (189) |
| California: | 8.5% (1,249,530) |
Unpaid family workers:
| Belvedere: | 0.8% (7) |
| California: | 0.4% (53,934) |

Employee of private company - Males:
| Belvedere: | 64.3% (340) |
| California: | 70.3% (7,191,252) |
Self-employed in own incorporated business - Males:
| Belvedere: | 12.5% (66) |
| California: | 4.9% (504,764) |
State government workers - Males:
| Belvedere: | 4.6% (24) |
| California: | 3.4% (343,636) |
Self-employed workers in own not incorporated business - Males:
| Belvedere: | 17.9% (95) |
| California: | 8.1% (824,359) |
Unpaid family workers - Males:
| Belvedere: | 0.7% (4) |
| California: | 0.2% (17,922) |

Employee of private company - Females:
| Belvedere: | 48.7% (176) |
| California: | 62.0% (5,404,778) |
Self-employed in own incorporated business - Females:
| Belvedere: | 4.5% (16) |
| California: | 3.2% (279,945) |
Private not-for-profit wage and salary workers - Females:
| Belvedere: | 5.1% (18) |
| California: | 10.2% (888,285) |
Local government workers - Females:
| Belvedere: | 15.5% (56) |
| California: | 10.8% (936,725) |
Federal government workers - Females:
| Belvedere: | 1.3% (5) |
| California: | 1.8% (159,984) |
Self-employed workers in own not incorporated business - Females:
| Belvedere: | 24.9% (90) |
| California: | 6.7% (586,376) |