Work and Jobs in Fort Garland, Colorado (CO) Detailed Stats
Occupations, Industries, Unemployment, Workers, Commute
Settings
X


Recent posts about work in Fort Garland, Colorado on our local forum with over 2,400,000 registered users:
 | Retirement in Blanca Co. (49 replies) |
| What's open in CO? (24 replies) |
| What is life like in Buena Vista? Your insight is appreciated. (27 replies) |
| Info on towns in the San Luis Valley (6 replies) |
| Living around Fort Garland? (5 replies) |
| Dear Alferd Packer – answers to newbie Coloradan's FAQ’s about the Centennial State (29 replies) |
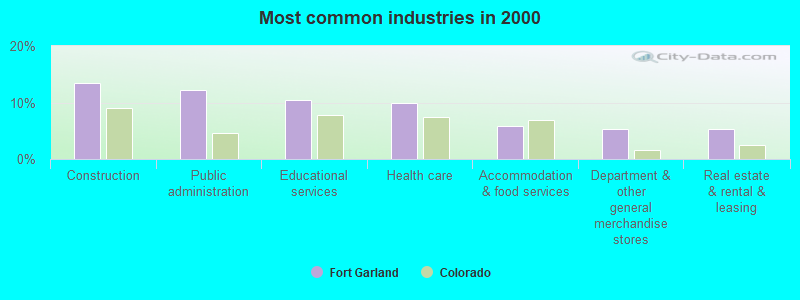
The most common industries in Fort Garland are: Construction (13.5% of civilian employees), Public administration (12.3% of civilian employees), Educational services (10.5% of civilian employees). 82.1% of workers work in Costilla County and 3.7% of all workers work at home. 57.2% of workers are employees of private companies, which is 16.4% less than the rate of 66.6% across the entire state of Colorado.
Whole page based on the data from 2000 / 2022 when the population of Fort Garland, Colorado was 432 / 589
Whole page based on the data from 2000 / 2022 when the population of Fort Garland, Colorado was 432 / 589
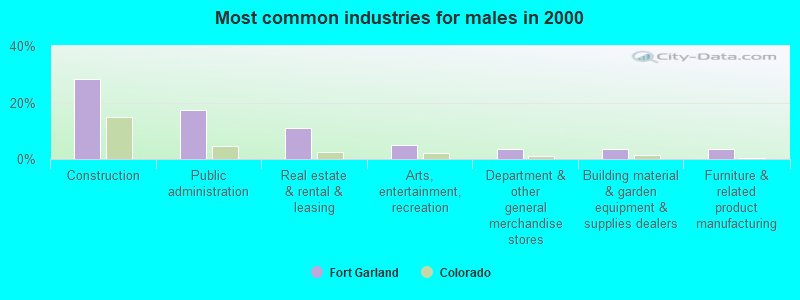
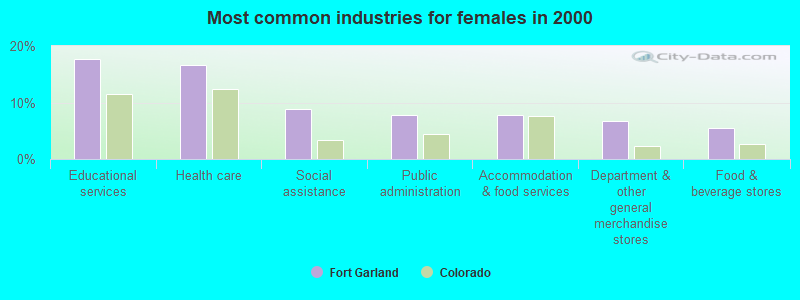
Most common industries
Most common industries | |||
|---|---|---|---|
Industry | All | Males | Females |
| Construction | 13.5% (23) | 28.4% (23) | 0.0% (0) |
| Public administration | 12.3% (21) | 17.3% (14) | 7.8% (7) |
| Educational services | 10.5% (18) | 2.5% (2) | 17.8% (16) |
| Health care | 9.9% (17) | 2.5% (2) | 16.7% (15) |
| Accommodation and food services | 5.8% (10) | 3.7% (3) | 7.8% (7) |
| Department and other general merchandise stores | 5.3% (9) | 3.7% (3) | 6.7% (6) |
| Real estate and rental and leasing | 5.3% (9) | 11.1% (9) | 0.0% (0) |
| Arts, entertainment, and recreation | 5.3% (9) | 4.9% (4) | 5.6% (5) |
| Food and beverage stores | 4.7% (8) | 3.7% (3) | 5.6% (5) |
| Social assistance | 4.7% (8) | 0.0% (0) | 8.9% (8) |
| Gasoline stations | 2.3% (4) | 0.0% (0) | 4.4% (4) |
| U. S. Postal service | 2.3% (4) | 2.5% (2) | 2.2% (2) |
| Furniture and related product manufacturing | 1.8% (3) | 3.7% (3) | 0.0% (0) |
| Building material and garden equipment and supplies dealers | 1.8% (3) | 3.7% (3) | 0.0% (0) |
| Nonmetallic mineral products | 1.8% (3) | 0.0% (0) | 3.3% (3) |
| Finance and insurance | 1.8% (3) | 0.0% (0) | 3.3% (3) |
| Mining, quarrying, and oil and gas extraction | 1.2% (2) | 2.5% (2) | 0.0% (0) |
| Food | 1.2% (2) | 2.5% (2) | 0.0% (0) |
| Groceries and related products merchant wholesalers | 1.2% (2) | 0.0% (0) | 2.2% (2) |
| Machinery, equipment, and supplies merchant wholesalers | 1.2% (2) | 2.5% (2) | 0.0% (0) |
| Used merchandise, gift, novelty, and souvenir, and other miscellaneous stores | 1.2% (2) | 0.0% (0) | 2.2% (2) |
| Rail transportation | 1.2% (2) | 2.5% (2) | 0.0% (0) |
| Other transportation, and support activities, and couriers | 1.2% (2) | 0.0% (0) | 2.2% (2) |
| Warehousing and storage | 1.2% (2) | 0.0% (0) | 2.2% (2) |
| Utilities | 1.2% (2) | 2.5% (2) | 0.0% (0) |
| Apparel | 0.6% (1) | 0.0% (0) | 1.1% (1) |
Unemployment in Fort Garland
- Unemployment by race in 2022
- Unemployment rate for White non-Hispanic residents
- 100.0%Females
- Unemployment rate for other race residents
- 100.0%Females
- Unemployment rate for Hispanic or Latino residents
- 6.5%Males
- 4.7%Females
- Unemployment by race in 2000
- Unemployment rate for White non-Hispanic residents
- 13.6%Females
- Unemployment rate for other race residents
- 11.6%Males
- 10.9%Females
- Unemployment rate for Hispanic or Latino residents
- 14.1%Males
- 10.1%Females
Time leaving home to go to work

6:00 a.m. to 6:29 a.m.:
| Fort Garland: | 13.0% (20) |
| Colorado: | 8.6% (210,736) |
6:30 a.m. to 6:59 a.m.:
| Fort Garland: | 5.7% (9) |
| Colorado: | 10.2% (250,710) |
7:00 a.m. to 7:29 a.m.:
| Fort Garland: | 26.7% (41) |
| Colorado: | 14.7% (362,963) |
7:30 a.m. to 7:59 a.m.:
| Fort Garland: | 6.3% (10) |
| Colorado: | 12.7% (311,366) |
8:00 a.m. to 8:29 a.m.:
| Fort Garland: | 15.8% (24) |
| Colorado: | 12.3% (302,330) |
8:30 a.m. to 8:59 a.m.:
| Fort Garland: | 5.7% (9) |
| Colorado: | 5.4% (131,963) |
9:00 a.m. to 9:59 a.m.:
| Fort Garland: | 23.2% (35) |
| Colorado: | 7.2% (175,993) |
4:00 p.m. to 11:59 p.m.:
| Fort Garland: | 4.3% (7) |
| Colorado: | 5.2% (127,420) |

<5am:
| Fort Garland: | 2.3% (4) |
| Colorado: | 2.9% (62,865) |
6:30am:
| Fort Garland: | 8.1% (14) |
| Colorado: | 9.0% (197,321) |
7am:
| Fort Garland: | 14.5% (25) |
| Colorado: | 11.3% (246,749) |
7:30am:
| Fort Garland: | 17.9% (31) |
| Colorado: | 15.4% (336,717) |
8am:
| Fort Garland: | 24.9% (43) |
| Colorado: | 15.0% (329,151) |
8:30am:
| Fort Garland: | 18.5% (32) |
| Colorado: | 10.0% (219,216) |
9am:
| Fort Garland: | 1.7% (3) |
| Colorado: | 4.8% (105,802) |
10am:
| Fort Garland: | 4.0% (7) |
| Colorado: | 5.2% (114,870) |
4pm:
| Fort Garland: | 1.2% (2) |
| Colorado: | 5.6% (122,019) |
>4pm:
| Fort Garland: | 6.9% (12) |
| Colorado: | 5.5% (119,635) |

6:00 a.m. to 6:29 a.m. - Males:
| Fort Garland: | 17.2% (20) |
| Colorado: | 10.5% (143,601) |
6:30 a.m. to 6:59 a.m. - Males:
| Fort Garland: | 7.3% (9) |
| Colorado: | 10.4% (141,916) |
7:00 a.m. to 7:29 a.m. - Males:
| Fort Garland: | 29.3% (35) |
| Colorado: | 14.3% (194,350) |
7:30 a.m. to 7:59 a.m. - Males:
| Fort Garland: | 7.8% (9) |
| Colorado: | 10.6% (144,090) |
8:00 a.m. to 8:29 a.m. - Males:
| Fort Garland: | 9.6% (11) |
| Colorado: | 11.5% (157,061) |
9:00 a.m. to 9:59 a.m. - Males:
| Fort Garland: | 29.9% (35) |
| Colorado: | 6.2% (84,699) |

7:00 a.m. to 7:29 a.m. - Females:
| Fort Garland: | 19.1% (7) |
| Colorado: | 15.3% (168,613) |
8:00 a.m. to 8:29 a.m. - Females:
| Fort Garland: | 37.1% (13) |
| Colorado: | 13.2% (145,269) |
8:30 a.m. to 8:59 a.m. - Females:
| Fort Garland: | 25.8% (9) |
| Colorado: | 6.3% (69,226) |
4:00 p.m. to 11:59 p.m. - Females:
| Fort Garland: | 18.5% (6) |
| Colorado: | 5.2% (57,495) |
Travel time to work
Percentage of workers working in this county: 82.1%
Number of people working at home: 6 (3.7% of all workers)
Number of people working at home: 6 (3.7% of all workers)


Less than 5 minutes:
| Fort Garland: | 26.0% (45) |
| Colorado: | 3.3% (72,206) |
5 to 9 minutes:
| Fort Garland: | 20.2% (35) |
| Colorado: | 10.8% (235,913) |
10 to 14 minutes:
| Fort Garland: | 15.0% (26) |
| Colorado: | 14.5% (318,642) |
15 to 19 minutes:
| Fort Garland: | 6.4% (11) |
| Colorado: | 15.2% (333,306) |
20 to 24 minutes:
| Fort Garland: | 2.9% (5) |
| Colorado: | 14.3% (313,409) |
25 to 29 minutes:
| Fort Garland: | 9.2% (16) |
| Colorado: | 5.7% (125,679) |
30 to 34 minutes:
| Fort Garland: | 11.6% (20) |
| Colorado: | 12.8% (281,268) |
35 to 39 minutes:
| Fort Garland: | 2.9% (5) |
| Colorado: | 2.6% (56,816) |
45 to 59 minutes:
| Fort Garland: | 3.5% (6) |
| Colorado: | 6.6% (145,592) |
60 to 89 minutes:
| Fort Garland: | 1.2% (2) |
| Colorado: | 3.9% (85,337) |
90 or more minutes:
| Fort Garland: | 1.2% (2) |
| Colorado: | 2.0% (43,343) |
Means of transportation to work

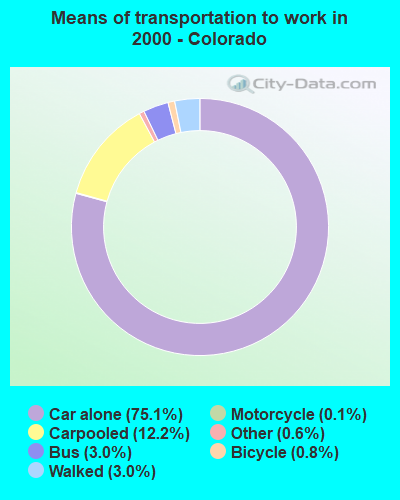
Drove car alone:
| Fort Garland: | 74.6% (129) |
| Colorado: | 75.1% (1,646,454) |
Carpooled:
| Fort Garland: | 19.1% (33) |
| Colorado: | 12.2% (268,168) |
Bus or trolley bus:
| Fort Garland: | 1.2% (2) |
| Colorado: | 3.0% (66,179) |
Walked:
| Fort Garland: | 5.2% (9) |
| Colorado: | 3.0% (65,668) |
Private vehicle occupancy

Drove alone:
| Fort Garland: | 75.9% (117) |
| Colorado: | 89.1% (2,019,886) |
In 2 person carpool:
| Fort Garland: | 24.1% (37) |
| Colorado: | 8.0% (180,543) |

Drove alone:
| Fort Garland: | 79.6% (129) |
| Colorado: | 86.0% (1,646,454) |
In 2 person carpool:
| Fort Garland: | 16.0% (26) |
| Colorado: | 11.0% (210,761) |
In 3 person carpool:
| Fort Garland: | 3.7% (6) |
| Colorado: | 2.0% (37,987) |
In 4 person carpool:
| Fort Garland: | 0.6% (1) |
| Colorado: | 0.6% (12,167) |
Class of workers

Employee of private company:
| Fort Garland: | 57.2% (115) |
| Colorado: | 66.6% (2,085,890) |
Private not-for-profit wage and salary workers:
| Fort Garland: | 10.8% (22) |
| Colorado: | 8.1% (252,887) |
Local government workers:
| Fort Garland: | 20.1% (40) |
| Colorado: | 7.5% (236,118) |
State government workers:
| Fort Garland: | 4.1% (8) |
| Colorado: | 3.6% (111,796) |
Self-employed workers in own not incorporated business:
| Fort Garland: | 7.7% (16) |
| Colorado: | 6.1% (190,717) |

Employee of private company:
| Fort Garland: | 55.0% (94) |
| Colorado: | 67.3% (1,485,056) |
Self-employed in own incorporated business:
| Fort Garland: | 2.9% (5) |
| Colorado: | 4.4% (96,165) |
Private not-for-profit wage and salary workers:
| Fort Garland: | 7.6% (13) |
| Colorado: | 6.4% (141,129) |
Local government workers:
| Fort Garland: | 14.6% (25) |
| Colorado: | 6.9% (152,123) |
State government workers:
| Fort Garland: | 9.9% (17) |
| Colorado: | 3.9% (85,273) |
Federal government workers:
| Fort Garland: | 5.3% (9) |
| Colorado: | 3.1% (68,409) |
Self-employed workers in own not incorporated business:
| Fort Garland: | 3.5% (6) |
| Colorado: | 7.7% (169,415) |
Unpaid family workers:
| Fort Garland: | 1.2% (2) |
| Colorado: | 0.3% (7,624) |

Employee of private company - Males:
| Fort Garland: | 81.0% (102) |
| Colorado: | 70.8% (1,193,195) |
State government workers - Males:
| Fort Garland: | 6.6% (8) |
| Colorado: | 3.1% (52,265) |
Self-employed workers in own not incorporated business - Males:
| Fort Garland: | 12.4% (16) |
| Colorado: | 6.2% (104,355) |

Employee of private company - Females:
| Fort Garland: | 17.8% (13) |
| Colorado: | 61.8% (892,695) |
Private not-for-profit wage and salary workers - Females:
| Fort Garland: | 28.8% (22) |
| Colorado: | 11.3% (163,456) |
Local government workers - Females:
| Fort Garland: | 53.4% (40) |
| Colorado: | 9.8% (141,408) |