Work and Jobs in Midland, Michigan (MI) Detailed Stats
Occupations, Industries, Unemployment, Workers, Commute
Settings
X


Recent posts about work in Midland, Michigan on our local forum with over 2,400,000 registered users:
 | Michigan hits lowest unemployment rate since 2001 (10 replies) |
| Any predictions about the job market post-Covid? (4 replies) |
| Possible move from South Metro Atlanta, GA to MI. Midland or Rockford? (9 replies) |
| Brain Drain Within Michigan (37 replies) |
| Which one! Moving to Midland or Gaylord with young family? (20 replies) |
| Living in Mount Pleasant vs. Midland? (4 replies) |
Latest news about work in Midland, MI collected exclusively by city-data.com from local newspapers, TV, and radio stations
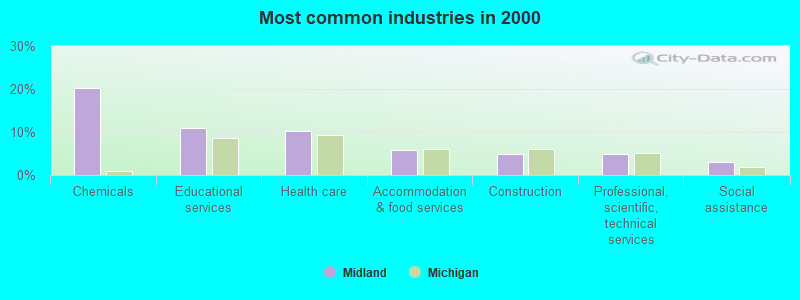
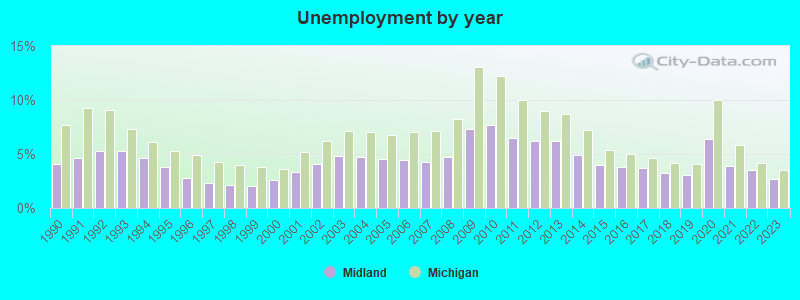
The unemployment rate in 2023 in Midland, MI was 2.7%, which was 29.6% less than the unemployment rate of 3.5% across the entire state of Michigan. Compared to the unemployment rate of 6.2% in 2013, this represents a decrease of 129.6%. The most common industries in Midland are: Chemicals (20.2% of civilian employees), Educational services (10.9% of civilian employees), Health care (10.1% of civilian employees). 70.5% of workers work in Midland County and 9.7% of all workers work at home. 69.3% of workers are employees of private companies, which is about the same as the rate of 69.8% across the entire state of Michigan.
Whole page based on the data from 2000 / 2022 when the population of Midland, Michigan was 41,685 / 42,491
Whole page based on the data from 2000 / 2022 when the population of Midland, Michigan was 41,685 / 42,491
Most common industries
Most common industries | |||
|---|---|---|---|
Industry | All | Males | Females |
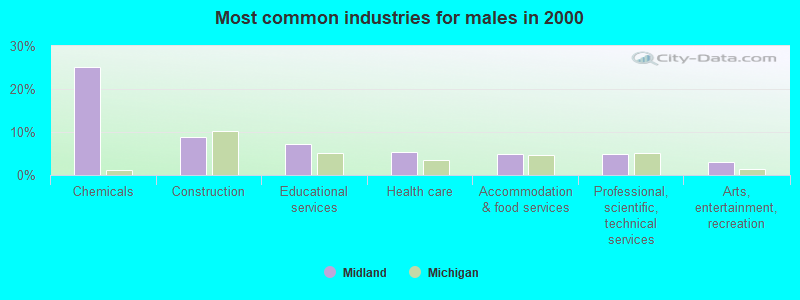
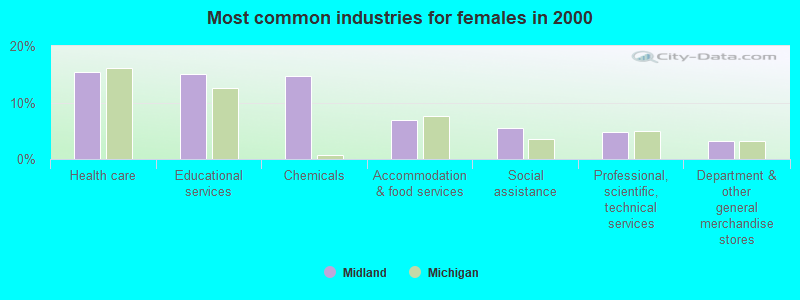
| Chemicals | 20.2% (3,988) | 25.2% (2,626) | 14.6% (1,362) |
| Educational services | 10.9% (2,152) | 7.2% (751) | 15.0% (1,401) |
| Health care | 10.1% (2,001) | 5.4% (564) | 15.4% (1,437) |
| Accommodation and food services | 5.9% (1,169) | 5.0% (521) | 7.0% (648) |
| Construction | 4.9% (970) | 8.7% (912) | 0.6% (58) |
| Professional, scientific, and technical services | 4.9% (967) | 4.9% (514) | 4.9% (453) |
| Social assistance | 3.1% (613) | 0.9% (97) | 5.5% (516) |
| Arts, entertainment, and recreation | 3.0% (595) | 3.0% (310) | 3.1% (285) |
| Public administration | 2.4% (479) | 2.7% (280) | 2.1% (199) |
| Finance and insurance | 2.3% (463) | 1.7% (176) | 3.1% (287) |
| Administrative and support and waste management services | 2.2% (433) | 2.3% (242) | 2.1% (191) |
| Department and other general merchandise stores | 2.2% (427) | 1.2% (129) | 3.2% (298) |
| Religious, grantmaking, civic, professional, and similar organizations | 1.9% (371) | 1.5% (159) | 2.3% (212) |
| Real estate and rental and leasing | 1.7% (337) | 1.2% (124) | 2.3% (213) |
| Transportation equipment | 1.5% (294) | 2.5% (256) | 0.4% (38) |
| Food and beverage stores | 1.5% (291) | 1.8% (188) | 1.1% (103) |
| Motor vehicle and parts dealers | 1.3% (264) | 2.1% (217) | 0.5% (47) |
| Printing and related support activities | 1.2% (244) | 1.5% (153) | 1.0% (91) |
| Personal and laundry services | 1.2% (243) | 0.8% (82) | 1.7% (161) |
| Building material and garden equipment and supplies dealers | 1.1% (208) | 1.2% (130) | 0.8% (78) |
| Publishing, and motion picture and sound recording industries | 1.0% (189) | 0.6% (63) | 1.4% (126) |
| Repair and maintenance | 0.9% (182) | 1.6% (166) | 0.2% (16) |
| Data processing, libraries, and other information services | 0.9% (177) | 0.7% (69) | 1.2% (108) |
| Miscellaneous manufacturing | 0.8% (149) | 0.9% (99) | 0.5% (50) |
| Machinery | 0.7% (148) | 1.1% (117) | 0.3% (31) |
| Computer and electronic products | 0.7% (147) | 0.9% (90) | 0.6% (57) |
| Broadcasting and telecommunications | 0.7% (140) | 0.8% (81) | 0.6% (59) |
| Utilities | 0.7% (138) | 1.2% (129) | 0.1% (9) |
| Plastics and rubber products | 0.7% (132) | 0.8% (82) | 0.5% (50) |
| Clothing and accessories, including shoe, stores | 0.5% (103) | 0.1% (9) | 1.0% (94) |
| Furniture and related product manufacturing | 0.5% (103) | 0.6% (64) | 0.4% (39) |
| Other transportation, and support activities, and couriers | 0.5% (100) | 0.6% (67) | 0.4% (33) |
| Radio, TV, and computer stores | 0.5% (89) | 0.8% (84) | 0.1% (5) |
| Furniture and home furnishings, and household appliance stores | 0.4% (85) | 0.5% (49) | 0.4% (36) |
| Food | 0.4% (76) | 0.3% (32) | 0.5% (44) |
| Metal and metal products | 0.4% (76) | 0.6% (62) | 0.2% (14) |
| Private households | 0.4% (75) | 0.0% (0) | 0.8% (75) |
| Groceries and related products merchant wholesalers | 0.4% (70) | 0.5% (55) | 0.2% (15) |
| U. S. Postal service | 0.3% (68) | 0.4% (40) | 0.3% (28) |
| Pharmacies and drug stores | 0.3% (62) | 0.4% (40) | 0.2% (22) |
| Used merchandise, gift, novelty, and souvenir, and other miscellaneous stores | 0.3% (59) | 0.3% (30) | 0.3% (29) |
| Drugs, sundries, and chemical and allied products merchant wholesalers | 0.3% (53) | 0.5% (53) | 0.0% (0) |
| Truck transportation | 0.3% (53) | 0.5% (48) | 0.1% (5) |
| Miscellaneous nondurable goods merchant wholesalers | 0.3% (51) | 0.4% (46) | 0.1% (5) |
| Health and personal care, except drug, stores | 0.2% (49) | 0.0% (5) | 0.5% (44) |
| Office supplies and stationery stores | 0.2% (48) | 0.4% (38) | 0.1% (10) |
| Air transportation | 0.2% (41) | 0.3% (28) | 0.1% (13) |
| Other direct selling establishments | 0.2% (36) | 0.1% (14) | 0.2% (22) |
| Retail florists | 0.2% (36) | 0.1% (9) | 0.3% (27) |
| Machinery, equipment, and supplies merchant wholesalers | 0.2% (33) | 0.2% (18) | 0.2% (15) |
| Motor vehicles, parts and supplies merchant wholesalers | 0.2% (32) | 0.2% (18) | 0.2% (14) |
| Gasoline stations | 0.2% (31) | 0.1% (15) | 0.2% (16) |
| Miscellaneous durable goods merchant wholesalers | 0.2% (31) | 0.0% (4) | 0.3% (27) |
| Agriculture, forestry, fishing and hunting | 0.2% (31) | 0.3% (31) | 0.0% (0) |
| Hardware, plumbing and heating equipment, and supplies merchant wholesalers | 0.1% (29) | 0.2% (23) | 0.1% (6) |
| Management of companies and enterprises | 0.1% (29) | 0.2% (23) | 0.1% (6) |
| Alcoholic beverages merchant wholesalers | 0.1% (28) | 0.3% (28) | 0.0% (0) |
| Jewelry, luggage, and leather goods stores | 0.1% (28) | 0.0% (0) | 0.3% (28) |
| Electrical and electronic goods merchant wholesalers | 0.1% (28) | 0.3% (28) | 0.0% (0) |
| Sporting goods, camera, and hobby and toy stores | 0.1% (25) | 0.1% (8) | 0.2% (17) |
| Furniture and home furnishing merchant wholesalers | 0.1% (24) | 0.2% (17) | 0.1% (7) |
| Metals and minerals, except petroleum, merchant wholesalers | 0.1% (16) | 0.2% (16) | 0.0% (0) |
| Petroleum and coal products | 0.1% (12) | 0.1% (12) | 0.0% (0) |
Unemployment in Midland
- Unemployment by race in 2022
- Unemployment rate for White non-Hispanic residents
- 3.9%Males
- 3.8%Females
- Unemployment rate for Black residents
- 8.8%Males
- 8.1%Females
- Unemployment rate for Asian residents
- 1.7%Males
- Unemployment rate for other race residents
- 10.0%Females
- Unemployment rate for Hispanic or Latino residents
- 4.0%Females
- Unemployment by race in 2000
- Unemployment rate for White non-Hispanic residents
- 4.4%Males
- 3.5%Females
- Unemployment rate for Black residents
- 19.2%Males
- 6.9%Females
- Unemployment rate for Asian residents
- 2.7%Males
- Unemployment rate for two or more race residents
- 14.3%Males
- 3.2%Females
- Unemployment rate for Hispanic or Latino residents
- 10.4%Males
- 7.3%Females
Unemployment in 2023:
| Midland: | 2.7% |
| Michigan: | 3.5% |
Unemployment in 2022:
| Midland: | 3.5% |
| Michigan: | 4.2% |
Unemployment in 2021:
| Midland: | 3.9% |
| Michigan: | 5.8% |
Unemployment in 2020:
| Midland: | 6.4% |
| Michigan: | 10.0% |
Unemployment in 2019:
| Midland: | 3.1% |
| Michigan: | 4.1% |
Unemployment in 2018:
| Midland: | 3.2% |
| Michigan: | 4.2% |
Unemployment in 2017:
| Midland: | 3.7% |
| Michigan: | 4.6% |
Unemployment in 2016:
| Midland: | 3.8% |
| Michigan: | 5.0% |
Unemployment in 2015:
| Midland: | 4.0% |
| Michigan: | 5.4% |
Unemployment in 2014:
| Midland: | 4.9% |
| Michigan: | 7.2% |
Unemployment in 2013:
| Midland: | 6.2% |
| Michigan: | 8.7% |
Unemployment in 2012:
| Midland: | 6.2% |
| Michigan: | 9.0% |
Unemployment in 2011:
| Midland: | 6.5% |
| Michigan: | 10.0% |
Unemployment in 2010:
| Midland: | 7.7% |
| Michigan: | 12.2% |
Unemployment in 2009:
| Midland: | 7.3% |
| Michigan: | 13.1% |
Unemployment in 2008:
| Midland: | 4.7% |
| Michigan: | 8.2% |
Unemployment in 2007:
| Midland: | 4.3% |
| Michigan: | 7.1% |
Unemployment in 2006:
| Midland: | 4.4% |
| Michigan: | 7.0% |
Unemployment in 2005:
| Midland: | 4.5% |
| Michigan: | 6.8% |
Unemployment in 2004:
| Midland: | 4.7% |
| Michigan: | 7.0% |
Unemployment in 2003:
| Midland: | 4.8% |
| Michigan: | 7.1% |
Unemployment in 2002:
| Midland: | 4.1% |
| Michigan: | 6.2% |
Unemployment in 2001:
| Midland: | 3.3% |
| Michigan: | 5.2% |
Unemployment in 2000:
| Midland: | 2.6% |
| Michigan: | 3.6% |
Unemployment in 1999:
| Midland: | 2.0% |
| Michigan: | 3.8% |
Unemployment in 1998:
| Midland: | 2.1% |
| Michigan: | 4.0% |
Unemployment in 1997:
| Midland: | 2.3% |
| Michigan: | 4.3% |
Unemployment in 1996:
| Midland: | 2.8% |
| Michigan: | 4.9% |
Unemployment in 1995:
| Midland: | 3.8% |
| Michigan: | 5.3% |
Unemployment in 1994:
| Midland: | 4.6% |
| Michigan: | 6.1% |
Unemployment in 1993:
| Midland: | 5.3% |
| Michigan: | 7.3% |
Unemployment in 1992:
| Midland: | 5.3% |
| Michigan: | 9.1% |
Unemployment in 1991:
| Midland: | 4.6% |
| Michigan: | 9.3% |
Unemployment in 1990:
| Midland: | 4.1% |
| Michigan: | 7.7% |
Time leaving home to go to work
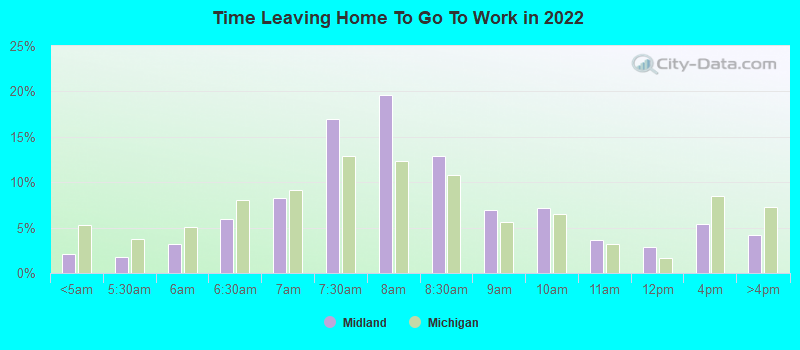
12:00 a.m. to 4:59 a.m.:
| Midland: | 2.1% (360) |
| Michigan: | 5.3% (217,059) |
5:00 a.m. to 5:29 a.m.:
| Midland: | 1.8% (311) |
| Michigan: | 3.8% (153,609) |
5:30 a.m. to 5:59 a.m.:
| Midland: | 3.2% (560) |
| Michigan: | 5.1% (205,261) |
6:00 a.m. to 6:29 a.m.:
| Midland: | 6.0% (1,036) |
| Michigan: | 8.0% (325,839) |
6:30 a.m. to 6:59 a.m.:
| Midland: | 8.3% (1,435) |
| Michigan: | 9.1% (371,022) |
7:00 a.m. to 7:29 a.m.:
| Midland: | 17.0% (2,948) |
| Michigan: | 12.8% (521,843) |
7:30 a.m. to 7:59 a.m.:
| Midland: | 19.6% (3,396) |
| Michigan: | 12.4% (502,248) |
8:00 a.m. to 8:29 a.m.:
| Midland: | 12.9% (2,231) |
| Michigan: | 10.8% (438,208) |
8:30 a.m. to 8:59 a.m.:
| Midland: | 7.0% (1,209) |
| Michigan: | 5.6% (229,029) |
9:00 a.m. to 9:59 a.m.:
| Midland: | 7.2% (1,243) |
| Michigan: | 6.5% (265,944) |
10:00 a.m. to 10:59 a.m.:
| Midland: | 3.6% (624) |
| Michigan: | 3.2% (130,748) |
11:00 a.m. to 11:59 a.m.:
| Midland: | 2.8% (491) |
| Michigan: | 1.6% (65,426) |
12:00 p.m. to 3:59 p.m.:
| Midland: | 5.4% (932) |
| Michigan: | 8.5% (343,555) |
4:00 p.m. to 11:59 p.m.:
| Midland: | 4.2% (730) |
| Michigan: | 7.2% (293,541) |

<5am:
| Midland: | 1.7% (337) |
| Michigan: | 3.4% (156,327) |
5:30am:
| Midland: | 1.0% (199) |
| Michigan: | 3.1% (139,699) |
6am:
| Midland: | 2.1% (407) |
| Michigan: | 4.7% (211,446) |
6:30am:
| Midland: | 4.8% (943) |
| Michigan: | 7.7% (349,878) |
7am:
| Midland: | 8.7% (1,699) |
| Michigan: | 9.8% (446,636) |
7:30am:
| Midland: | 17.0% (3,322) |
| Michigan: | 13.2% (597,402) |
8am:
| Midland: | 23.7% (4,629) |
| Michigan: | 15.3% (692,901) |
8:30am:
| Midland: | 10.8% (2,114) |
| Michigan: | 9.9% (448,050) |
9am:
| Midland: | 6.0% (1,162) |
| Michigan: | 5.2% (235,689) |
10am:
| Midland: | 4.1% (793) |
| Michigan: | 5.1% (233,210) |
11am:
| Midland: | 1.9% (375) |
| Michigan: | 2.2% (98,395) |
12pm:
| Midland: | 1.4% (272) |
| Michigan: | 1.1% (50,205) |
4pm:
| Midland: | 6.8% (1,328) |
| Michigan: | 8.6% (391,612) |
>4pm:
| Midland: | 6.8% (1,318) |
| Michigan: | 8.0% (361,157) |

12:00 a.m. to 4:59 a.m. - Males:
| Midland: | 2.5% (231) |
| Michigan: | 6.9% (150,486) |
5:00 a.m. to 5:29 a.m. - Males:
| Midland: | 2.7% (256) |
| Michigan: | 5.0% (108,967) |
5:30 a.m. to 5:59 a.m. - Males:
| Midland: | 3.8% (359) |
| Michigan: | 6.3% (136,770) |
6:00 a.m. to 6:29 a.m. - Males:
| Midland: | 6.5% (608) |
| Michigan: | 9.5% (205,411) |
6:30 a.m. to 6:59 a.m. - Males:
| Midland: | 8.6% (810) |
| Michigan: | 9.5% (206,578) |
7:00 a.m. to 7:29 a.m. - Males:
| Midland: | 21.6% (2,029) |
| Michigan: | 12.2% (265,994) |
7:30 a.m. to 7:59 a.m. - Males:
| Midland: | 16.0% (1,501) |
| Michigan: | 11.2% (242,506) |
8:00 a.m. to 8:29 a.m. - Males:
| Midland: | 15.5% (1,460) |
| Michigan: | 9.7% (211,431) |
8:30 a.m. to 8:59 a.m. - Males:
| Midland: | 7.0% (654) |
| Michigan: | 4.7% (101,817) |
9:00 a.m. to 9:59 a.m. - Males:
| Midland: | 3.8% (352) |
| Michigan: | 5.8% (125,232) |
10:00 a.m. to 10:59 a.m. - Males:
| Midland: | 1.6% (149) |
| Michigan: | 2.7% (58,514) |
11:00 a.m. to 11:59 a.m. - Males:
| Midland: | 2.8% (261) |
| Michigan: | 1.4% (30,535) |
12:00 p.m. to 3:59 p.m. - Males:
| Midland: | 4.2% (391) |
| Michigan: | 8.3% (180,250) |
4:00 p.m. to 11:59 p.m. - Males:
| Midland: | 5.0% (473) |
| Michigan: | 6.8% (148,394) |

12:00 a.m. to 4:59 a.m. - Females:
| Midland: | 3.2% (253) |
| Michigan: | 3.5% (66,573) |
5:00 a.m. to 5:29 a.m. - Females:
| Midland: | 0.6% (49) |
| Michigan: | 2.4% (44,642) |
5:30 a.m. to 5:59 a.m. - Females:
| Midland: | 2.6% (209) |
| Michigan: | 3.6% (68,491) |
6:00 a.m. to 6:29 a.m. - Females:
| Midland: | 5.2% (414) |
| Michigan: | 6.4% (120,428) |
6:30 a.m. to 6:59 a.m. - Females:
| Midland: | 8.0% (637) |
| Michigan: | 8.7% (164,444) |
7:00 a.m. to 7:29 a.m. - Females:
| Midland: | 12.1% (961) |
| Michigan: | 13.5% (255,849) |
7:30 a.m. to 7:59 a.m. - Females:
| Midland: | 23.7% (1,886) |
| Michigan: | 13.7% (259,742) |
8:00 a.m. to 8:29 a.m. - Females:
| Midland: | 10.2% (811) |
| Michigan: | 12.0% (226,777) |
8:30 a.m. to 8:59 a.m. - Females:
| Midland: | 7.0% (558) |
| Michigan: | 6.7% (127,212) |
9:00 a.m. to 9:59 a.m. - Females:
| Midland: | 11.2% (891) |
| Michigan: | 7.4% (140,712) |
10:00 a.m. to 10:59 a.m. - Females:
| Midland: | 6.2% (490) |
| Michigan: | 3.8% (72,234) |
11:00 a.m. to 11:59 a.m. - Females:
| Midland: | 0.7% (57) |
| Michigan: | 1.8% (34,891) |
12:00 p.m. to 3:59 p.m. - Females:
| Midland: | 6.9% (549) |
| Michigan: | 8.6% (163,305) |
4:00 p.m. to 11:59 p.m. - Females:
| Midland: | 3.3% (263) |
| Michigan: | 7.7% (145,147) |
Travel time to work
Percentage of workers working in this county: 70.5%
Number of people working at home: 1,891 (9.7% of all workers)
Daytime population change due to commuting: +13,419 (+32.2%)
Workers who live and work in this city: 14,104 (72.3%)
Number of people working at home: 1,891 (9.7% of all workers)
Daytime population change due to commuting: +13,419 (+32.2%)
Workers who live and work in this city: 14,104 (72.3%)

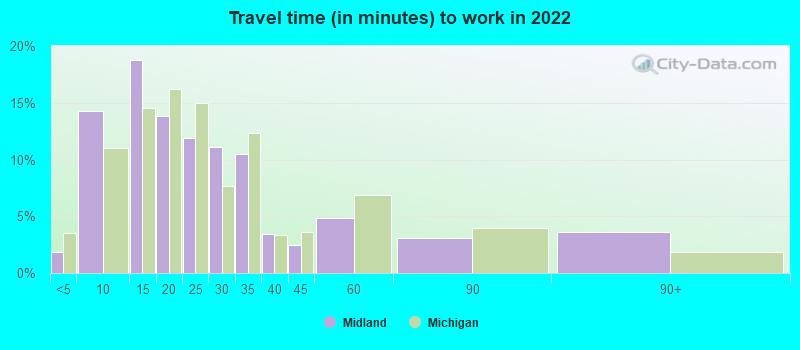

Less than 5 minutes:
| Midland: | 1.8% (569) |
| Michigan: | 3.6% (143,584) |
5 to 9 minutes:
| Midland: | 14.3% (4,420) |
| Michigan: | 11.0% (442,434) |
10 to 14 minutes:
| Midland: | 18.8% (5,800) |
| Michigan: | 14.5% (585,037) |
15 to 19 minutes:
| Midland: | 13.8% (4,275) |
| Michigan: | 16.2% (652,002) |
20 to 24 minutes:
| Midland: | 11.9% (3,684) |
| Michigan: | 15.0% (604,197) |
25 to 29 minutes:
| Midland: | 11.1% (3,432) |
| Michigan: | 7.7% (309,175) |
30 to 34 minutes:
| Midland: | 10.5% (3,246) |
| Michigan: | 12.4% (498,080) |
35 to 39 minutes:
| Midland: | 3.5% (1,073) |
| Michigan: | 3.4% (136,295) |
40 to 44 minutes:
| Midland: | 2.5% (767) |
| Michigan: | 3.6% (144,954) |
45 to 59 minutes:
| Midland: | 4.8% (1,491) |
| Michigan: | 6.9% (278,387) |
60 to 89 minutes:
| Midland: | 3.1% (955) |
| Michigan: | 4.0% (159,456) |
90 or more minutes:
| Midland: | 3.6% (1,125) |
| Michigan: | 1.9% (76,015) |


Less than 5 minutes:
| Midland: | 4.7% (917) |
| Michigan: | 3.5% (158,315) |
5 to 9 minutes:
| Midland: | 23.0% (4,480) |
| Michigan: | 11.2% (507,653) |
10 to 14 minutes:
| Midland: | 28.3% (5,517) |
| Michigan: | 15.0% (681,990) |
15 to 19 minutes:
| Midland: | 15.7% (3,055) |
| Michigan: | 15.6% (708,036) |
20 to 24 minutes:
| Midland: | 6.9% (1,346) |
| Michigan: | 14.9% (675,865) |
25 to 29 minutes:
| Midland: | 2.7% (525) |
| Michigan: | 6.4% (291,938) |
30 to 34 minutes:
| Midland: | 6.4% (1,243) |
| Michigan: | 12.0% (546,870) |
35 to 39 minutes:
| Midland: | 1.9% (363) |
| Michigan: | 2.8% (126,158) |
40 to 44 minutes:
| Midland: | 2.3% (453) |
| Michigan: | 3.3% (147,930) |
45 to 59 minutes:
| Midland: | 2.6% (500) |
| Michigan: | 6.7% (304,785) |
60 to 89 minutes:
| Midland: | 1.2% (227) |
| Michigan: | 3.8% (171,403) |
90 or more minutes:
| Midland: | 1.4% (272) |
| Michigan: | 2.0% (91,664) |

Less than 5 minutes - Males:
| Midland: | 1.4% (228) |
| Michigan: | 3.5% (75,744) |
5 to 9 minutes - Males:
| Midland: | 12.7% (2,000) |
| Michigan: | 9.5% (205,370) |
10 to 14 minutes - Males:
| Midland: | 21.1% (3,320) |
| Michigan: | 13.2% (284,763) |
15 to 19 minutes - Males:
| Midland: | 17.2% (2,715) |
| Michigan: | 15.9% (341,778) |
20 to 24 minutes - Males:
| Midland: | 10.8% (1,708) |
| Michigan: | 14.5% (312,847) |
25 to 29 minutes - Males:
| Midland: | 10.8% (1,699) |
| Michigan: | 7.8% (167,430) |
30 to 34 minutes - Males:
| Midland: | 10.1% (1,585) |
| Michigan: | 12.8% (274,470) |
35 to 39 minutes - Males:
| Midland: | 2.3% (365) |
| Michigan: | 3.6% (76,783) |
40 to 44 minutes - Males:
| Midland: | 2.6% (417) |
| Michigan: | 3.9% (84,238) |
45 to 59 minutes - Males:
| Midland: | 5.1% (804) |
| Michigan: | 8.0% (172,374) |
60 to 89 minutes - Males:
| Midland: | 4.4% (688) |
| Michigan: | 4.8% (103,060) |
90 or more minutes - Males:
| Midland: | 1.7% (271) |
| Michigan: | 2.4% (51,962) |

Less than 5 minutes - Females:
| Midland: | 2.3% (348) |
| Michigan: | 3.6% (67,840) |
5 to 9 minutes - Females:
| Midland: | 15.9% (2,410) |
| Michigan: | 12.6% (237,064) |
10 to 14 minutes - Females:
| Midland: | 16.3% (2,463) |
| Michigan: | 16.0% (300,274) |
15 to 19 minutes - Females:
| Midland: | 10.0% (1,511) |
| Michigan: | 16.5% (310,224) |
20 to 24 minutes - Females:
| Midland: | 13.0% (1,970) |
| Michigan: | 15.5% (291,350) |
25 to 29 minutes - Females:
| Midland: | 11.5% (1,743) |
| Michigan: | 7.5% (141,745) |
30 to 34 minutes - Females:
| Midland: | 11.0% (1,662) |
| Michigan: | 11.9% (223,610) |
35 to 39 minutes - Females:
| Midland: | 4.7% (713) |
| Michigan: | 3.2% (59,512) |
40 to 44 minutes - Females:
| Midland: | 2.3% (354) |
| Michigan: | 3.2% (60,716) |
45 to 59 minutes - Females:
| Midland: | 4.6% (695) |
| Michigan: | 5.6% (106,013) |
60 to 89 minutes - Females:
| Midland: | 1.8% (267) |
| Michigan: | 3.0% (56,396) |
90 or more minutes - Females:
| Midland: | 6.3% (950) |
| Michigan: | 1.3% (24,053) |
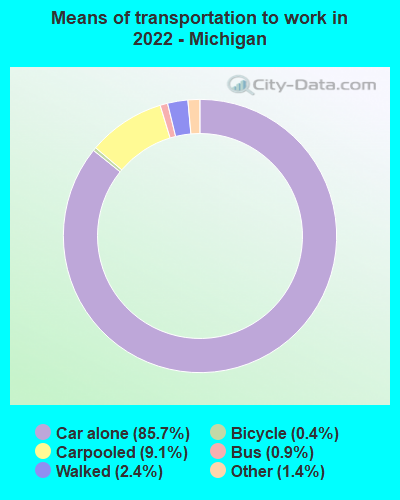
Means of transportation to work
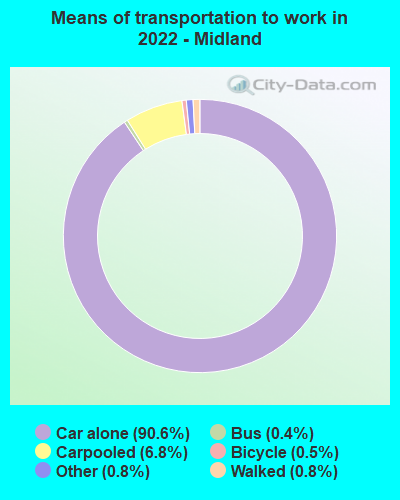
Drove car alone:
| Midland: | 90.6% (27,747) |
| Michigan: | 85.7% (1,595,046) |
Carpooled:
| Midland: | 6.8% (2,093) |
| Michigan: | 9.1% (187,180) |
Bus:
| Midland: | 0.4% (122) |
| Michigan: | 0.9% (20,524) |
Long-distance train or commuter rail:
| Midland: | 0.0% (7) |
| Michigan: | 0.0% (26) |
Ferryboat:
| Midland: | 0.0% (2) |
| Michigan: | 0.0% (706) |
Bicycle:
| Midland: | 0.5% (150) |
| Michigan: | 0.4% (5,746) |
Walked:
| Midland: | 0.8% (244) |
| Michigan: | 2.4% (44,504) |
Other means:
| Midland: | 0.8% (249) |
| Michigan: | 1.4% (25,014) |


Drove car alone:
| Midland: | 87.4% (17,049) |
| Michigan: | 83.2% (3,776,535) |
Carpooled:
| Midland: | 6.3% (1,234) |
| Michigan: | 9.7% (440,606) |
Bus or trolley bus:
| Midland: | 0.4% (86) |
| Michigan: | 1.2% (54,423) |
Streetcar or trolley car:
| Midland: | 0.0% (5) |
| Michigan: | 0.0% (560) |
Subway or elevated:
| Midland: | 0.1% (10) |
| Michigan: | 0.0% (576) |
Taxicab:
| Midland: | 0.0% (7) |
| Michigan: | 0.1% (4,222) |
Motorcycle:
| Midland: | 0.0% (8) |
| Michigan: | 0.0% (1,698) |
Bicycle:
| Midland: | 0.4% (73) |
| Michigan: | 0.2% (10,034) |
Walked:
| Midland: | 1.8% (350) |
| Michigan: | 2.2% (101,506) |
Other means:
| Midland: | 0.4% (76) |
| Michigan: | 0.5% (21,691) |


Drove car alone - Males:
| Midland: | 90.3% (13,778) |
| Michigan: | 86.5% (1,595,046) |
Carpooled - Males:
| Midland: | 6.2% (948) |
| Michigan: | 8.4% (187,180) |
Bus - Males:
| Midland: | 0.4% (57) |
| Michigan: | 0.8% (20,524) |
Long-distance train or commuter rail - Males:
| Midland: | 0.0% (7) |
| Michigan: | 0.0% (26) |
Bicycle - Males:
| Midland: | 0.9% (141) |
| Michigan: | 0.5% (5,746) |
Walked - Males:
| Midland: | 1.0% (147) |
| Michigan: | 2.4% (44,504) |
Other means - Males:
| Midland: | 1.2% (184) |
| Michigan: | 1.4% (25,014) |

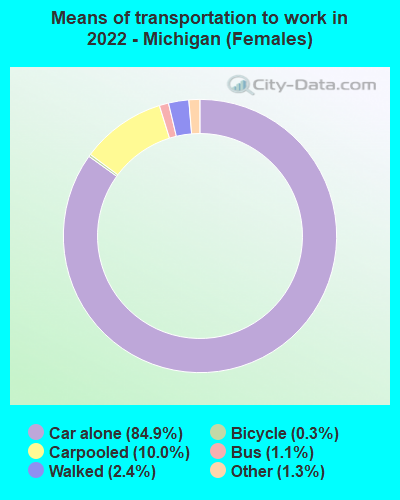
Drove car alone - Females:
| Midland: | 91.0% (13,971) |
| Michigan: | 84.9% (1,595,046) |
Carpooled - Females:
| Midland: | 7.5% (1,146) |
| Michigan: | 10.0% (187,180) |
Bus - Females:
| Midland: | 0.4% (65) |
| Michigan: | 1.1% (20,524) |
Ferryboat - Females:
| Midland: | 0.0% (2) |
| Michigan: | 0.0% (706) |
Bicycle - Females:
| Midland: | 0.1% (9) |
| Michigan: | 0.3% (5,746) |
Walked - Females:
| Midland: | 0.6% (97) |
| Michigan: | 2.4% (44,504) |
Other means - Females:
| Midland: | 0.4% (64) |
| Michigan: | 1.3% (25,014) |
Private vehicle occupancy

Drove alone:
| Midland: | 91.7% (14,935) |
| Michigan: | 90.4% (3,484,723) |
In 2 person carpool:
| Midland: | 6.4% (1,041) |
| Michigan: | 7.3% (282,230) |
In 3 person carpool:
| Midland: | 1.2% (200) |
| Michigan: | 1.4% (52,118) |
In 4 person carpool:
| Midland: | 0.3% (43) |
| Michigan: | 0.5% (20,051) |
In 5-6 person carpool:
| Midland: | 0.1% (20) |
| Michigan: | 0.3% (10,433) |
In 7+ person carpool:
| Midland: | 0.2% (38) |
| Michigan: | 0.1% (4,936) |

Drove alone:
| Midland: | 93.3% (17,049) |
| Michigan: | 89.6% (3,776,535) |
In 2 person carpool:
| Midland: | 5.9% (1,070) |
| Michigan: | 8.5% (358,473) |
In 3 person carpool:
| Midland: | 0.8% (148) |
| Michigan: | 1.3% (53,301) |
In 4 person carpool:
| Midland: | 0.1% (16) |
| Michigan: | 0.4% (16,740) |
Class of workers
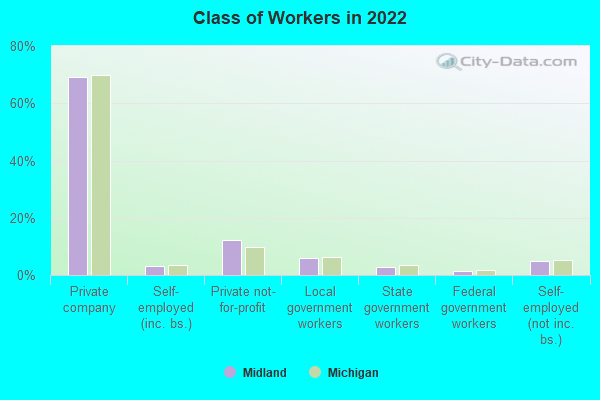
Employee of private company:
| Midland: | 69.3% (13,847) |
| Michigan: | 69.8% (3,350,300) |
Self-employed in own incorporated business:
| Midland: | 3.0% (595) |
| Michigan: | 3.5% (168,846) |
Private not-for-profit wage and salary workers:
| Midland: | 12.3% (2,467) |
| Michigan: | 9.8% (468,535) |
Local government workers:
| Midland: | 5.9% (1,185) |
| Michigan: | 6.3% (300,493) |
State government workers:
| Midland: | 3.0% (592) |
| Michigan: | 3.6% (171,998) |
Federal government workers:
| Midland: | 1.6% (313) |
| Michigan: | 1.6% (76,540) |
Self-employed workers in own not incorporated business:
| Midland: | 4.8% (964) |
| Michigan: | 5.3% (256,382) |
Unpaid family workers:
| Midland: | 0.1% (25) |
| Michigan: | 0.1% (7,134) |

Employee of private company:
| Midland: | 69.8% (13,782) |
| Michigan: | 71.9% (3,336,174) |
Self-employed in own incorporated business:
| Midland: | 1.7% (327) |
| Michigan: | 3.1% (145,931) |
Private not-for-profit wage and salary workers:
| Midland: | 12.2% (2,404) |
| Michigan: | 8.0% (370,593) |
Local government workers:
| Midland: | 7.7% (1,530) |
| Michigan: | 6.2% (285,684) |
State government workers:
| Midland: | 2.3% (459) |
| Michigan: | 3.7% (170,984) |
Federal government workers:
| Midland: | 0.7% (139) |
| Michigan: | 1.5% (71,533) |
Self-employed workers in own not incorporated business:
| Midland: | 5.4% (1,073) |
| Michigan: | 5.2% (243,300) |
Unpaid family workers:
| Midland: | 0.2% (33) |
| Michigan: | 0.3% (13,262) |

Employee of private company - Males:
| Midland: | 72.0% (7,477) |
| Michigan: | 74.4% (1,882,423) |
Self-employed in own incorporated business - Males:
| Midland: | 3.5% (366) |
| Michigan: | 4.6% (115,825) |
Private not-for-profit wage and salary workers - Males:
| Midland: | 8.7% (904) |
| Michigan: | 6.0% (151,243) |
Local government workers - Males:
| Midland: | 6.0% (624) |
| Michigan: | 4.4% (111,027) |
State government workers - Males:
| Midland: | 2.8% (287) |
| Michigan: | 2.9% (74,018) |
Federal government workers - Males:
| Midland: | 2.7% (278) |
| Michigan: | 1.6% (39,580) |
Self-employed workers in own not incorporated business - Males:
| Midland: | 4.4% (453) |
| Michigan: | 6.0% (152,865) |

Employee of private company - Females:
| Midland: | 66.4% (6,369) |
| Michigan: | 64.7% (1,467,877) |
Self-employed in own incorporated business - Females:
| Midland: | 2.4% (229) |
| Michigan: | 2.3% (53,021) |
Private not-for-profit wage and salary workers - Females:
| Midland: | 16.3% (1,563) |
| Michigan: | 14.0% (317,292) |
Local government workers - Females:
| Midland: | 5.8% (561) |
| Michigan: | 8.3% (189,466) |
State government workers - Females:
| Midland: | 3.2% (305) |
| Michigan: | 4.3% (97,980) |
Federal government workers - Females:
| Midland: | 0.4% (35) |
| Michigan: | 1.6% (36,960) |
Self-employed workers in own not incorporated business - Females:
| Midland: | 5.3% (511) |
| Michigan: | 4.6% (103,517) |
Unpaid family workers - Females:
| Midland: | 0.3% (25) |
| Michigan: | 0.1% (3,217) |