Work and Jobs in San Buenaventura (Ventura), California (CA) Detailed Stats
Occupations, Industries, Unemployment, Workers, Commute
Settings
X


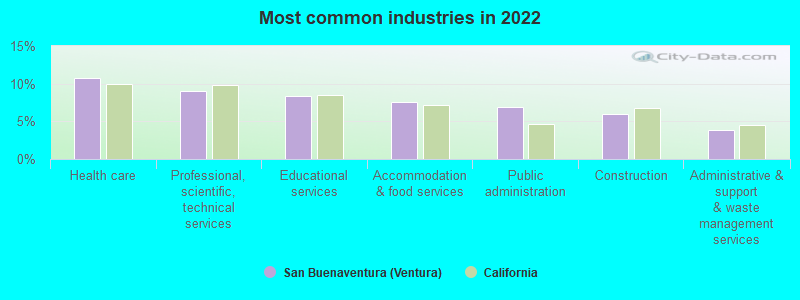
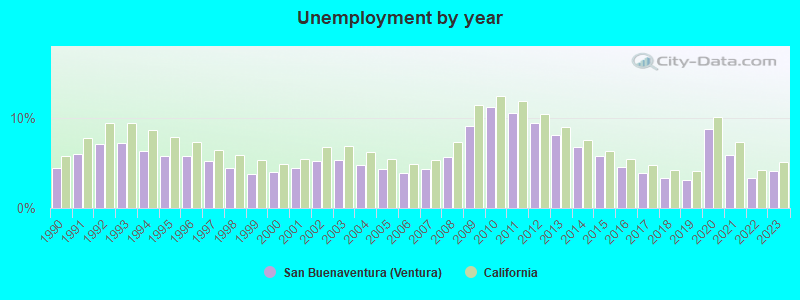
The unemployment rate in 2023 in San Buenaventura (Ventura), CA was 4.1%, which was 24.4% less than the unemployment rate of 5.1% across the entire state of California. Compared to the unemployment rate of 8.1% in 2013, this represents a decrease of 97.6%. According to 2022 data, the most common industries in San Buenaventura (Ventura) are: Health care (10.7% of civilian employees), Professional, scientific, technical services (9.0% of civilian employees), Educational services (8.4% of civilian employees). 84.7% of workers work in Ventura County and 14.9% of all workers work at home. 58.2% of workers are employees of private companies, which is 14.3% less than the rate of 66.5% across the entire state of California.
Whole page based on the data from 2000 / 2022 when the population of San Buenaventura (Ventura), California was 100,916 / 109,528
Whole page based on the data from 2000 / 2022 when the population of San Buenaventura (Ventura), California was 100,916 / 109,528
Most common industries


Most common industries | Most common industries | |||||
|---|---|---|---|---|---|---|
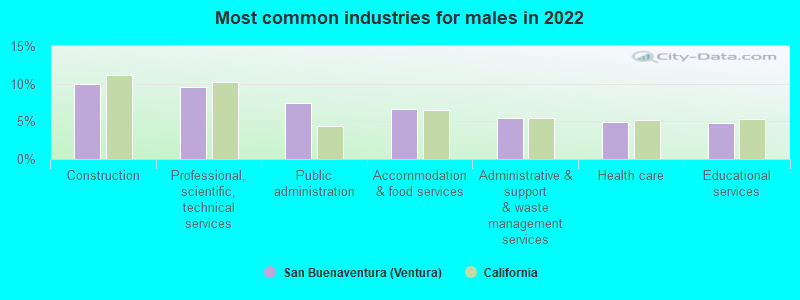
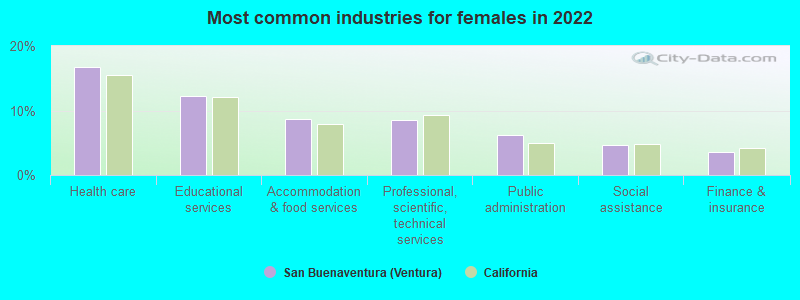
Industry | All | Males | Females | All | Males | Females |
| Health care | 10.7% (6,355) | 4.9% (1,491) | 16.8% (4,864) | 9.0% (4,476) | 4.4% (1,166) | 14.2% (3,310) |
| Professional, scientific, and technical services | 9.0% (5,352) | 9.5% (2,893) | 8.5% (2,459) | 7.2% (3,582) | 7.2% (1,909) | 7.2% (1,673) |
| Educational services | 8.4% (4,977) | 4.8% (1,451) | 12.2% (3,526) | 9.2% (4,585) | 5.4% (1,428) | 13.5% (3,157) |
| Accommodation and food services | 7.6% (4,517) | 6.7% (2,021) | 8.6% (2,496) | 6.1% (3,055) | 5.8% (1,541) | 6.5% (1,514) |
| Public administration | 6.9% (4,073) | 7.5% (2,274) | 6.2% (1,799) | 7.9% (3,924) | 8.3% (2,193) | 7.4% (1,731) |
| Construction | 6.0% (3,567) | 10.0% (3,020) | 1.9% (547) | 6.4% (3,171) | 10.6% (2,802) | 1.6% (369) |
| Administrative and support and waste management services | 3.8% (2,261) | 5.5% (1,662) | 2.1% (599) | 3.9% (1,958) | 4.6% (1,212) | 3.2% (746) |
| Finance and insurance | 3.2% (1,886) | 2.8% (836) | 3.6% (1,050) | 4.1% (2,032) | 3.0% (797) | 5.3% (1,235) |
| Arts, entertainment, and recreation | 2.9% (1,734) | 3.2% (973) | 2.6% (761) | 1.9% (947) | 1.9% (514) | 1.9% (433) |
| Social assistance | 2.5% (1,510) | 0.6% (182) | 4.6% (1,328) | 2.2% (1,081) | 0.7% (175) | 3.9% (906) |
| Personal and laundry services | 2.5% (1,471) | 1.5% (466) | 3.5% (1,005) | 1.5% (748) | 1.0% (260) | 2.1% (488) |
| Food and beverage stores | 2.4% (1,412) | 1.7% (519) | 3.1% (893) | 1.7% (841) | 1.6% (417) | 1.8% (424) |
| Real estate and rental and leasing | 1.9% (1,105) | 1.7% (520) | 2.0% (585) | 2.4% (1,204) | 2.4% (638) | 2.4% (566) |
| Computer and electronic products | 1.7% (1,036) | 2.4% (714) | 1.1% (322) | 1.7% (851) | 2.1% (542) | 1.3% (309) |
| Utilities | 1.6% (963) | 2.7% (809) | 0.5% (154) | 0.8% (400) | 1.2% (311) | 0.4% (89) |
| Agriculture, forestry, fishing and hunting | 1.5% (864) | 2.0% (600) | 0.9% (264) | 1.3% (650) | 1.8% (484) | 0.7% (166) |
| Miscellaneous manufacturing | 1.3% (776) | 2.1% (635) | 0.5% (141) | 2.1% (1,041) | 2.5% (664) | 1.6% (377) |
| Department and other general merchandise stores | 1.2% (712) | 0.7% (207) | 1.7% (505) | 1.6% (797) | 1.1% (297) | 2.1% (500) |
| Clothing and accessories, including shoe, stores | 1.2% (699) | 1.3% (391) | 1.1% (308) | 0.8% (380) | 0.5% (121) | 1.1% (259) |
| Publishing, and motion picture and sound recording industries | 1.1% (667) | 1.7% (505) | 0.6% (162) | 1.6% (820) | 1.8% (480) | 1.5% (340) |
| Religious, grantmaking, civic, professional, and similar organizations | 1.1% (649) | 0.8% (245) | 1.4% (404) | 1.2% (575) | 0.8% (223) | 1.5% (352) |
| Building material and garden equipment and supplies dealers | 1.1% (628) | 1.2% (356) | 0.9% (272) | 0.6% (294) | 0.8% (207) | 0.4% (87) |
| Other transportation, and support activities, and couriers | 1.1% (624) | 1.7% (504) | 0.4% (120) | 1.3% (654) | 1.7% (454) | 0.9% (200) |
| Broadcasting and telecommunications | 1.0% (596) | 1.6% (493) | 0.4% (103) | 1.2% (610) | 1.7% (438) | 0.7% (172) |
| Chemicals | 1.0% (564) | 1.1% (320) | 0.8% (244) | 0.7% (327) | 0.8% (219) | 0.5% (108) |
| Radio, TV, and computer stores | 0.9% (550) | 1.6% (472) | 0.3% (78) | 0.7% (329) | 0.9% (245) | 0.4% (84) |
| Private households | 0.9% (542) | 0.1% (45) | 1.7% (497) | 0.5% (256) | 0.1% (26) | 1.0% (230) |
| Used merchandise, gift, novelty, and souvenir, and other miscellaneous stores | 0.9% (537) | 1.0% (297) | 0.8% (240) | 0.9% (427) | 0.7% (178) | 1.1% (249) |
| Motor vehicle and parts dealers | 0.9% (515) | 1.4% (418) | 0.3% (97) | 1.3% (640) | 2.1% (553) | 0.4% (87) |
| Transportation equipment | 0.8% (486) | 1.1% (327) | 0.5% (159) | 1.0% (511) | 1.5% (389) | 0.5% (122) |
| Metal and metal products | 0.8% (482) | 1.1% (343) | 0.5% (139) | 1.1% (557) | 1.4% (372) | 0.8% (185) |
| Groceries and related products merchant wholesalers | 0.7% (431) | 0.8% (240) | 0.7% (191) | 0.8% (385) | 1.2% (310) | 0.3% (75) |
| Repair and maintenance | 0.7% (423) | 1.1% (342) | 0.3% (81) | 1.6% (773) | 2.4% (644) | 0.6% (129) |
| Truck transportation | 0.7% (421) | 1.4% (421) | 0.0% (0) | 1.0% (489) | 1.5% (389) | 0.4% (100) |
| Machinery | 0.6% (377) | 0.8% (249) | 0.4% (128) | 0.7% (360) | 1.0% (276) | 0.4% (84) |
| Mining, quarrying, and oil and gas extraction | 0.6% (346) | 1.0% (292) | 0.2% (54) | 0.9% (446) | 1.5% (385) | 0.3% (61) |
| Sporting goods, camera, and hobby and toy stores | 0.5% (293) | 0.8% (256) | 0.1% (37) | 0.3% (149) | 0.3% (74) | 0.3% (75) |
| Other direct selling establishments | 0.5% (279) | 0.4% (136) | 0.5% (143) | 0.4% (190) | 0.2% (66) | 0.5% (124) |
| Gasoline stations | 0.5% (279) | 0.7% (204) | 0.3% (75) | 0.3% (151) | 0.4% (100) | 0.2% (51) |
| Pharmacies and drug stores | 0.5% (276) | 0.4% (121) | 0.5% (155) | 0.5% (247) | 0.4% (109) | 0.6% (138) |
| Professional and commercial equipment and supplies merchant wholesalers | 0.5% (275) | 0.2% (66) | 0.7% (209) | 0.4% (202) | 0.6% (153) | 0.2% (49) |
| Miscellaneous nondurable goods merchant wholesalers | 0.5% (275) | 0.4% (120) | 0.5% (155) | 0.4% (213) | 0.5% (121) | 0.4% (92) |
| Electronic shopping and mail-order houses | 0.4% (249) | 0.4% (117) | 0.5% (132) | 0.3% (146) | 0.3% (79) | 0.3% (67) |
| Printing and related support activities | 0.4% (229) | 0.3% (86) | 0.5% (143) | 0.8% (419) | 0.7% (189) | 1.0% (230) |
| U. S. Postal service | 0.4% (216) | 0.4% (121) | 0.3% (95) | 0.6% (286) | 0.9% (238) | 0.2% (48) |
| Apparel | 0.3% (204) | 0.1% (18) | 0.6% (186) | 0.4% (223) | 0.2% (57) | 0.7% (166) |
| Food | 0.3% (201) | 0.5% (158) | 0.1% (43) | 0.5% (235) | 0.4% (111) | 0.5% (124) |
| Data processing, libraries, and other information services | 0.3% (200) | 0.2% (71) | 0.4% (129) | 0.5% (244) | 0.4% (108) | 0.6% (136) |
| Electrical equipment, appliances, and components | 0.3% (161) | 0.3% (92) | 0.2% (69) | 0.2% (123) | 0.3% (78) | 0.2% (45) |
| Book stores and news dealers | 0.3% (154) | 0.4% (112) | 0.1% (42) | 0.2% (102) | 0.1% (32) | 0.3% (70) |
| Drugs, sundries, and chemical and allied products merchant wholesalers | 0.2% (148) | 0.3% (80) | 0.2% (68) | 0.1% (60) | 0.0% (11) | 0.2% (49) |
| Machinery, equipment, and supplies merchant wholesalers | 0.2% (135) | 0.2% (67) | 0.2% (68) | 0.4% (198) | 0.7% (173) | 0.1% (25) |
| Nonmetallic mineral products | 0.2% (117) | 0.3% (96) | 0.1% (21) | 0.2% (90) | 0.3% (69) | 0.1% (21) |
| Hardware, plumbing and heating equipment, and supplies merchant wholesalers | 0.2% (113) | 0.3% (83) | 0.1% (30) | 0.1% (66) | 0.2% (63) | 0.0% (3) |
| Plastics and rubber products | 0.2% (99) | 0.1% (21) | 0.3% (78) | 0.3% (141) | 0.4% (93) | 0.2% (48) |
| Jewelry, luggage, and leather goods stores | 0.2% (99) | 0.2% (53) | 0.2% (46) | 0.3% (137) | 0.2% (51) | 0.4% (86) |
| Furniture and home furnishings, and household appliance stores | 0.2% (90) | 0.1% (34) | 0.2% (56) | 0.6% (313) | 0.6% (156) | 0.7% (157) |
| Beverage and tobacco products | 0.1% (88) | 0.0% (0) | 0.3% (88) | 0.1% (50) | 0.2% (43) | 0.0% (7) |
| Paper | 0.1% (86) | 0.3% (86) | 0.0% (0) | 0.4% (175) | 0.5% (145) | 0.1% (30) |
| Alcoholic beverages merchant wholesalers | 0.1% (73) | 0.2% (73) | 0.0% (0) | 0.2% (87) | 0.3% (82) | 0.0% (5) |
| Electrical and electronic goods merchant wholesalers | 0.1% (73) | 0.2% (60) | 0.0% (13) | 0.4% (189) | 0.4% (107) | 0.4% (82) |
| Music stores | 0.1% (64) | 0.2% (47) | 0.1% (17) | 0.1% (43) | 0.2% (43) | 0.0% (0) |
| Motor vehicles, parts and supplies merchant wholesalers | 0.1% (61) | 0.1% (30) | 0.1% (31) | 0.1% (53) | 0.2% (47) | 0.0% (6) |
| Office supplies and stationery stores | 0.1% (55) | 0.2% (55) | 0.0% (0) | 0.1% (65) | 0.1% (39) | 0.1% (26) |
| Metals and minerals, except petroleum, merchant wholesalers | 0.1% (53) | 0.2% (53) | 0.0% (0) | 0.1% (35) | 0.1% (30) | 0.0% (5) |
| Lumber and other construction materials merchant wholesalers | 0.1% (48) | 0.0% (14) | 0.1% (34) | 0.1% (27) | 0.1% (27) | 0.0% (0) |
| Air transportation | 0.1% (43) | 0.1% (43) | 0.0% (0) | 0.2% (93) | 0.2% (47) | 0.2% (46) |
| Health and personal care, except drug, stores | 0.0% (29) | 0.1% (29) | 0.0% (0) | 0.2% (116) | 0.0% (5) | 0.5% (111) |
| Furniture and related product manufacturing | 0.0% (26) | 0.1% (26) | 0.0% (0) | 0.3% (131) | 0.4% (94) | 0.2% (37) |
| Warehousing and storage | 0.0% (19) | 0.0% (0) | 0.1% (19) | 0.1% (43) | 0.1% (34) | 0.0% (9) |
| Miscellaneous durable goods merchant wholesalers | 0.0% (13) | 0.0% (13) | 0.0% (0) | 0.2% (90) | 0.2% (52) | 0.2% (38) |
| Farm supplies merchant wholesalers | 0.0% (0) | 0.0% (0) | 0.0% (0) | 0.2% (97) | 0.1% (34) | 0.3% (63) |
| Recyclable material merchant wholesalers | 0.0% (0) | 0.0% (0) | 0.0% (0) | 0.1% (56) | 0.1% (36) | 0.1% (20) |
| Retail florists | 0.0% (0) | 0.0% (0) | 0.0% (0) | 0.2% (75) | 0.2% (54) | 0.1% (21) |
Unemployment in San Buenaventura (Ventura)
- Unemployment by race in 2022
- Unemployment rate for White non-Hispanic residents
- 2.5%Males
- 2.2%Females
- Unemployment rate for Black residents
- 5.7%Males
- 12.1%Females
- Unemployment rate for American Indian and Alaska Native residents
- 2.2%Females
- Unemployment rate for Asian residents
- 1.5%Males
- 6.4%Females
- Unemployment rate for other race residents
- 1.0%Males
- 7.9%Females
- Unemployment rate for two or more race residents
- 4.7%Males
- 2.8%Females
- Unemployment rate for Hispanic or Latino residents
- 1.4%Males
- 0.9%Females
- Unemployment by race in 2000
- Unemployment rate for White non-Hispanic residents
- 5.4%Males
- 3.6%Females
- Unemployment rate for Black residents
- 11.1%Males
- 6.3%Females
- Unemployment rate for American Indian and Alaska Native residents
- 2.2%Females
- Unemployment rate for Asian residents
- 4.1%Males
- 4.3%Females
- Unemployment rate for other race residents
- 6.0%Males
- 7.4%Females
- Unemployment rate for two or more race residents
- 5.8%Males
- 5.8%Females
- Unemployment rate for Hispanic or Latino residents
- 5.8%Males
- 7.1%Females
Unemployment in 2023:
| San Buenaventura (Ventura): | 4.1% |
| California: | 5.1% |
Unemployment in 2022:
| San Buenaventura (Ventura): | 3.3% |
| California: | 4.2% |
Unemployment in 2021:
| San Buenaventura (Ventura): | 5.9% |
| California: | 7.3% |
Unemployment in 2020:
| San Buenaventura (Ventura): | 8.8% |
| California: | 10.1% |
Unemployment in 2019:
| San Buenaventura (Ventura): | 3.1% |
| California: | 4.1% |
Unemployment in 2018:
| San Buenaventura (Ventura): | 3.3% |
| California: | 4.2% |
Unemployment in 2017:
| San Buenaventura (Ventura): | 3.9% |
| California: | 4.8% |
Unemployment in 2016:
| San Buenaventura (Ventura): | 4.6% |
| California: | 5.5% |
Unemployment in 2015:
| San Buenaventura (Ventura): | 5.8% |
| California: | 6.3% |
Unemployment in 2014:
| San Buenaventura (Ventura): | 6.8% |
| California: | 7.6% |
Unemployment in 2013:
| San Buenaventura (Ventura): | 8.1% |
| California: | 9.0% |
Unemployment in 2012:
| San Buenaventura (Ventura): | 9.4% |
| California: | 10.5% |
Unemployment in 2011:
| San Buenaventura (Ventura): | 10.6% |
| California: | 11.9% |
Unemployment in 2010:
| San Buenaventura (Ventura): | 11.2% |
| California: | 12.5% |
Unemployment in 2009:
| San Buenaventura (Ventura): | 9.1% |
| California: | 11.5% |
Unemployment in 2008:
| San Buenaventura (Ventura): | 5.7% |
| California: | 7.3% |
Unemployment in 2007:
| San Buenaventura (Ventura): | 4.3% |
| California: | 5.3% |
Unemployment in 2006:
| San Buenaventura (Ventura): | 3.9% |
| California: | 4.9% |
Unemployment in 2005:
| San Buenaventura (Ventura): | 4.3% |
| California: | 5.4% |
Unemployment in 2004:
| San Buenaventura (Ventura): | 4.8% |
| California: | 6.2% |
Unemployment in 2003:
| San Buenaventura (Ventura): | 5.3% |
| California: | 6.9% |
Unemployment in 2002:
| San Buenaventura (Ventura): | 5.2% |
| California: | 6.8% |
Unemployment in 2001:
| San Buenaventura (Ventura): | 4.4% |
| California: | 5.5% |
Unemployment in 2000:
| San Buenaventura (Ventura): | 4.0% |
| California: | 4.9% |
Unemployment in 1999:
| San Buenaventura (Ventura): | 3.8% |
| California: | 5.3% |
Unemployment in 1998:
| San Buenaventura (Ventura): | 4.4% |
| California: | 5.9% |
Unemployment in 1997:
| San Buenaventura (Ventura): | 5.2% |
| California: | 6.4% |
Unemployment in 1996:
| San Buenaventura (Ventura): | 5.8% |
| California: | 7.3% |
Unemployment in 1995:
| San Buenaventura (Ventura): | 5.8% |
| California: | 7.9% |
Unemployment in 1994:
| San Buenaventura (Ventura): | 6.3% |
| California: | 8.7% |
Unemployment in 1993:
| San Buenaventura (Ventura): | 7.2% |
| California: | 9.5% |
Unemployment in 1992:
| San Buenaventura (Ventura): | 7.1% |
| California: | 9.4% |
Unemployment in 1991:
| San Buenaventura (Ventura): | 6.0% |
| California: | 7.8% |
Unemployment in 1990:
| San Buenaventura (Ventura): | 4.5% |
| California: | 5.8% |
Time leaving home to go to work

12:00 a.m. to 4:59 a.m.:
| San Buenaventura (Ventura): | 6.3% (3,054) |
| California: | 6.8% (1,050,902) |
5:00 a.m. to 5:29 a.m.:
| San Buenaventura (Ventura): | 2.4% (1,187) |
| California: | 4.5% (692,772) |
5:30 a.m. to 5:59 a.m.:
| San Buenaventura (Ventura): | 4.8% (2,311) |
| California: | 4.3% (665,475) |
6:00 a.m. to 6:29 a.m.:
| San Buenaventura (Ventura): | 6.0% (2,930) |
| California: | 8.3% (1,273,588) |
6:30 a.m. to 6:59 a.m.:
| San Buenaventura (Ventura): | 10.8% (5,255) |
| California: | 7.5% (1,156,338) |
7:00 a.m. to 7:29 a.m.:
| San Buenaventura (Ventura): | 11.6% (5,613) |
| California: | 13.2% (2,027,702) |
7:30 a.m. to 7:59 a.m.:
| San Buenaventura (Ventura): | 12.9% (6,245) |
| California: | 10.1% (1,550,402) |
8:00 a.m. to 8:29 a.m.:
| San Buenaventura (Ventura): | 13.7% (6,658) |
| California: | 12.7% (1,953,986) |
8:30 a.m. to 8:59 a.m.:
| San Buenaventura (Ventura): | 5.9% (2,860) |
| California: | 5.8% (890,950) |
9:00 a.m. to 9:59 a.m.:
| San Buenaventura (Ventura): | 9.0% (4,371) |
| California: | 8.4% (1,288,499) |
10:00 a.m. to 10:59 a.m.:
| San Buenaventura (Ventura): | 2.8% (1,373) |
| California: | 4.0% (613,193) |
11:00 a.m. to 11:59 a.m.:
| San Buenaventura (Ventura): | 1.7% (822) |
| California: | 1.8% (280,975) |
12:00 p.m. to 3:59 p.m.:
| San Buenaventura (Ventura): | 8.4% (4,051) |
| California: | 7.0% (1,075,505) |
4:00 p.m. to 11:59 p.m.:
| San Buenaventura (Ventura): | 3.6% (1,770) |
| California: | 5.8% (891,240) |

<5am:
| San Buenaventura (Ventura): | 3.3% (1,624) |
| California: | 4.2% (606,086) |
5:30am:
| San Buenaventura (Ventura): | 2.4% (1,197) |
| California: | 3.6% (523,209) |
6am:
| San Buenaventura (Ventura): | 3.8% (1,861) |
| California: | 4.8% (692,256) |
6:30am:
| San Buenaventura (Ventura): | 7.0% (3,434) |
| California: | 8.4% (1,216,867) |
7am:
| San Buenaventura (Ventura): | 10.3% (5,019) |
| California: | 9.4% (1,362,830) |
7:30am:
| San Buenaventura (Ventura): | 15.2% (7,435) |
| California: | 13.8% (2,006,950) |
8am:
| San Buenaventura (Ventura): | 18.2% (8,886) |
| California: | 13.7% (1,986,831) |
8:30am:
| San Buenaventura (Ventura): | 10.9% (5,305) |
| California: | 10.9% (1,577,815) |
9am:
| San Buenaventura (Ventura): | 5.5% (2,668) |
| California: | 5.4% (778,152) |
10am:
| San Buenaventura (Ventura): | 6.4% (3,109) |
| California: | 6.7% (972,355) |
11am:
| San Buenaventura (Ventura): | 2.8% (1,351) |
| California: | 2.9% (414,479) |
12pm:
| San Buenaventura (Ventura): | 1.1% (557) |
| California: | 1.3% (189,005) |
4pm:
| San Buenaventura (Ventura): | 4.4% (2,135) |
| California: | 6.0% (865,284) |
>4pm:
| San Buenaventura (Ventura): | 4.6% (2,266) |
| California: | 5.3% (776,167) |

12:00 a.m. to 4:59 a.m. - Males:
| San Buenaventura (Ventura): | 8.3% (2,298) |
| California: | 8.7% (747,612) |
5:00 a.m. to 5:29 a.m. - Males:
| San Buenaventura (Ventura): | 3.0% (824) |
| California: | 6.0% (509,420) |
5:30 a.m. to 5:59 a.m. - Males:
| San Buenaventura (Ventura): | 6.6% (1,826) |
| California: | 5.2% (448,269) |
6:00 a.m. to 6:29 a.m. - Males:
| San Buenaventura (Ventura): | 7.1% (1,991) |
| California: | 9.8% (842,941) |
6:30 a.m. to 6:59 a.m. - Males:
| San Buenaventura (Ventura): | 11.4% (3,164) |
| California: | 7.7% (657,557) |
7:00 a.m. to 7:29 a.m. - Males:
| San Buenaventura (Ventura): | 10.6% (2,948) |
| California: | 12.4% (1,058,532) |
7:30 a.m. to 7:59 a.m. - Males:
| San Buenaventura (Ventura): | 12.4% (3,441) |
| California: | 8.2% (702,727) |
8:00 a.m. to 8:29 a.m. - Males:
| San Buenaventura (Ventura): | 12.5% (3,481) |
| California: | 11.5% (984,538) |
8:30 a.m. to 8:59 a.m. - Males:
| San Buenaventura (Ventura): | 4.7% (1,313) |
| California: | 4.8% (414,815) |
9:00 a.m. to 9:59 a.m. - Males:
| San Buenaventura (Ventura): | 6.4% (1,791) |
| California: | 7.7% (655,038) |
10:00 a.m. to 10:59 a.m. - Males:
| San Buenaventura (Ventura): | 2.7% (739) |
| California: | 3.5% (301,425) |
11:00 a.m. to 11:59 a.m. - Males:
| San Buenaventura (Ventura): | 2.4% (662) |
| California: | 1.7% (141,620) |
12:00 p.m. to 3:59 p.m. - Males:
| San Buenaventura (Ventura): | 8.0% (2,215) |
| California: | 7.0% (594,847) |
4:00 p.m. to 11:59 p.m. - Males:
| San Buenaventura (Ventura): | 4.1% (1,154) |
| California: | 5.8% (499,471) |

12:00 a.m. to 4:59 a.m. - Females:
| San Buenaventura (Ventura): | 3.7% (756) |
| California: | 4.4% (303,290) |
5:00 a.m. to 5:29 a.m. - Females:
| San Buenaventura (Ventura): | 1.8% (363) |
| California: | 2.7% (183,352) |
5:30 a.m. to 5:59 a.m. - Females:
| San Buenaventura (Ventura): | 2.3% (485) |
| California: | 3.2% (217,206) |
6:00 a.m. to 6:29 a.m. - Females:
| San Buenaventura (Ventura): | 4.5% (939) |
| California: | 6.3% (430,647) |
6:30 a.m. to 6:59 a.m. - Females:
| San Buenaventura (Ventura): | 10.1% (2,091) |
| California: | 7.3% (498,781) |
7:00 a.m. to 7:29 a.m. - Females:
| San Buenaventura (Ventura): | 12.9% (2,665) |
| California: | 14.1% (969,170) |
7:30 a.m. to 7:59 a.m. - Females:
| San Buenaventura (Ventura): | 13.6% (2,804) |
| California: | 12.4% (847,675) |
8:00 a.m. to 8:29 a.m. - Females:
| San Buenaventura (Ventura): | 15.4% (3,177) |
| California: | 14.1% (969,448) |
8:30 a.m. to 8:59 a.m. - Females:
| San Buenaventura (Ventura): | 7.5% (1,547) |
| California: | 6.9% (476,135) |
9:00 a.m. to 9:59 a.m. - Females:
| San Buenaventura (Ventura): | 12.5% (2,580) |
| California: | 9.2% (633,461) |
10:00 a.m. to 10:59 a.m. - Females:
| San Buenaventura (Ventura): | 3.1% (634) |
| California: | 4.5% (311,768) |
11:00 a.m. to 11:59 a.m. - Females:
| San Buenaventura (Ventura): | 0.8% (160) |
| California: | 2.0% (139,355) |
12:00 p.m. to 3:59 p.m. - Females:
| San Buenaventura (Ventura): | 8.9% (1,836) |
| California: | 7.0% (480,658) |
4:00 p.m. to 11:59 p.m. - Females:
| San Buenaventura (Ventura): | 3.0% (616) |
| California: | 5.7% (391,769) |
Travel time to work
Percentage of workers working in this county: 84.7%
Number of people working at home: 8,494 (14.9% of all workers)
Daytime population change due to commuting: +5,250 (+5.2%)
Workers who live and work in this city: 24,290 (49.7%)
Number of people working at home: 8,494 (14.9% of all workers)
Daytime population change due to commuting: +5,250 (+5.2%)
Workers who live and work in this city: 24,290 (49.7%)

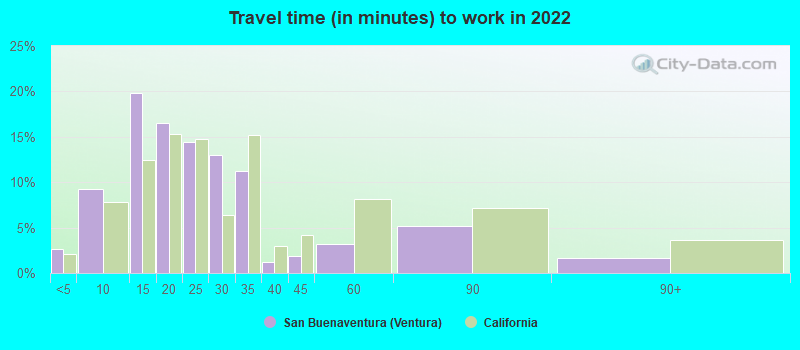

Less than 5 minutes:
| San Buenaventura (Ventura): | 2.6% (1,462) |
| California: | 2.1% (323,064) |
5 to 9 minutes:
| San Buenaventura (Ventura): | 9.3% (5,159) |
| California: | 7.8% (1,208,682) |
10 to 14 minutes:
| San Buenaventura (Ventura): | 19.8% (11,003) |
| California: | 12.4% (1,917,610) |
15 to 19 minutes:
| San Buenaventura (Ventura): | 16.5% (9,152) |
| California: | 15.3% (2,367,483) |
20 to 24 minutes:
| San Buenaventura (Ventura): | 14.4% (8,016) |
| California: | 14.8% (2,279,693) |
25 to 29 minutes:
| San Buenaventura (Ventura): | 13.0% (7,198) |
| California: | 6.4% (981,997) |
30 to 34 minutes:
| San Buenaventura (Ventura): | 11.3% (6,253) |
| California: | 15.2% (2,339,223) |
35 to 39 minutes:
| San Buenaventura (Ventura): | 1.2% (676) |
| California: | 2.9% (453,226) |
40 to 44 minutes:
| San Buenaventura (Ventura): | 1.9% (1,029) |
| California: | 4.1% (637,781) |
45 to 59 minutes:
| San Buenaventura (Ventura): | 3.2% (1,795) |
| California: | 8.2% (1,259,482) |
60 to 89 minutes:
| San Buenaventura (Ventura): | 5.2% (2,874) |
| California: | 7.2% (1,111,698) |
90 or more minutes:
| San Buenaventura (Ventura): | 1.7% (944) |
| California: | 3.6% (552,805) |


Less than 5 minutes:
| San Buenaventura (Ventura): | 2.5% (1,242) |
| California: | 2.2% (324,703) |
5 to 9 minutes:
| San Buenaventura (Ventura): | 13.2% (6,440) |
| California: | 8.8% (1,280,443) |
10 to 14 minutes:
| San Buenaventura (Ventura): | 19.9% (9,725) |
| California: | 13.3% (1,930,263) |
15 to 19 minutes:
| San Buenaventura (Ventura): | 17.6% (8,609) |
| California: | 14.9% (2,157,970) |
20 to 24 minutes:
| San Buenaventura (Ventura): | 13.4% (6,569) |
| California: | 13.8% (2,004,060) |
25 to 29 minutes:
| San Buenaventura (Ventura): | 4.5% (2,209) |
| California: | 5.4% (782,241) |
30 to 34 minutes:
| San Buenaventura (Ventura): | 9.9% (4,848) |
| California: | 13.9% (2,025,657) |
35 to 39 minutes:
| San Buenaventura (Ventura): | 1.7% (828) |
| California: | 2.5% (366,487) |
40 to 44 minutes:
| San Buenaventura (Ventura): | 2.7% (1,324) |
| California: | 3.6% (528,043) |
45 to 59 minutes:
| San Buenaventura (Ventura): | 4.5% (2,200) |
| California: | 7.9% (1,151,598) |
60 to 89 minutes:
| San Buenaventura (Ventura): | 3.4% (1,662) |
| California: | 6.4% (933,123) |
90 or more minutes:
| San Buenaventura (Ventura): | 2.4% (1,191) |
| California: | 3.3% (483,698) |

Less than 5 minutes - Males:
| San Buenaventura (Ventura): | 3.4% (974) |
| California: | 2.0% (173,603) |
5 to 9 minutes - Males:
| San Buenaventura (Ventura): | 8.5% (2,439) |
| California: | 6.8% (580,822) |
10 to 14 minutes - Males:
| San Buenaventura (Ventura): | 18.6% (5,379) |
| California: | 11.4% (974,497) |
15 to 19 minutes - Males:
| San Buenaventura (Ventura): | 14.8% (4,271) |
| California: | 14.5% (1,239,386) |
20 to 24 minutes - Males:
| San Buenaventura (Ventura): | 14.7% (4,240) |
| California: | 14.3% (1,223,429) |
25 to 29 minutes - Males:
| San Buenaventura (Ventura): | 13.6% (3,930) |
| California: | 6.4% (545,844) |
30 to 34 minutes - Males:
| San Buenaventura (Ventura): | 10.2% (2,941) |
| California: | 15.8% (1,352,210) |
35 to 39 minutes - Males:
| San Buenaventura (Ventura): | 0.9% (262) |
| California: | 3.0% (253,732) |
40 to 44 minutes - Males:
| San Buenaventura (Ventura): | 2.0% (578) |
| California: | 4.4% (376,144) |
45 to 59 minutes - Males:
| San Buenaventura (Ventura): | 4.4% (1,270) |
| California: | 8.9% (762,659) |
60 to 89 minutes - Males:
| San Buenaventura (Ventura): | 5.8% (1,677) |
| California: | 8.3% (711,394) |
90 or more minutes - Males:
| San Buenaventura (Ventura): | 3.1% (889) |
| California: | 4.4% (378,954) |

Less than 5 minutes - Females:
| San Buenaventura (Ventura): | 1.8% (488) |
| California: | 2.2% (149,461) |
5 to 9 minutes - Females:
| San Buenaventura (Ventura): | 10.2% (2,720) |
| California: | 9.2% (627,860) |
10 to 14 minutes - Females:
| San Buenaventura (Ventura): | 21.1% (5,624) |
| California: | 13.7% (943,113) |
15 to 19 minutes - Females:
| San Buenaventura (Ventura): | 18.3% (4,881) |
| California: | 16.4% (1,128,097) |
20 to 24 minutes - Females:
| San Buenaventura (Ventura): | 14.1% (3,776) |
| California: | 15.4% (1,056,264) |
25 to 29 minutes - Females:
| San Buenaventura (Ventura): | 12.2% (3,268) |
| California: | 6.4% (436,153) |
30 to 34 minutes - Females:
| San Buenaventura (Ventura): | 12.4% (3,312) |
| California: | 14.4% (987,013) |
35 to 39 minutes - Females:
| San Buenaventura (Ventura): | 1.5% (414) |
| California: | 2.9% (199,494) |
40 to 44 minutes - Females:
| San Buenaventura (Ventura): | 1.7% (451) |
| California: | 3.8% (261,637) |
45 to 59 minutes - Females:
| San Buenaventura (Ventura): | 2.0% (525) |
| California: | 7.2% (496,823) |
60 to 89 minutes - Females:
| San Buenaventura (Ventura): | 4.5% (1,197) |
| California: | 5.8% (400,304) |
90 or more minutes - Females:
| San Buenaventura (Ventura): | 0.2% (55) |
| California: | 2.5% (173,851) |
Means of transportation to work
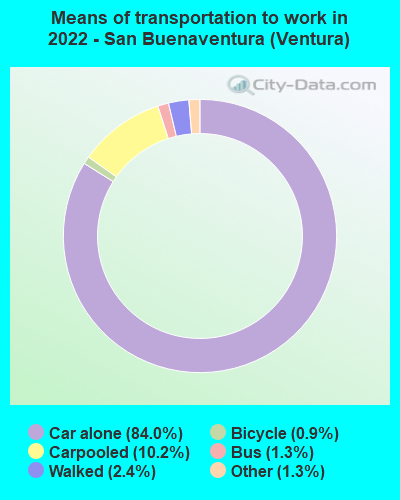

Drove car alone:
| San Buenaventura (Ventura): | 84.0% (46,679) |
| California: | 79.1% (5,345,368) |
Carpooled:
| San Buenaventura (Ventura): | 10.2% (5,643) |
| California: | 11.9% (878,699) |
Bus:
| San Buenaventura (Ventura): | 1.3% (702) |
| California: | 2.2% (170,574) |
Bicycle:
| San Buenaventura (Ventura): | 0.9% (478) |
| California: | 0.9% (39,197) |
Walked:
| San Buenaventura (Ventura): | 2.4% (1,343) |
| California: | 2.9% (218,374) |
Other means:
| San Buenaventura (Ventura): | 1.3% (716) |
| California: | 2.1% (137,489) |


Drove car alone:
| San Buenaventura (Ventura): | 79.2% (38,719) |
| California: | 71.8% (10,432,462) |
Carpooled:
| San Buenaventura (Ventura): | 11.2% (5,458) |
| California: | 14.5% (2,113,313) |
Bus or trolley bus:
| San Buenaventura (Ventura): | 1.3% (627) |
| California: | 3.8% (549,425) |
Railroad:
| San Buenaventura (Ventura): | 0.1% (54) |
| California: | 0.3% (41,022) |
Ferryboat:
| San Buenaventura (Ventura): | 0.0% (6) |
| California: | 0.0% (6,831) |
Taxicab:
| San Buenaventura (Ventura): | 0.0% (20) |
| California: | 0.1% (9,890) |
Motorcycle:
| San Buenaventura (Ventura): | 0.1% (63) |
| California: | 0.2% (36,262) |
Bicycle:
| San Buenaventura (Ventura): | 0.8% (413) |
| California: | 0.8% (120,567) |
Walked:
| San Buenaventura (Ventura): | 2.6% (1,254) |
| California: | 2.9% (414,581) |
Other means:
| San Buenaventura (Ventura): | 0.5% (233) |
| California: | 0.8% (115,064) |


Drove car alone - Males:
| San Buenaventura (Ventura): | 81.9% (23,614) |
| California: | 80.0% (5,345,368) |
Carpooled - Males:
| San Buenaventura (Ventura): | 11.1% (3,203) |
| California: | 11.1% (878,699) |
Bus - Males:
| San Buenaventura (Ventura): | 0.8% (233) |
| California: | 2.0% (170,574) |
Bicycle - Males:
| San Buenaventura (Ventura): | 0.9% (253) |
| California: | 1.1% (39,197) |
Walked - Males:
| San Buenaventura (Ventura): | 3.3% (943) |
| California: | 2.7% (218,374) |
Other means - Males:
| San Buenaventura (Ventura): | 2.1% (604) |
| California: | 2.1% (137,489) |


Drove car alone - Females:
| San Buenaventura (Ventura): | 86.4% (23,065) |
| California: | 77.9% (5,345,368) |
Carpooled - Females:
| San Buenaventura (Ventura): | 9.1% (2,440) |
| California: | 12.8% (878,699) |
Bus - Females:
| San Buenaventura (Ventura): | 1.8% (469) |
| California: | 2.5% (170,574) |
Bicycle - Females:
| San Buenaventura (Ventura): | 0.8% (225) |
| California: | 0.6% (39,197) |
Walked - Females:
| San Buenaventura (Ventura): | 1.5% (400) |
| California: | 3.2% (218,374) |
Other means - Females:
| San Buenaventura (Ventura): | 0.4% (112) |
| California: | 2.0% (137,489) |
Private vehicle occupancy

Drove alone:
| San Buenaventura (Ventura): | 89.1% (39,509) |
| California: | 86.9% (12,187,486) |
In 2 person carpool:
| San Buenaventura (Ventura): | 5.5% (2,440) |
| California: | 9.2% (1,295,561) |
In 3 person carpool:
| San Buenaventura (Ventura): | 3.0% (1,321) |
| California: | 2.2% (309,969) |
In 4 person carpool:
| San Buenaventura (Ventura): | 1.8% (798) |
| California: | 0.9% (126,987) |
In 5-6 person carpool:
| San Buenaventura (Ventura): | 0.1% (52) |
| California: | 0.5% (70,825) |
In 7+ person carpool:
| San Buenaventura (Ventura): | 0.5% (215) |
| California: | 0.2% (28,258) |

Drove alone:
| San Buenaventura (Ventura): | 87.6% (38,719) |
| California: | 83.2% (10,432,462) |
In 2 person carpool:
| San Buenaventura (Ventura): | 9.2% (4,067) |
| California: | 12.5% (1,564,905) |
In 3 person carpool:
| San Buenaventura (Ventura): | 2.0% (874) |
| California: | 2.6% (330,732) |
In 4 person carpool:
| San Buenaventura (Ventura): | 0.6% (278) |
| California: | 1.0% (119,364) |
In 5-6 person carpool:
| San Buenaventura (Ventura): | 0.4% (155) |
| California: | 0.5% (57,036) |
In 7+ person carpool:
| San Buenaventura (Ventura): | 0.2% (84) |
| California: | 0.3% (41,276) |
Class of workers

Employee of private company:
| San Buenaventura (Ventura): | 58.2% (33,847) |
| California: | 66.5% (12,596,030) |
Self-employed in own incorporated business:
| San Buenaventura (Ventura): | 3.6% (2,118) |
| California: | 4.1% (784,709) |
Private not-for-profit wage and salary workers:
| San Buenaventura (Ventura): | 10.3% (6,002) |
| California: | 7.5% (1,417,407) |
Local government workers:
| San Buenaventura (Ventura): | 12.9% (7,507) |
| California: | 8.2% (1,547,056) |
State government workers:
| San Buenaventura (Ventura): | 2.7% (1,552) |
| California: | 4.1% (780,915) |
Federal government workers:
| San Buenaventura (Ventura): | 3.5% (2,019) |
| California: | 2.0% (369,858) |
Self-employed workers in own not incorporated business:
| San Buenaventura (Ventura): | 8.6% (5,011) |
| California: | 7.4% (1,410,735) |
Unpaid family workers:
| San Buenaventura (Ventura): | 0.2% (116) |
| California: | 0.2% (36,267) |

Employee of private company:
| San Buenaventura (Ventura): | 62.4% (31,046) |
| California: | 68.0% (10,009,465) |
Self-employed in own incorporated business:
| San Buenaventura (Ventura): | 2.3% (1,167) |
| California: | 2.7% (402,392) |
Private not-for-profit wage and salary workers:
| San Buenaventura (Ventura): | 5.6% (2,775) |
| California: | 5.7% (845,536) |
Local government workers:
| San Buenaventura (Ventura): | 12.8% (6,374) |
| California: | 8.3% (1,218,764) |
State government workers:
| San Buenaventura (Ventura): | 3.3% (1,636) |
| California: | 4.0% (594,953) |
Federal government workers:
| San Buenaventura (Ventura): | 3.3% (1,634) |
| California: | 2.3% (344,354) |
Self-employed workers in own not incorporated business:
| San Buenaventura (Ventura): | 10.0% (4,978) |
| California: | 8.5% (1,249,530) |
Unpaid family workers:
| San Buenaventura (Ventura): | 0.4% (181) |
| California: | 0.4% (53,934) |

Employee of private company - Males:
| San Buenaventura (Ventura): | 60.9% (19,796) |
| California: | 70.3% (7,191,252) |
Self-employed in own incorporated business - Males:
| San Buenaventura (Ventura): | 5.1% (1,653) |
| California: | 4.9% (504,764) |
Private not-for-profit wage and salary workers - Males:
| San Buenaventura (Ventura): | 6.8% (2,201) |
| California: | 5.2% (529,122) |
Local government workers - Males:
| San Buenaventura (Ventura): | 11.2% (3,623) |
| California: | 6.0% (610,331) |
State government workers - Males:
| San Buenaventura (Ventura): | 2.3% (735) |
| California: | 3.4% (343,636) |
Federal government workers - Males:
| San Buenaventura (Ventura): | 5.0% (1,621) |
| California: | 2.1% (209,874) |
Self-employed workers in own not incorporated business - Males:
| San Buenaventura (Ventura): | 8.7% (2,811) |
| California: | 8.1% (824,359) |
Unpaid family workers - Males:
| San Buenaventura (Ventura): | 0.1% (45) |
| California: | 0.2% (17,922) |

Employee of private company - Females:
| San Buenaventura (Ventura): | 54.7% (14,051) |
| California: | 62.0% (5,404,778) |
Self-employed in own incorporated business - Females:
| San Buenaventura (Ventura): | 1.8% (465) |
| California: | 3.2% (279,945) |
Private not-for-profit wage and salary workers - Females:
| San Buenaventura (Ventura): | 14.8% (3,801) |
| California: | 10.2% (888,285) |
Local government workers - Females:
| San Buenaventura (Ventura): | 15.1% (3,884) |
| California: | 10.8% (936,725) |
State government workers - Females:
| San Buenaventura (Ventura): | 3.2% (817) |
| California: | 5.0% (437,279) |
Federal government workers - Females:
| San Buenaventura (Ventura): | 1.5% (398) |
| California: | 1.8% (159,984) |
Self-employed workers in own not incorporated business - Females:
| San Buenaventura (Ventura): | 8.6% (2,200) |
| California: | 6.7% (586,376) |
Unpaid family workers - Females:
| San Buenaventura (Ventura): | 0.3% (71) |
| California: | 0.2% (18,345) |