Work and Jobs in Selma, Alabama (AL) Detailed Stats
Occupations, Industries, Unemployment, Workers, Commute
Settings
X


Recent posts about work in Selma, Alabama on our local forum with over 2,400,000 registered users:
 | Selma? (16 replies) |
| Job in Selma, where to live. (1 reply) |
| UPDATED: New and Upcoming Projects. (3814 replies) |
| How would you solve the rural poverty? (193 replies) |
| Just got a job in Selma, looking for living options (0 replies) |
| Cool News (2590 replies) |
Latest news about work in Selma, AL collected exclusively by city-data.com from local newspapers, TV, and radio stations
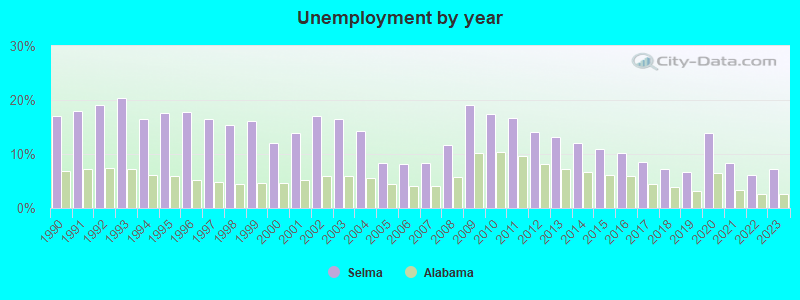
The unemployment rate in 2023 in Selma, AL was 7.2%, which was 63.9% greater than the unemployment rate of 2.6% across the entire state of Alabama. Compared to the unemployment rate of 13.2% in 2013, this represents a decrease of 83.3%. The most common industries in Selma are: Educational services (12.1% of civilian employees), Health care (12.0% of civilian employees), Public administration (8.1% of civilian employees). 75.3% of workers work in Dallas County and 4.4% of all workers work at home. 72.5% of workers are employees of private companies, which is 8.6% greater than the rate of 66.3% across the entire state of Alabama.
Whole page based on the data from 2000 / 2022 when the population of Selma, Alabama was 20,512 / 18,039
Whole page based on the data from 2000 / 2022 when the population of Selma, Alabama was 20,512 / 18,039
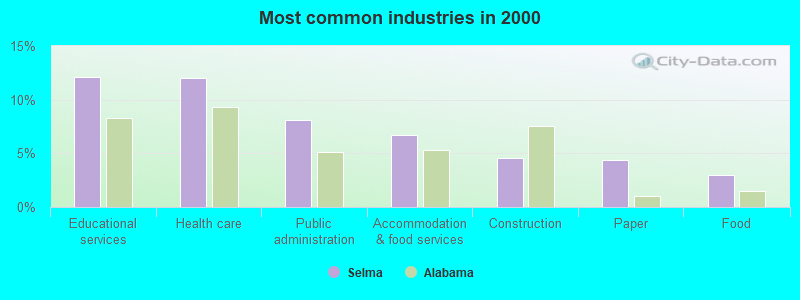
Most common industries
Most common industries | |||
|---|---|---|---|
Industry | All | Males | Females |
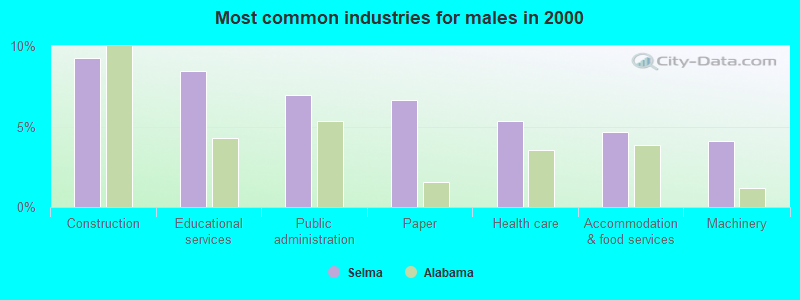
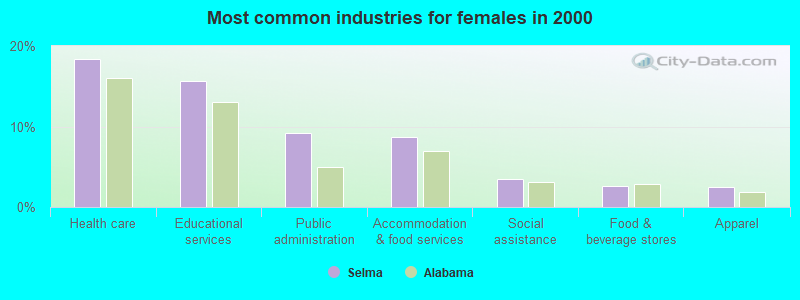
| Educational services | 12.1% (805) | 8.5% (275) | 15.6% (530) |
| Health care | 12.0% (798) | 5.4% (174) | 18.4% (624) |
| Public administration | 8.1% (539) | 7.0% (226) | 9.2% (313) |
| Accommodation and food services | 6.7% (444) | 4.6% (151) | 8.6% (293) |
| Construction | 4.6% (305) | 9.2% (300) | 0.1% (5) |
| Paper | 4.4% (289) | 6.7% (217) | 2.1% (72) |
| Food | 3.0% (200) | 3.7% (119) | 2.4% (81) |
| Religious, grantmaking, civic, professional, and similar organizations | 2.5% (163) | 2.4% (79) | 2.5% (84) |
| Machinery | 2.3% (154) | 4.1% (133) | 0.6% (21) |
| Food and beverage stores | 2.2% (145) | 1.7% (55) | 2.7% (90) |
| Department and other general merchandise stores | 2.0% (136) | 2.0% (65) | 2.1% (71) |
| Social assistance | 1.8% (119) | 0.0% (0) | 3.5% (119) |
| Repair and maintenance | 1.7% (115) | 3.3% (106) | 0.3% (9) |
| Finance and insurance | 1.7% (111) | 1.2% (39) | 2.1% (72) |
| Metal and metal products | 1.6% (103) | 2.3% (75) | 0.8% (28) |
| Administrative and support and waste management services | 1.5% (100) | 2.0% (66) | 1.0% (34) |
| Professional, scientific, and technical services | 1.5% (99) | 1.3% (41) | 1.7% (58) |
| Furniture and related product manufacturing | 1.4% (93) | 2.3% (75) | 0.5% (18) |
| Apparel | 1.4% (91) | 0.2% (5) | 2.5% (86) |
| Arts, entertainment, and recreation | 1.3% (87) | 2.2% (71) | 0.5% (16) |
| Private households | 1.3% (85) | 0.2% (6) | 2.3% (79) |
| Wood products | 1.3% (85) | 2.3% (75) | 0.3% (10) |
| Building material and garden equipment and supplies dealers | 1.3% (84) | 1.9% (61) | 0.7% (23) |
| Utilities | 1.2% (82) | 1.9% (61) | 0.6% (21) |
| Gasoline stations | 1.2% (79) | 0.0% (0) | 2.3% (79) |
| Personal and laundry services | 1.2% (77) | 0.7% (23) | 1.6% (54) |
| Truck transportation | 1.1% (76) | 1.5% (48) | 0.8% (28) |
| Motor vehicle and parts dealers | 1.1% (71) | 1.6% (51) | 0.6% (20) |
| Transportation equipment | 1.0% (68) | 1.5% (48) | 0.6% (20) |
| Textile mills and textile products | 0.9% (58) | 0.5% (17) | 1.2% (41) |
| Nonmetallic mineral products | 0.8% (56) | 1.5% (50) | 0.2% (6) |
| Agriculture, forestry, fishing and hunting | 0.8% (55) | 1.5% (49) | 0.2% (6) |
| Real estate and rental and leasing | 0.8% (53) | 0.9% (28) | 0.7% (25) |
| Rail transportation | 0.8% (50) | 1.5% (50) | 0.0% (0) |
| Clothing and accessories, including shoe, stores | 0.7% (46) | 0.3% (10) | 1.1% (36) |
| Used merchandise, gift, novelty, and souvenir, and other miscellaneous stores | 0.7% (45) | 0.3% (9) | 1.1% (36) |
| Chemicals | 0.6% (39) | 1.2% (39) | 0.0% (0) |
| Broadcasting and telecommunications | 0.6% (39) | 0.9% (30) | 0.3% (9) |
| Radio, TV, and computer stores | 0.6% (38) | 0.2% (8) | 0.9% (30) |
| Mining, quarrying, and oil and gas extraction | 0.5% (33) | 1.0% (33) | 0.0% (0) |
| Beverage and tobacco products | 0.5% (33) | 0.4% (12) | 0.6% (21) |
| Groceries and related products merchant wholesalers | 0.5% (33) | 1.0% (33) | 0.0% (0) |
| Other direct selling establishments | 0.5% (32) | 0.0% (0) | 0.9% (32) |
| Publishing, and motion picture and sound recording industries | 0.5% (30) | 0.2% (7) | 0.7% (23) |
| Jewelry, luggage, and leather goods stores | 0.4% (29) | 0.3% (11) | 0.5% (18) |
| Furniture and home furnishings, and household appliance stores | 0.4% (29) | 0.6% (21) | 0.2% (8) |
| Plastics and rubber products | 0.4% (27) | 0.3% (9) | 0.5% (18) |
| U. S. Postal service | 0.4% (27) | 0.4% (14) | 0.4% (13) |
| Computer and electronic products | 0.4% (26) | 0.3% (10) | 0.5% (16) |
| Other transportation, and support activities, and couriers | 0.4% (25) | 0.5% (16) | 0.3% (9) |
| Pharmacies and drug stores | 0.4% (25) | 0.5% (15) | 0.3% (10) |
| Printing and related support activities | 0.3% (23) | 0.3% (11) | 0.4% (12) |
| Data processing, libraries, and other information services | 0.3% (23) | 0.3% (9) | 0.4% (14) |
| Drugs, sundries, and chemical and allied products merchant wholesalers | 0.3% (20) | 0.6% (20) | 0.0% (0) |
| Lumber and other construction materials merchant wholesalers | 0.3% (18) | 0.1% (4) | 0.4% (14) |
| Miscellaneous nondurable goods merchant wholesalers | 0.2% (16) | 0.0% (0) | 0.5% (16) |
| Machinery, equipment, and supplies merchant wholesalers | 0.2% (14) | 0.4% (14) | 0.0% (0) |
| Health and personal care, except drug, stores | 0.2% (13) | 0.4% (13) | 0.0% (0) |
| Fuel dealers | 0.2% (11) | 0.3% (11) | 0.0% (0) |
| Alcoholic beverages merchant wholesalers | 0.2% (11) | 0.3% (11) | 0.0% (0) |
| Electrical equipment, appliances, and components | 0.1% (9) | 0.3% (9) | 0.0% (0) |
| Electronic shopping and mail-order houses | 0.1% (9) | 0.0% (0) | 0.3% (9) |
| Music stores | 0.1% (8) | 0.0% (0) | 0.2% (8) |
| Miscellaneous manufacturing | 0.1% (8) | 0.2% (8) | 0.0% (0) |
| Professional and commercial equipment and supplies merchant wholesalers | 0.1% (7) | 0.2% (7) | 0.0% (0) |
| Petroleum and petroleum products merchant wholesalers | 0.1% (7) | 0.2% (7) | 0.0% (0) |
| Sporting goods, camera, and hobby and toy stores | 0.1% (6) | 0.2% (6) | 0.0% (0) |
| Farm supplies merchant wholesalers | 0.1% (5) | 0.2% (5) | 0.0% (0) |
Unemployment in Selma
- Unemployment by race in 2022
- Unemployment rate for Black residents
- 9.4%Males
- 18.2%Females
- Unemployment rate for American Indian and Alaska Native residents
- 100.0%Females
- Unemployment rate for Hispanic or Latino residents
- 42.4%Males
- Unemployment by race in 2000
- Unemployment rate for White non-Hispanic residents
- 3.8%Males
- 5.3%Females
- Unemployment rate for Black residents
- 18.8%Males
- 15.0%Females
Unemployment in 2023:
| Selma: | 7.2% |
| Alabama: | 2.6% |
Unemployment in 2022:
| Selma: | 6.1% |
| Alabama: | 2.6% |
Unemployment in 2021:
| Selma: | 8.4% |
| Alabama: | 3.4% |
Unemployment in 2020:
| Selma: | 13.9% |
| Alabama: | 6.4% |
Unemployment in 2019:
| Selma: | 6.7% |
| Alabama: | 3.2% |
Unemployment in 2018:
| Selma: | 7.2% |
| Alabama: | 3.9% |
Unemployment in 2017:
| Selma: | 8.6% |
| Alabama: | 4.5% |
Unemployment in 2016:
| Selma: | 10.2% |
| Alabama: | 5.9% |
Unemployment in 2015:
| Selma: | 11.0% |
| Alabama: | 6.1% |
Unemployment in 2014:
| Selma: | 12.0% |
| Alabama: | 6.7% |
Unemployment in 2013:
| Selma: | 13.2% |
| Alabama: | 7.3% |
Unemployment in 2012:
| Selma: | 14.0% |
| Alabama: | 8.2% |
Unemployment in 2011:
| Selma: | 16.6% |
| Alabama: | 9.6% |
Unemployment in 2010:
| Selma: | 17.4% |
| Alabama: | 10.4% |
Unemployment in 2009:
| Selma: | 19.1% |
| Alabama: | 10.1% |
Unemployment in 2008:
| Selma: | 11.7% |
| Alabama: | 5.8% |
Unemployment in 2007:
| Selma: | 8.4% |
| Alabama: | 4.1% |
Unemployment in 2006:
| Selma: | 8.2% |
| Alabama: | 4.0% |
Unemployment in 2005:
| Selma: | 8.4% |
| Alabama: | 4.4% |
Unemployment in 2004:
| Selma: | 14.3% |
| Alabama: | 5.6% |
Unemployment in 2003:
| Selma: | 16.5% |
| Alabama: | 6.0% |
Unemployment in 2002:
| Selma: | 17.0% |
| Alabama: | 5.9% |
Unemployment in 2001:
| Selma: | 13.8% |
| Alabama: | 5.2% |
Unemployment in 2000:
| Selma: | 12.1% |
| Alabama: | 4.6% |
Unemployment in 1999:
| Selma: | 16.2% |
| Alabama: | 4.7% |
Unemployment in 1998:
| Selma: | 15.3% |
| Alabama: | 4.5% |
Unemployment in 1997:
| Selma: | 16.4% |
| Alabama: | 4.9% |
Unemployment in 1996:
| Selma: | 17.7% |
| Alabama: | 5.2% |
Unemployment in 1995:
| Selma: | 17.6% |
| Alabama: | 5.9% |
Unemployment in 1994:
| Selma: | 16.4% |
| Alabama: | 6.2% |
Unemployment in 1993:
| Selma: | 20.3% |
| Alabama: | 7.2% |
Unemployment in 1992:
| Selma: | 19.0% |
| Alabama: | 7.5% |
Unemployment in 1991:
| Selma: | 18.0% |
| Alabama: | 7.3% |
Unemployment in 1990:
| Selma: | 17.0% |
| Alabama: | 6.8% |
Time leaving home to go to work
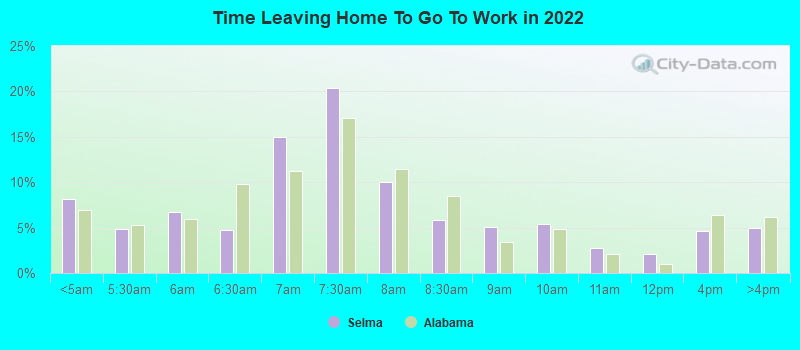
12:00 a.m. to 4:59 a.m.:
| Selma: | 8.1% (486) |
| Alabama: | 6.9% (142,387) |
5:00 a.m. to 5:29 a.m.:
| Selma: | 4.9% (291) |
| Alabama: | 5.2% (107,994) |
5:30 a.m. to 5:59 a.m.:
| Selma: | 6.7% (400) |
| Alabama: | 5.9% (122,369) |
6:00 a.m. to 6:29 a.m.:
| Selma: | 4.7% (281) |
| Alabama: | 9.8% (202,329) |
6:30 a.m. to 6:59 a.m.:
| Selma: | 15.0% (893) |
| Alabama: | 11.2% (230,301) |
7:00 a.m. to 7:29 a.m.:
| Selma: | 20.4% (1,217) |
| Alabama: | 17.1% (351,870) |
7:30 a.m. to 7:59 a.m.:
| Selma: | 10.1% (601) |
| Alabama: | 11.5% (236,564) |
8:00 a.m. to 8:29 a.m.:
| Selma: | 5.9% (350) |
| Alabama: | 8.5% (174,204) |
8:30 a.m. to 8:59 a.m.:
| Selma: | 5.1% (306) |
| Alabama: | 3.4% (70,689) |
9:00 a.m. to 9:59 a.m.:
| Selma: | 5.4% (320) |
| Alabama: | 4.8% (98,817) |
10:00 a.m. to 10:59 a.m.:
| Selma: | 2.8% (167) |
| Alabama: | 2.1% (43,562) |
11:00 a.m. to 11:59 a.m.:
| Selma: | 2.1% (124) |
| Alabama: | 1.0% (20,887) |
12:00 p.m. to 3:59 p.m.:
| Selma: | 4.6% (277) |
| Alabama: | 6.4% (131,127) |
4:00 p.m. to 11:59 p.m.:
| Selma: | 4.9% (294) |
| Alabama: | 6.1% (126,353) |

<5am:
| Selma: | 4.0% (257) |
| Alabama: | 4.2% (80,283) |
5:30am:
| Selma: | 2.7% (176) |
| Alabama: | 3.9% (73,270) |
6am:
| Selma: | 6.1% (394) |
| Alabama: | 5.8% (109,814) |
6:30am:
| Selma: | 7.6% (490) |
| Alabama: | 10.3% (195,070) |
7am:
| Selma: | 12.8% (827) |
| Alabama: | 12.7% (242,086) |
7:30am:
| Selma: | 16.6% (1,074) |
| Alabama: | 16.7% (317,590) |
8am:
| Selma: | 16.3% (1,051) |
| Alabama: | 15.7% (298,086) |
8:30am:
| Selma: | 8.3% (535) |
| Alabama: | 7.1% (135,165) |
9am:
| Selma: | 3.5% (228) |
| Alabama: | 2.9% (55,392) |
10am:
| Selma: | 5.4% (350) |
| Alabama: | 3.5% (67,166) |
11am:
| Selma: | 1.5% (97) |
| Alabama: | 1.5% (29,085) |
12pm:
| Selma: | 1.3% (83) |
| Alabama: | 0.7% (13,694) |
4pm:
| Selma: | 6.1% (391) |
| Alabama: | 6.3% (119,754) |
>4pm:
| Selma: | 6.8% (438) |
| Alabama: | 6.5% (124,331) |

12:00 a.m. to 4:59 a.m. - Males:
| Selma: | 9.7% (275) |
| Alabama: | 9.2% (100,860) |
5:00 a.m. to 5:29 a.m. - Males:
| Selma: | 9.5% (268) |
| Alabama: | 7.0% (76,240) |
5:30 a.m. to 5:59 a.m. - Males:
| Selma: | 4.7% (133) |
| Alabama: | 7.5% (82,102) |
6:00 a.m. to 6:29 a.m. - Males:
| Selma: | 5.1% (145) |
| Alabama: | 11.6% (127,090) |
6:30 a.m. to 6:59 a.m. - Males:
| Selma: | 12.9% (364) |
| Alabama: | 11.0% (120,602) |
7:00 a.m. to 7:29 a.m. - Males:
| Selma: | 18.8% (530) |
| Alabama: | 14.9% (163,229) |
7:30 a.m. to 7:59 a.m. - Males:
| Selma: | 7.6% (215) |
| Alabama: | 9.7% (106,349) |
8:00 a.m. to 8:29 a.m. - Males:
| Selma: | 3.8% (107) |
| Alabama: | 7.3% (79,880) |
8:30 a.m. to 8:59 a.m. - Males:
| Selma: | 3.5% (99) |
| Alabama: | 2.9% (31,618) |
9:00 a.m. to 9:59 a.m. - Males:
| Selma: | 4.0% (113) |
| Alabama: | 3.8% (41,927) |
10:00 a.m. to 10:59 a.m. - Males:
| Selma: | 4.4% (125) |
| Alabama: | 1.4% (15,146) |
11:00 a.m. to 11:59 a.m. - Males:
| Selma: | 4.4% (125) |
| Alabama: | 0.9% (9,376) |
12:00 p.m. to 3:59 p.m. - Males:
| Selma: | 4.1% (115) |
| Alabama: | 6.2% (67,527) |
4:00 p.m. to 11:59 p.m. - Males:
| Selma: | 7.7% (217) |
| Alabama: | 6.6% (72,202) |

12:00 a.m. to 4:59 a.m. - Females:
| Selma: | 6.7% (210) |
| Alabama: | 4.3% (41,527) |
5:00 a.m. to 5:29 a.m. - Females:
| Selma: | 0.6% (20) |
| Alabama: | 3.3% (31,754) |
5:30 a.m. to 5:59 a.m. - Females:
| Selma: | 8.7% (273) |
| Alabama: | 4.2% (40,267) |
6:00 a.m. to 6:29 a.m. - Females:
| Selma: | 4.3% (135) |
| Alabama: | 7.8% (75,239) |
6:30 a.m. to 6:59 a.m. - Females:
| Selma: | 16.8% (529) |
| Alabama: | 11.4% (109,699) |
7:00 a.m. to 7:29 a.m. - Females:
| Selma: | 21.9% (690) |
| Alabama: | 19.5% (188,641) |
7:30 a.m. to 7:59 a.m. - Females:
| Selma: | 12.2% (382) |
| Alabama: | 13.5% (130,215) |
8:00 a.m. to 8:29 a.m. - Females:
| Selma: | 7.8% (246) |
| Alabama: | 9.8% (94,324) |
8:30 a.m. to 8:59 a.m. - Females:
| Selma: | 6.5% (204) |
| Alabama: | 4.0% (39,071) |
9:00 a.m. to 9:59 a.m. - Females:
| Selma: | 6.6% (206) |
| Alabama: | 5.9% (56,890) |
10:00 a.m. to 10:59 a.m. - Females:
| Selma: | 0.8% (24) |
| Alabama: | 2.9% (28,416) |
12:00 p.m. to 3:59 p.m. - Females:
| Selma: | 5.1% (161) |
| Alabama: | 6.6% (63,600) |
4:00 p.m. to 11:59 p.m. - Females:
| Selma: | 2.6% (81) |
| Alabama: | 5.6% (54,151) |
Travel time to work
Percentage of workers working in this county: 75.3%
Number of people working at home: 279 (4.4% of all workers)
Daytime population change due to commuting: +4,660 (+22.7%)
Workers who live and work in this city: 4,580 (71.0%)
Number of people working at home: 279 (4.4% of all workers)
Daytime population change due to commuting: +4,660 (+22.7%)
Workers who live and work in this city: 4,580 (71.0%)

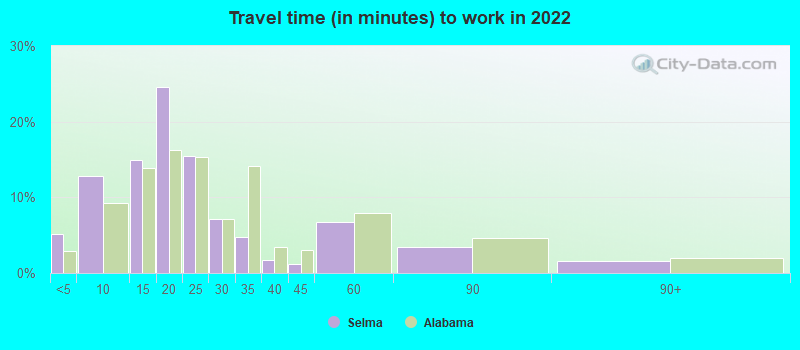

Less than 5 minutes:
| Selma: | 5.2% (416) |
| Alabama: | 2.9% (58,582) |
5 to 9 minutes:
| Selma: | 12.8% (1,034) |
| Alabama: | 9.3% (186,754) |
10 to 14 minutes:
| Selma: | 14.9% (1,207) |
| Alabama: | 13.9% (279,925) |
15 to 19 minutes:
| Selma: | 24.6% (1,990) |
| Alabama: | 16.3% (327,575) |
20 to 24 minutes:
| Selma: | 15.4% (1,248) |
| Alabama: | 15.4% (310,101) |
25 to 29 minutes:
| Selma: | 7.1% (574) |
| Alabama: | 7.1% (143,110) |
30 to 34 minutes:
| Selma: | 4.8% (384) |
| Alabama: | 14.1% (285,096) |
35 to 39 minutes:
| Selma: | 1.8% (143) |
| Alabama: | 3.5% (70,004) |
40 to 44 minutes:
| Selma: | 1.2% (95) |
| Alabama: | 3.1% (61,619) |
45 to 59 minutes:
| Selma: | 6.7% (541) |
| Alabama: | 7.9% (158,586) |
60 to 89 minutes:
| Selma: | 3.5% (279) |
| Alabama: | 4.6% (93,163) |
90 or more minutes:
| Selma: | 1.6% (129) |
| Alabama: | 2.0% (41,010) |


Less than 5 minutes:
| Selma: | 6.2% (403) |
| Alabama: | 3.1% (58,125) |
5 to 9 minutes:
| Selma: | 22.7% (1,464) |
| Alabama: | 10.3% (196,568) |
10 to 14 minutes:
| Selma: | 25.5% (1,647) |
| Alabama: | 15.0% (284,405) |
15 to 19 minutes:
| Selma: | 18.2% (1,173) |
| Alabama: | 17.0% (323,887) |
20 to 24 minutes:
| Selma: | 8.3% (538) |
| Alabama: | 15.0% (285,904) |
25 to 29 minutes:
| Selma: | 1.7% (107) |
| Alabama: | 5.8% (110,204) |
30 to 34 minutes:
| Selma: | 6.5% (422) |
| Alabama: | 13.7% (260,798) |
35 to 39 minutes:
| Selma: | 0.1% (8) |
| Alabama: | 2.5% (46,607) |
40 to 44 minutes:
| Selma: | 0.7% (47) |
| Alabama: | 2.6% (49,212) |
45 to 59 minutes:
| Selma: | 3.1% (197) |
| Alabama: | 6.7% (127,205) |
60 to 89 minutes:
| Selma: | 3.5% (223) |
| Alabama: | 3.7% (69,866) |
90 or more minutes:
| Selma: | 2.5% (162) |
| Alabama: | 2.5% (48,005) |

Less than 5 minutes - Males:
| Selma: | 4.8% (166) |
| Alabama: | 3.1% (32,846) |
5 to 9 minutes - Males:
| Selma: | 12.7% (441) |
| Alabama: | 8.1% (86,294) |
10 to 14 minutes - Males:
| Selma: | 11.3% (392) |
| Alabama: | 13.2% (140,867) |
15 to 19 minutes - Males:
| Selma: | 25.0% (869) |
| Alabama: | 15.0% (159,981) |
20 to 24 minutes - Males:
| Selma: | 12.3% (426) |
| Alabama: | 15.2% (162,214) |
25 to 29 minutes - Males:
| Selma: | 6.3% (219) |
| Alabama: | 6.9% (73,819) |
30 to 34 minutes - Males:
| Selma: | 6.9% (240) |
| Alabama: | 14.7% (156,884) |
35 to 39 minutes - Males:
| Selma: | 1.6% (55) |
| Alabama: | 3.5% (37,059) |
40 to 44 minutes - Males:
| Selma: | 0.8% (30) |
| Alabama: | 3.1% (33,614) |
45 to 59 minutes - Males:
| Selma: | 10.6% (370) |
| Alabama: | 9.0% (96,289) |
60 to 89 minutes - Males:
| Selma: | 4.0% (140) |
| Alabama: | 5.6% (59,809) |
90 or more minutes - Males:
| Selma: | 2.9% (102) |
| Alabama: | 2.8% (29,490) |

Less than 5 minutes - Females:
| Selma: | 5.2% (239) |
| Alabama: | 2.7% (25,736) |
5 to 9 minutes - Females:
| Selma: | 12.9% (594) |
| Alabama: | 10.6% (100,460) |
10 to 14 minutes - Females:
| Selma: | 17.4% (799) |
| Alabama: | 14.7% (139,058) |
15 to 19 minutes - Females:
| Selma: | 24.5% (1,128) |
| Alabama: | 17.7% (167,594) |
20 to 24 minutes - Females:
| Selma: | 17.9% (823) |
| Alabama: | 15.6% (147,887) |
25 to 29 minutes - Females:
| Selma: | 7.7% (357) |
| Alabama: | 7.3% (69,291) |
30 to 34 minutes - Females:
| Selma: | 3.1% (144) |
| Alabama: | 13.5% (128,212) |
35 to 39 minutes - Females:
| Selma: | 2.0% (91) |
| Alabama: | 3.5% (32,945) |
40 to 44 minutes - Females:
| Selma: | 1.4% (67) |
| Alabama: | 3.0% (28,005) |
45 to 59 minutes - Females:
| Selma: | 3.8% (175) |
| Alabama: | 6.6% (62,297) |
60 to 89 minutes - Females:
| Selma: | 3.0% (139) |
| Alabama: | 3.5% (33,354) |
90 or more minutes - Females:
| Selma: | 0.6% (28) |
| Alabama: | 1.2% (11,520) |
Means of transportation to work
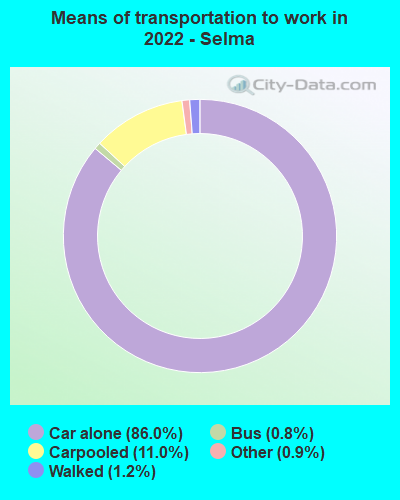
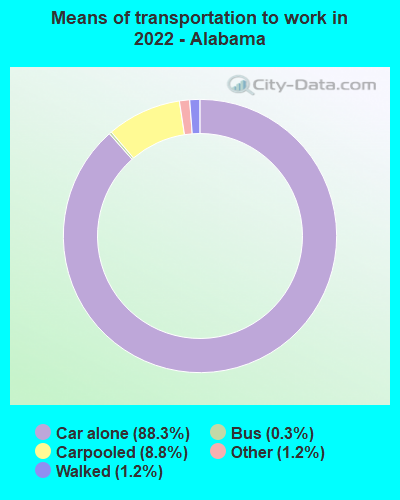
Drove car alone:
| Selma: | 86.0% (7,123) |
| Alabama: | 88.3% (835,794) |
Carpooled:
| Selma: | 11.0% (907) |
| Alabama: | 8.8% (86,879) |
Bus:
| Selma: | 0.8% (65) |
| Alabama: | 0.3% (2,902) |
Long-distance train or commuter rail:
| Selma: | 0.1% (8) |
| Alabama: | 0.0% (0) |
Walked:
| Selma: | 1.2% (103) |
| Alabama: | 1.2% (10,413) |
Other means:
| Selma: | 0.9% (74) |
| Alabama: | 1.2% (9,717) |

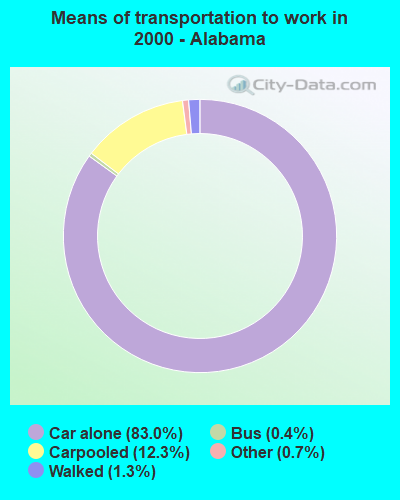
Drove car alone:
| Selma: | 80.7% (5,204) |
| Alabama: | 83.0% (1,576,882) |
Carpooled:
| Selma: | 14.2% (916) |
| Alabama: | 12.3% (234,020) |
Bus or trolley bus:
| Selma: | 0.4% (26) |
| Alabama: | 0.4% (7,358) |
Taxicab:
| Selma: | 0.9% (60) |
| Alabama: | 0.1% (1,389) |
Bicycle:
| Selma: | 0.1% (5) |
| Alabama: | 0.1% (1,414) |
Walked:
| Selma: | 1.5% (98) |
| Alabama: | 1.3% (25,360) |
Other means:
| Selma: | 1.3% (82) |
| Alabama: | 0.7% (12,430) |

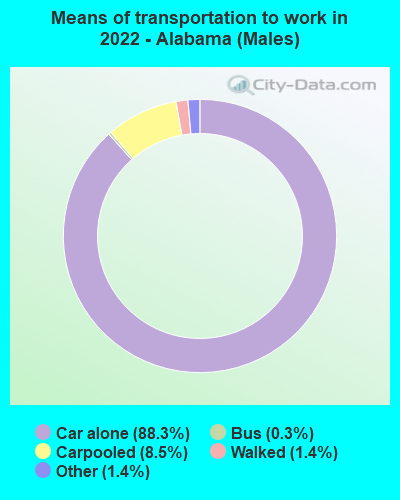
Drove car alone - Males:
| Selma: | 82.7% (2,933) |
| Alabama: | 88.3% (835,794) |
Carpooled - Males:
| Selma: | 12.4% (439) |
| Alabama: | 8.5% (86,879) |
Bus - Males:
| Selma: | 1.5% (51) |
| Alabama: | 0.3% (2,902) |
Long-distance train or commuter rail - Males:
| Selma: | 0.2% (8) |
| Alabama: | 0.0% (0) |
Walked - Males:
| Selma: | 2.1% (75) |
| Alabama: | 1.4% (10,413) |
Other means - Males:
| Selma: | 1.1% (38) |
| Alabama: | 1.4% (9,717) |


Drove car alone - Females:
| Selma: | 88.5% (4,198) |
| Alabama: | 88.3% (835,794) |
Carpooled - Females:
| Selma: | 9.9% (469) |
| Alabama: | 9.2% (86,879) |
Bus - Females:
| Selma: | 0.3% (14) |
| Alabama: | 0.3% (2,902) |
Walked - Females:
| Selma: | 0.6% (28) |
| Alabama: | 1.1% (10,413) |
Other means - Females:
| Selma: | 0.8% (36) |
| Alabama: | 1.0% (9,717) |
Private vehicle occupancy

Drove alone:
| Selma: | 91.1% (5,259) |
| Alabama: | 91.0% (1,820,084) |
In 2 person carpool:
| Selma: | 5.9% (340) |
| Alabama: | 6.9% (137,324) |
In 3 person carpool:
| Selma: | 2.3% (131) |
| Alabama: | 1.2% (24,905) |
In 5-6 person carpool:
| Selma: | 0.7% (42) |
| Alabama: | 0.2% (3,024) |

Drove alone:
| Selma: | 85.0% (5,204) |
| Alabama: | 87.1% (1,576,882) |
In 2 person carpool:
| Selma: | 12.0% (734) |
| Alabama: | 10.1% (182,201) |
In 3 person carpool:
| Selma: | 1.8% (113) |
| Alabama: | 1.9% (33,742) |
In 4 person carpool:
| Selma: | 0.6% (34) |
| Alabama: | 0.6% (10,909) |
In 5-6 person carpool:
| Selma: | 0.5% (28) |
| Alabama: | 0.3% (4,815) |
In 7+ person carpool:
| Selma: | 0.1% (7) |
| Alabama: | 0.1% (2,353) |
Class of workers
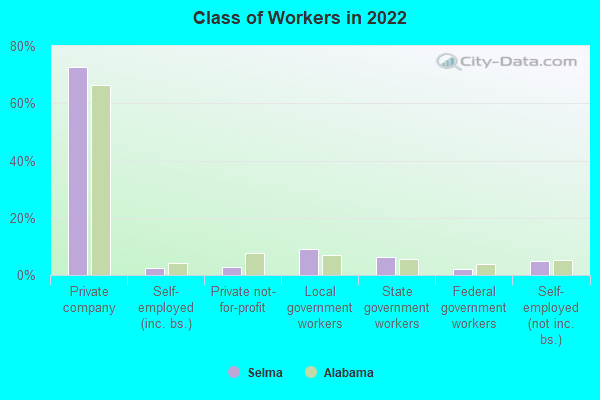
Employee of private company:
| Selma: | 72.5% (4,653) |
| Alabama: | 66.3% (1,510,956) |
Self-employed in own incorporated business:
| Selma: | 2.4% (153) |
| Alabama: | 4.1% (92,420) |
Private not-for-profit wage and salary workers:
| Selma: | 2.8% (181) |
| Alabama: | 7.5% (171,905) |
Local government workers:
| Selma: | 9.0% (580) |
| Alabama: | 7.0% (159,468) |
State government workers:
| Selma: | 6.3% (404) |
| Alabama: | 5.5% (124,918) |
Federal government workers:
| Selma: | 2.1% (136) |
| Alabama: | 4.0% (90,851) |
Self-employed workers in own not incorporated business:
| Selma: | 4.8% (308) |
| Alabama: | 5.4% (122,821) |

Employee of private company:
| Selma: | 61.5% (4,086) |
| Alabama: | 69.3% (1,330,489) |
Self-employed in own incorporated business:
| Selma: | 2.0% (130) |
| Alabama: | 3.0% (56,994) |
Private not-for-profit wage and salary workers:
| Selma: | 9.4% (624) |
| Alabama: | 5.7% (109,055) |
Local government workers:
| Selma: | 11.6% (768) |
| Alabama: | 6.7% (128,778) |
State government workers:
| Selma: | 7.5% (500) |
| Alabama: | 5.5% (105,286) |
Federal government workers:
| Selma: | 1.6% (107) |
| Alabama: | 3.4% (64,370) |
Self-employed workers in own not incorporated business:
| Selma: | 6.0% (396) |
| Alabama: | 6.2% (119,345) |
Unpaid family workers:
| Selma: | 0.4% (28) |
| Alabama: | 0.3% (5,872) |

Employee of private company - Males:
| Selma: | 75.5% (2,271) |
| Alabama: | 70.1% (833,392) |
Self-employed in own incorporated business - Males:
| Selma: | 2.7% (82) |
| Alabama: | 5.2% (61,823) |
Private not-for-profit wage and salary workers - Males:
| Selma: | 1.0% (31) |
| Alabama: | 4.7% (55,319) |
Local government workers - Males:
| Selma: | 6.3% (190) |
| Alabama: | 5.4% (64,465) |
State government workers - Males:
| Selma: | 5.0% (150) |
| Alabama: | 4.2% (49,930) |
Federal government workers - Males:
| Selma: | 2.8% (85) |
| Alabama: | 4.2% (50,378) |
Self-employed workers in own not incorporated business - Males:
| Selma: | 6.6% (199) |
| Alabama: | 6.0% (71,853) |

Employee of private company - Females:
| Selma: | 69.9% (2,382) |
| Alabama: | 62.2% (677,564) |
Self-employed in own incorporated business - Females:
| Selma: | 2.1% (70) |
| Alabama: | 2.8% (30,597) |
Private not-for-profit wage and salary workers - Females:
| Selma: | 4.4% (151) |
| Alabama: | 10.7% (116,586) |
Local government workers - Females:
| Selma: | 11.4% (390) |
| Alabama: | 8.7% (95,003) |
State government workers - Females:
| Selma: | 7.5% (255) |
| Alabama: | 6.9% (74,988) |
Federal government workers - Females:
| Selma: | 1.5% (52) |
| Alabama: | 3.7% (40,473) |
Self-employed workers in own not incorporated business - Females:
| Selma: | 3.2% (109) |
| Alabama: | 4.7% (50,968) |