Work and Jobs in Westmoreland, New York (NY) Detailed Stats
Occupations, Industries, Unemployment, Workers, Commute
Settings
X


Recent posts about work in Westmoreland, New York on our local forum with over 2,400,000 registered users:
 | Upstate NY job openings...... (1437 replies) |
| Tourism is on the rise in Oneida County. What is bringing so many people to the area? (2 replies) |
| Gentrification/revitalization and select neighborhoods (76 replies) |
| Patio or Deck? (12 replies) |
| smaller Upstate NY cities and towns/African American communities (6034 replies) |
| Relocating to Utica area for work - need advice on where to live! (31 replies) |
Latest news about work in Westmoreland, NY collected exclusively by city-data.com from local newspapers, TV, and radio stations
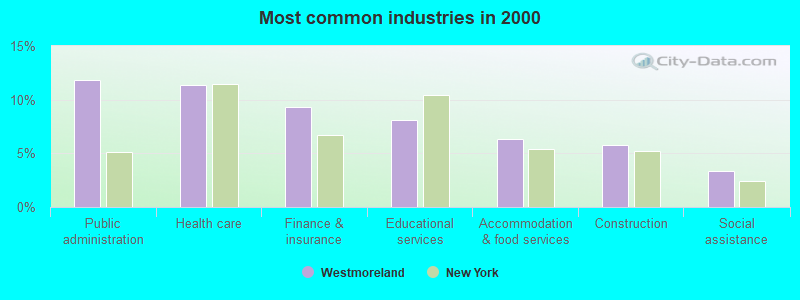
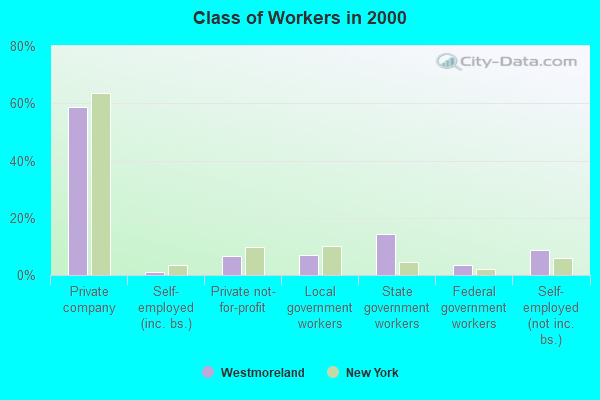
The most common industries in Westmoreland are: Public administration (11.8% of civilian employees), Health care (11.3% of civilian employees), Finance & insurance (9.3% of civilian employees). 58.6% of workers are employees of private companies, which is 8.7% less than the rate of 63.7% across the entire state of New York.
Most common industries
Most common industries | |||
|---|---|---|---|
Industry | All | Males | Females |
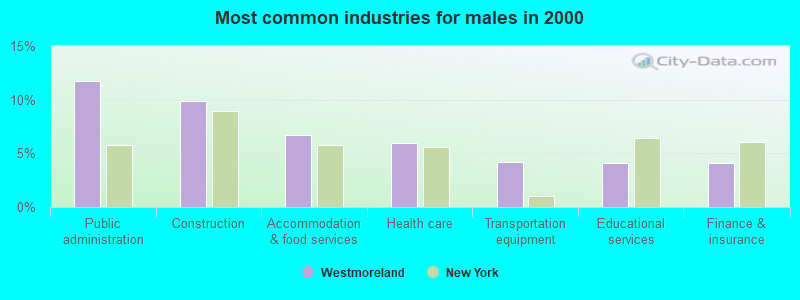
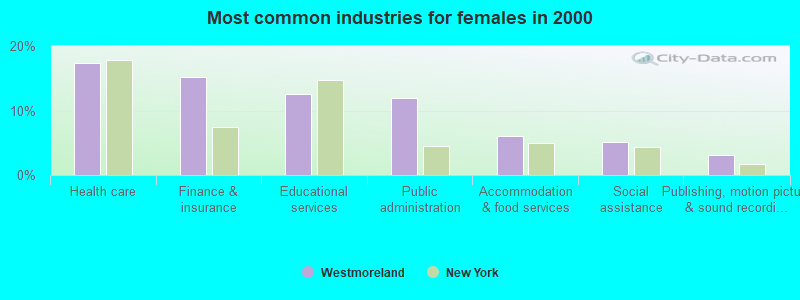
| Public administration | 11.8% (372) | 11.7% (195) | 11.9% (177) |
| Health care | 11.3% (357) | 6.0% (99) | 17.4% (258) |
| Finance and insurance | 9.3% (293) | 4.1% (68) | 15.2% (225) |
| Educational services | 8.1% (255) | 4.1% (68) | 12.6% (187) |
| Accommodation and food services | 6.4% (200) | 6.7% (111) | 6.0% (89) |
| Construction | 5.8% (183) | 9.9% (164) | 1.3% (19) |
| Social assistance | 3.3% (105) | 1.7% (29) | 5.1% (76) |
| Miscellaneous manufacturing | 2.7% (86) | 3.2% (54) | 2.2% (32) |
| Agriculture, forestry, fishing and hunting | 2.6% (81) | 3.2% (54) | 1.8% (27) |
| Transportation equipment | 2.2% (70) | 4.2% (70) | 0.0% (0) |
| Repair and maintenance | 2.1% (67) | 4.0% (67) | 0.0% (0) |
| Metal and metal products | 2.0% (64) | 2.9% (48) | 1.1% (16) |
| Broadcasting and telecommunications | 2.0% (63) | 1.6% (27) | 2.4% (36) |
| Department and other general merchandise stores | 1.8% (57) | 0.8% (14) | 2.9% (43) |
| Arts, entertainment, and recreation | 1.8% (56) | 2.8% (47) | 0.6% (9) |
| Publishing, and motion picture and sound recording industries | 1.8% (56) | 0.6% (10) | 3.1% (46) |
| Professional, scientific, and technical services | 1.7% (55) | 1.9% (31) | 1.6% (24) |
| Electrical equipment, appliances, and components | 1.7% (54) | 2.2% (37) | 1.1% (17) |
| Pharmacies and drug stores | 1.6% (49) | 2.0% (34) | 1.0% (15) |
| Administrative and support and waste management services | 1.5% (47) | 1.4% (24) | 1.5% (23) |
| Food | 1.2% (39) | 2.3% (39) | 0.0% (0) |
| Machinery, equipment, and supplies merchant wholesalers | 1.0% (33) | 2.0% (33) | 0.0% (0) |
| Other transportation, and support activities, and couriers | 1.0% (30) | 1.8% (30) | 0.0% (0) |
| Machinery | 0.9% (29) | 1.7% (29) | 0.0% (0) |
| Computer and electronic products | 0.9% (29) | 1.5% (25) | 0.3% (4) |
| Miscellaneous nondurable goods merchant wholesalers | 0.9% (29) | 1.7% (29) | 0.0% (0) |
| Utilities | 0.9% (27) | 1.6% (27) | 0.0% (0) |
| Truck transportation | 0.8% (26) | 1.6% (26) | 0.0% (0) |
| Other direct selling establishments | 0.8% (25) | 0.0% (0) | 1.7% (25) |
| Food and beverage stores | 0.8% (24) | 0.7% (12) | 0.8% (12) |
| U. S. Postal service | 0.8% (24) | 1.0% (16) | 0.5% (8) |
| Personal and laundry services | 0.7% (22) | 0.0% (0) | 1.5% (22) |
| Printing and related support activities | 0.7% (21) | 1.3% (21) | 0.0% (0) |
| Textile mills and textile products | 0.7% (21) | 1.3% (21) | 0.0% (0) |
| Air transportation | 0.6% (19) | 0.7% (12) | 0.5% (7) |
| Groceries and related products merchant wholesalers | 0.5% (16) | 0.5% (9) | 0.5% (7) |
| Sporting goods, camera, and hobby and toy stores | 0.5% (16) | 0.0% (0) | 1.1% (16) |
| Real estate and rental and leasing | 0.5% (15) | 0.0% (0) | 1.0% (15) |
| Religious, grantmaking, civic, professional, and similar organizations | 0.5% (15) | 0.9% (15) | 0.0% (0) |
| Data processing, libraries, and other information services | 0.4% (12) | 0.7% (12) | 0.0% (0) |
| Electrical and electronic goods merchant wholesalers | 0.3% (10) | 0.6% (10) | 0.0% (0) |
| Miscellaneous durable goods merchant wholesalers | 0.3% (10) | 0.6% (10) | 0.0% (0) |
| Petroleum and petroleum products merchant wholesalers | 0.3% (10) | 0.6% (10) | 0.0% (0) |
| Plastics and rubber products | 0.3% (9) | 0.0% (0) | 0.6% (9) |
| Building material and garden equipment and supplies dealers | 0.3% (9) | 0.5% (9) | 0.0% (0) |
| Retail florists | 0.3% (9) | 0.0% (0) | 0.6% (9) |
| Private households | 0.3% (9) | 0.0% (0) | 0.6% (9) |
| Clothing and accessories, including shoe, stores | 0.3% (8) | 0.5% (8) | 0.0% (0) |
| Nonmetallic mineral products | 0.3% (8) | 0.0% (0) | 0.5% (8) |
| Paper | 0.3% (8) | 0.5% (8) | 0.0% (0) |
| Furniture and home furnishings, and household appliance stores | 0.3% (8) | 0.0% (0) | 0.5% (8) |
| Used merchandise, gift, novelty, and souvenir, and other miscellaneous stores | 0.2% (7) | 0.0% (0) | 0.5% (7) |
Unemployment in Westmoreland
- Unemployment by race in 2000
- Unemployment rate for White non-Hispanic residents
- 2.7%Males
- 4.4%Females
- Unemployment rate for Black residents
- 47.6%Males
- Unemployment rate for Hispanic or Latino residents
- 66.7%Males
- 52.9%Females
Time leaving home to go to work

<5am:
| Westmoreland: | 2.1% (65) |
| New York: | 2.4% (194,562) |
5:30am:
| Westmoreland: | 1.9% (60) |
| New York: | 2.1% (174,328) |
6am:
| Westmoreland: | 2.8% (87) |
| New York: | 3.1% (253,826) |
6:30am:
| Westmoreland: | 7.6% (236) |
| New York: | 7.0% (573,349) |
7am:
| Westmoreland: | 11.4% (354) |
| New York: | 8.6% (706,982) |
7:30am:
| Westmoreland: | 11.3% (351) |
| New York: | 14.0% (1,147,579) |
8am:
| Westmoreland: | 14.4% (448) |
| New York: | 14.8% (1,213,706) |
8:30am:
| Westmoreland: | 15.8% (494) |
| New York: | 13.9% (1,144,298) |
9am:
| Westmoreland: | 4.3% (134) |
| New York: | 7.5% (614,475) |
10am:
| Westmoreland: | 2.1% (64) |
| New York: | 7.2% (593,377) |
11am:
| Westmoreland: | 1.9% (59) |
| New York: | 2.7% (224,011) |
12pm:
| Westmoreland: | 0.4% (11) |
| New York: | 1.3% (105,049) |
4pm:
| Westmoreland: | 10.9% (339) |
| New York: | 6.3% (517,309) |
>4pm:
| Westmoreland: | 10.2% (317) |
| New York: | 6.1% (501,196) |
Travel time to work


Less than 5 minutes:
| Westmoreland: | 3.3% (103) |
| New York: | 2.7% (219,036) |
5 to 9 minutes:
| Westmoreland: | 9.4% (292) |
| New York: | 8.3% (680,270) |
10 to 14 minutes:
| Westmoreland: | 14.7% (457) |
| New York: | 11.6% (956,590) |
15 to 19 minutes:
| Westmoreland: | 23.0% (716) |
| New York: | 12.4% (1,020,084) |
20 to 24 minutes:
| Westmoreland: | 23.4% (728) |
| New York: | 12.3% (1,013,757) |
25 to 29 minutes:
| Westmoreland: | 6.2% (194) |
| New York: | 4.9% (399,384) |
30 to 34 minutes:
| Westmoreland: | 8.4% (261) |
| New York: | 12.9% (1,058,688) |
35 to 39 minutes:
| Westmoreland: | 0.3% (8) |
| New York: | 2.5% (203,722) |
40 to 44 minutes:
| Westmoreland: | 0.4% (12) |
| New York: | 4.1% (340,311) |
45 to 59 minutes:
| Westmoreland: | 4.5% (139) |
| New York: | 9.8% (806,556) |
60 to 89 minutes:
| Westmoreland: | 2.5% (78) |
| New York: | 10.3% (848,185) |
90 or more minutes:
| Westmoreland: | 1.0% (31) |
| New York: | 5.1% (417,464) |
Means of transportation to work


Drove car alone:
| Westmoreland: | 82.8% (2,582) |
| New York: | 56.3% (4,620,178) |
Carpooled:
| Westmoreland: | 10.9% (341) |
| New York: | 9.2% (756,918) |
Railroad:
| Westmoreland: | 0.5% (17) |
| New York: | 2.8% (228,215) |
Walked:
| Westmoreland: | 1.3% (42) |
| New York: | 6.2% (511,721) |
Other means:
| Westmoreland: | 1.2% (37) |
| New York: | 0.5% (40,375) |
Private vehicle occupancy

Drove alone:
| Westmoreland: | 88.3% (2,582) |
| New York: | 85.9% (4,620,178) |
In 2 person carpool:
| Westmoreland: | 11.1% (323) |
| New York: | 11.0% (590,255) |
In 3 person carpool:
| Westmoreland: | 0.2% (7) |
| New York: | 1.8% (96,470) |
In 5-6 person carpool:
| Westmoreland: | 0.4% (11) |
| New York: | 0.3% (16,644) |
Class of workers
Employee of private company:
| Westmoreland: | 58.6% (1,845) |
| New York: | 63.7% (5,340,134) |
Self-employed in own incorporated business:
| Westmoreland: | 1.1% (35) |
| New York: | 3.4% (283,619) |
Private not-for-profit wage and salary workers:
| Westmoreland: | 6.7% (212) |
| New York: | 9.7% (810,356) |
Local government workers:
| Westmoreland: | 6.9% (218) |
| New York: | 10.2% (858,120) |
State government workers:
| Westmoreland: | 14.4% (453) |
| New York: | 4.6% (383,673) |
Federal government workers:
| Westmoreland: | 3.4% (108) |
| New York: | 2.2% (185,100) |
Self-employed workers in own not incorporated business:
| Westmoreland: | 8.7% (274) |
| New York: | 6.0% (501,068) |
Unpaid family workers:
| Westmoreland: | 0.1% (2) |
| New York: | 0.2% (20,918) |

Employee of private company - Males:
| Westmoreland: | 59.5% (989) |
| New York: | 66.2% (2,902,064) |
Self-employed in own incorporated business - Males:
| Westmoreland: | 2.1% (35) |
| New York: | 4.9% (215,651) |
Private not-for-profit wage and salary workers - Males:
| Westmoreland: | 5.2% (87) |
| New York: | 6.3% (277,787) |
Local government workers - Males:
| Westmoreland: | 5.2% (86) |
| New York: | 8.7% (380,426) |
State government workers - Males:
| Westmoreland: | 13.1% (217) |
| New York: | 4.1% (181,784) |
Federal government workers - Males:
| Westmoreland: | 4.4% (73) |
| New York: | 2.3% (102,647) |
Self-employed workers in own not incorporated business - Males:
| Westmoreland: | 10.5% (175) |
| New York: | 7.1% (312,497) |

Employee of private company - Females:
| Westmoreland: | 57.6% (856) |
| New York: | 60.9% (2,438,070) |
Private not-for-profit wage and salary workers - Females:
| Westmoreland: | 8.4% (125) |
| New York: | 13.3% (532,569) |
Local government workers - Females:
| Westmoreland: | 8.9% (132) |
| New York: | 11.9% (477,694) |
State government workers - Females:
| Westmoreland: | 15.9% (236) |
| New York: | 5.0% (201,889) |
Federal government workers - Females:
| Westmoreland: | 2.4% (35) |
| New York: | 2.1% (82,453) |
Self-employed workers in own not incorporated business - Females:
| Westmoreland: | 6.7% (99) |
| New York: | 4.7% (188,571) |
Unpaid family workers - Females:
| Westmoreland: | 0.1% (2) |
| New York: | 0.3% (11,448) |