Estimated zip code population in 2022: 1,072 Zip code population in 2010: 946 Zip code population in 2000: 1,031
Houses and condos: 615 Renter-occupied apartments: 92
% of renters here:
19%
State:
38%
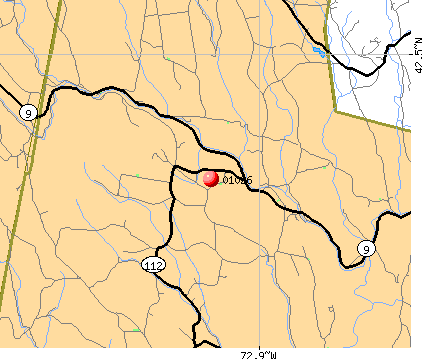
March 2022 cost of living index in zip code 01026: 85.7 (less than average, U.S. average is 100)
Land area: 24.0 sq. mi. Water area: 0.1 sq. mi.
Population density: 45 people per square mile
(very low).
OSM Map
Google Map
MSN Map
OSM Map
General Map
Google Map
MSN Map
OSM Map
Google Map
MSN Map
OSM Map
Google Map
MSN Map
Please wait while loading the map...
Real estate property taxes paid for housing units in 2022:
This zip code:
1.3% ($3,790)
Massachusetts:
1.0% ($5,536)
Median real estate property taxes paid for housing units with mortgages in 2022: $3,695 (1.2%) Median real estate property taxes paid for housing units with no mortgage in 2022: $3,860 (1.3%)
Business Search- 14 Million verified businesses
Males: 572
(53.3%)
Females: 500
(46.7%)
For population 25 years and over in 01026:
High school or higher: 97.8%
Bachelor's degree or higher: 57.2%
Graduate or professional degree: 29.5%
Unemployed: 0.5%
Mean travel time to work (commute): 32.2 minutes
For population 15 years and over in 01026:
Never married: 26.1%
Now married: 49.8%
Separated: 3.2%
Widowed: 3.6%
Divorced: 17.3%
Zip code 01026 compared to state average:
Median house value below state average.
Unemployed percentage significantly below state average.
Black race population percentage significantly below state average.
Hispanic race population percentage significantly below state average.
Median age significantly above state average.
Foreign-born population percentage significantly below state average.
Renting percentage below state average.
Length of stay since moving in significantly above state average.
Estimated median house/condo value in 2022: $301,881
01026:
$301,881
Massachusetts:
$534,700
Median resident age:
This zip code:
51.8 years
Massachusetts median age:
40.3 years
Average household size:
This zip code:
2.2 people
Massachusetts:
2.4 people
Averages for the 2020 tax year for zip code 01026, filed in 2021:
Average Adjusted Gross Income (AGI) in 2020: $62,037 (Individual Income Tax Returns)
Here:
$62,037
State:
$105,130
Salary/wage: $48,739 (reported on 73.1% of returns)
Here:
$48,739
State:
$82,951
(% of AGI for various income ranges: 943.3% for AGIs below $25k, 4152.5% for AGIs $25k-50k, 6732.5% for AGIs $50k-75k, 11745.0% for AGIs $75k-100k, 18616.0% for AGIs $100k-200k)
Taxable interest for individuals: $941 (reported on 42.3% of returns)
This zip code:
$941
Massachusetts:
$2,361
(% of AGI for various income ranges: 23.3% for AGIs below $25k, 11.2% for AGIs $25k-50k, 40.0% for AGIs $50k-75k, 225.0% for AGIs $75k-100k, 232.0% for AGIs $100k-200k)
Ordinary dividends: $5,536 (reported on 26.9% of returns)
Here:
$5,536
State:
$10,365
(% of AGI for various income ranges: 45.6% for AGIs below $25k, 66.2% for AGIs $25k-50k, 112.5% for AGIs $50k-75k, 520.0% for AGIs $75k-100k, 1064.0% for AGIs $100k-200k)
Net capital gain/loss in AGI: +$11,771 (reported on 26.9% of returns)
Here:
+$11,771
State:
+$48,178
(% of AGI for various income ranges: 34.4% for AGIs below $25k, 1047.5% for AGIs $50k-75k, 2396.0% for AGIs $100k-200k)
Profit/loss from business: +$15,692 (reported on 25.0% of returns)
Here:
+$15,692
State:
+$20,792
(% of AGI for various income ranges: 197.8% for AGIs below $25k, 502.5% for AGIs $25k-50k, 1250.0% for AGIs $50k-75k, 1920.0% for AGIs $100k-200k)
Taxable individual retirement arrangement distribution: $16,657 (reported on 13.5% of returns)
01026:
$16,657
Massachusetts:
$22,790
(% of AGI for various income ranges: 317.5% for AGIs $25k-50k, 1824.0% for AGIs $100k-200k)
Total itemized deductions: $27,100 (reported on 3.8% of returns)
Here:
$27,100
State:
$36,722
(% of AGI for various income ranges: 1355.0% for AGIs $50k-75k)
Taxes paid: $9,050 (reported on 3.8% of returns)
01026:
$9,050
State:
$8,782
(% of AGI for various income ranges: 452.5% for AGIs $50k-75k)
Earned income credit: $1,450 (reported on 11.5% of returns)
Here:
$1,450
State:
$1,909
(% of AGI for various income ranges: 96.7% for AGIs below $25k)
Percentage of individuals using paid preparers for their 2020 taxes: 88.5%
Here:
88%
State:
92%
(% for various income ranges: 87.5% for AGIs below $25k, 92.3% for AGIs $25k-50k, 85.7% for AGIs $50k-75k, 80.0% for AGIs $75k-100k, 90.9% for AGIs $100k-200k)
Averages for the 2012 tax year for zip code 01026, filed in 2013:
Average Adjusted Gross Income (AGI) in 2012: $54,920 (Individual Income Tax Returns)
Here:
$54,920
State:
$81,425
Salary/wage: $42,936 (reported on 76.5% of returns)
Here:
$42,936
State:
$64,752
(% of AGI for various income ranges: 62.4% for AGIs below $25k, 66.8% for AGIs $25k-50k, 64.4% for AGIs $50k-75k, 67.1% for AGIs $75k-100k, 52.4% for AGIs $100k-200k)
Taxable interest for individuals: $667 (reported on 47.1% of returns)
This zip code:
$667
Massachusetts:
$2,136
(% of AGI for various income ranges: 1.2% for AGIs below $25k, 0.7% for AGIs $25k-50k, 0.5% for AGIs $50k-75k, 0.9% for AGIs $75k-100k, 0.3% for AGIs $100k-200k)
Ordinary dividends: $3,573 (reported on 29.4% of returns)
Here:
$3,573
State:
$9,473
(% of AGI for various income ranges: 1.9% for AGIs below $25k, 3.2% for AGIs $25k-50k, 2.6% for AGIs $50k-75k, 1.8% for AGIs $75k-100k, 1.2% for AGIs $100k-200k)
Net capital gain/loss in AGI: +$3,982 (reported on 21.6% of returns)
Here:
+$3,982
State:
+$31,437
(% of AGI for various income ranges: 2.8% for AGIs $50k-75k, 2.6% for AGIs $100k-200k)
Profit/loss from business: +$18,225 (reported on 31.4% of returns)
Here:
+$18,225
State:
+$20,662
(% of AGI for various income ranges: 16.1% for AGIs below $25k, 11.4% for AGIs $25k-50k, 18.8% for AGIs $50k-75k, 9.5% for AGIs $100k-200k)
Taxable individual retirement arrangement distribution: $10,700 (reported on 9.8% of returns)
01026:
$10,700
Massachusetts:
$18,892
Total itemized deductions: $19,333 (20% of AGI, reported on 35.3% of returns)
Here:
$19,333
State:
$28,907
Here:
20.3% of AGI
State:
18.2% of AGI
(% of AGI for various income ranges: 13.0% for AGIs below $25k, 9.5% for AGIs $25k-50k, 13.6% for AGIs $50k-75k, 11.9% for AGIs $75k-100k, 13.2% for AGIs $100k-200k)
Charity contributions: $2,346 (reported on 25.5% of returns)
Here:
$2,346
State:
$4,208
(% of AGI for various income ranges: 0.7% for AGIs $25k-50k, 2.1% for AGIs $50k-75k, 1.4% for AGIs $100k-200k)
Taxes paid: $8,411 (reported on 35.3% of returns)
01026:
$8,411
State:
$13,303
(% of AGI for various income ranges: 4.1% for AGIs below $25k, 3.1% for AGIs $25k-50k, 5.7% for AGIs $50k-75k, 5.3% for AGIs $75k-100k, 6.5% for AGIs $100k-200k)
Earned income credit: $1,743 (reported on 13.7% of returns)
Here:
$1,743
State:
$1,971
(% of AGI for various income ranges: 3.9% for AGIs below $25k, 0.9% for AGIs $25k-50k)
Percentage of individuals using paid preparers for their 2012 taxes: 56.9%
Here:
57%
State:
56%
(% for various income ranges: 44.4% for AGIs below $25k, 61.5% for AGIs $25k-50k, 62.5% for AGIs $50k-75k, 60.0% for AGIs $75k-100k, 71.4% for AGIs $100k-200k)
Averages for the 2004 tax year for zip code 01026, filed in 2005:
Average Adjusted Gross Income (AGI) in 2004: $38,381 (Individual Income Tax Returns)
Here:
$38,381
State:
$62,877
Salary/wage: $34,324 (reported on 80.4% of returns)
Here:
$34,324
State:
$52,969
(% of AGI for various income ranges: 121.3% for AGIs below $10k, 66.0% for AGIs $10k-25k, 75.6% for AGIs $25k-50k, 74.0% for AGIs $50k-75k, 81.8% for AGIs $75k-100k, 52.8% for AGIs over 100k)
Taxable interest for individuals: $872 (reported on 60.6% of returns)
This zip code:
$872
Massachusetts:
$1,945
(% of AGI for various income ranges: 4.4% for AGIs below $10k, 2.7% for AGIs $10k-25k, 2.0% for AGIs $25k-50k, 0.5% for AGIs $50k-75k, 0.7% for AGIs $75k-100k, 1.1% for AGIs over 100k)
Taxable dividends: $2,376 (reported on 30.5% of returns)
Here:
$2,376
State:
$5,323
(% of AGI for various income ranges: 5.6% for AGIs below $10k, 4.1% for AGIs $10k-25k, 2.6% for AGIs $25k-50k, 1.4% for AGIs $50k-75k, 0.5% for AGIs $75k-100k, 1.2% for AGIs over 100k)
Net capital gain/loss: +$653 (reported on 24.1% of returns)
Here:
+$653
State:
+$20,377
(% of AGI for various income ranges: -5.0% for AGIs below $10k, -0.5% for AGIs $10k-25k, 2.0% for AGIs $25k-50k, -0.2% for AGIs $50k-75k, -0.4% for AGIs $75k-100k, 0.8% for AGIs over 100k)
Profit/loss from business: +$8,115 (reported on 28.7% of returns)
Here:
+$8,115
State:
+$17,837
(% of AGI for various income ranges: 3.6% for AGIs below $10k, 13.3% for AGIs $10k-25k, 9.0% for AGIs $25k-50k, 9.1% for AGIs $50k-75k, -0.0% for AGIs $75k-100k)
IRA payment deduction: $3,000 (reported on 2.7% of returns)
01026:
$3,000
Massachusetts:
$3,100
Total itemized deductions: $15,179 (25% of AGI, reported on 35.7% of returns)
Here:
$15,179
State:
$22,573
Here:
25.1% of AGI
State:
19.5% of AGI
(% of AGI for various income ranges: 47.9% for AGIs below $10k, 14.1% for AGIs $10k-25k, 11.2% for AGIs $25k-50k, 14.1% for AGIs $50k-75k, 13.8% for AGIs $75k-100k, 15.6% for AGIs over 100k)
Charity contributions deductions: $1,403 (2% of AGI, reported on 30.9% of returns)
Here:
$1,403
State:
$3,295
Here:
2.2% of AGI
State:
2.7% of AGI
(% of AGI for various income ranges: 1.3% for AGIs $10k-25k, 1.3% for AGIs $25k-50k, 0.8% for AGIs $50k-75k, 0.9% for AGIs $75k-100k, 1.6% for AGIs over 100k)
Total tax: $4,881 (reported on 82.9% of returns)
01026:
$4,881
State:
$11,494
(% of AGI for various income ranges: 4.1% for AGIs below $10k, 6.2% for AGIs $10k-25k, 8.5% for AGIs $25k-50k, 9.3% for AGIs $50k-75k, 10.4% for AGIs $75k-100k, 18.6% for AGIs over 100k)
Earned income credit: $1,333 (reported on 9.3% of returns)
Here:
$1,333
State:
$1,518
Percentage of individuals using paid preparers for their 2004 taxes: 54.2%
Here:
54%
State:
58%
(% for various income ranges: 39.4% for AGIs below $10k, 54.2% for AGIs $10k-25k, 55.6% for AGIs $25k-50k, 59.2% for AGIs $50k-75k, 60.5% for AGIs $75k-100k, 79.2% for AGIs over 100k)
Notable locations in zip code 01026: Joyner Dairy Farm (A), Berkshire Show Basin Ski Area (B), Bryant Homestead (C), Cummington Fairgrounds (D), Jordansville (E), Cummington Fire Department (F), Kingman Tavern Museum (G), Cummington Town Hall (H). Display/hide their locations on the map
Size of family households: 147 2-persons, 58 3-persons, 33 4-persons, 37 5-persons, 10 6-persons
Size of nonfamily households: 182 1-person, 19 2-persons
67 married couples with children.
78 single-parent households (42 men, 36 women).
92.6% of residents of 01026 zip code speak English at home.
0.4% of residents speak Spanish at home (100% very well).
6.7% of residents speak other Indo-European language at home (96% very well, 4% not well).
Foreign born population: 71 (6.6%) (88.6% of them are naturalized citizens)
This zip code:
6.6%
Whole state:
18.0%
69%France
14%Serbia
7%Switzerland
14%English
14%Irish
11%American
9%German
7%Scottish
7%Ukrainian
6%Italian
Year of entry for the foreign-born population
102010 or later
02000 to 2009
01990 to 1999
84Before 1990
Facilities with environmental interests located in this zip code:
BERKSHIRE TRAIL ELEM (MAIN STREET in CUMMINGTON, MA)
(National Center for Education Statistics) - STATE ID-635010 Organizations: CENTRAL BERKSHIRE (SCHOOL DISTRICT)
Housing units lacking complete plumbing facilities: 4.2% Housing units lacking complete kitchen facilities: 3.1%
38.0%Fuel oil, kerosene, etc.
35.9%Bottled, tank, or LP gas
17.9%Wood
4.8%Electricity
1.9%Utility gas
0.8%Solar energy
0.8%Other fuel
Population in 1990: 1,484.
Place of birth for U.S.-born residents:
This state: 624
Northeast: 228
Midwest: 59
South: 25
West: 34
62% of the 01026 zip code residents lived in the same house 5 years ago. Out of people who lived in different houses, 36% lived in this county. Out of people who lived in different counties, 50% lived in Massachusetts.
95% of the 01026 zip code residents lived in the same house 1 year ago. Out of people who lived in different houses, 26% moved from this county. Out of people who lived in different houses, 44% moved from different county within same state. Out of people who lived in different houses, 23% moved from different state. Out of people who lived in different houses, 9% moved from abroad.
Private vs. public school enrollment:
Students in private schools in grades 1 to 8 (elementary and middle school): 19
Here:
32.5%
Massachusetts:
10.3%
Students in private schools in grades 9 to 12 (high school):
Here:
0.0%
Massachusetts:
12.3%
Students in private undergraduate colleges: 2
Here:
4.1%
Massachusetts:
51.2%
Occupation by median earnings in the past 12 months ($)
138,036Legal occupations
109,148Computer and mathematical occupations
100,009Management occupations
79,136Business and financial operations occupations
69,944Arts, design, entertainment, sports, and media occupations
62,828Sales and related occupations
Top industries in this zip code by the number of employees in 2005:
Educational Services: Elementary and Secondary Schools (50-99 employees: 1 establishment)
Administrative and Support and Waste Management and Remediation Services: Solid Waste Landfill (5-9: 1)
Health Care and Social Assistance: Residential Mental Health and Substance Abuse Facilities (5-9: 1)
Health Care and Social Assistance: Child and Youth Services (1-4: 1)
Educational Services: All Other Miscellaneous Schools and Instruction (1-4: 1)
Accommodation and Food Services: Caterers (1-4: 1)
Administrative and Support and Waste Management and Remediation Services: Janitorial Services (1-4: 1)
People in group quarters in 2000:
115 people in unknown juvenile institutions
Fatal accident statistics in 2013:
Fatal accident count: 1
Vehicles involved in fatal accidents: 2
Fatal accidents caused by drunken drivers: 0
Fatalities: 1
Persons involved in fatal accidents: 2
Pedestrians involved in fatal accidents: 0
Home Mortgage Disclosure Act Aggregated Statistics For Year 2009 (Based on 2 partial tracts)
A) FHA, FSA/RHS & VA Home Purchase Loans
B) Conventional Home Purchase Loans
C) Refinancings
D) Home Improvement Loans
F) Non-occupant Loans on < 5 Family Dwellings (A B C & D)
Number
Average Value
Number
Average Value
Number
Average Value
Number
Average Value
Number
Average Value
LOANS ORIGINATED
1
$220,550
12
$189,947
41
$177,127
7
$90,150
2
$234,400
APPLICATIONS APPROVED, NOT ACCEPTED
0
$0
0
$0
1
$297,800
0
$0
0
$0
APPLICATIONS DENIED
1
$239,010
0
$0
14
$172,563
3
$75,137
0
$0
APPLICATIONS WITHDRAWN
0
$0
0
$0
5
$221,816
0
$0
0
$0
FILES CLOSED FOR INCOMPLETENESS
0
$0
0
$0
4
$133,595
0
$0
0
$0
Aggregated Statistics For Year 2008 (Based on 2 partial tracts)
B) Conventional Home Purchase Loans
C) Refinancings
D) Home Improvement Loans
F) Non-occupant Loans on < 5 Family Dwellings (A B C & D)
Number
Average Value
Number
Average Value
Number
Average Value
Number
Average Value
LOANS ORIGINATED
10
$187,082
19
$168,445
9
$155,888
2
$191,405
APPLICATIONS APPROVED, NOT ACCEPTED
0
$0
2
$172,700
0
$0
0
$0
APPLICATIONS DENIED
3
$227,677
10
$184,507
2
$60,725
0
$0
APPLICATIONS WITHDRAWN
0
$0
8
$174,828
0
$0
1
$126,310
FILES CLOSED FOR INCOMPLETENESS
0
$0
2
$297,310
0
$0
0
$0
Aggregated Statistics For Year 2007 (Based on 2 partial tracts)
A) FHA, FSA/RHS & VA Home Purchase Loans
B) Conventional Home Purchase Loans
C) Refinancings
D) Home Improvement Loans
F) Non-occupant Loans on < 5 Family Dwellings (A B C & D)
Number
Average Value
Number
Average Value
Number
Average Value
Number
Average Value
Number
Average Value
LOANS ORIGINATED
1
$283,220
16
$171,214
24
$215,837
18
$95,541
2
$186,060
APPLICATIONS APPROVED, NOT ACCEPTED
0
$0
2
$148,900
4
$145,862
1
$321,600
1
$133,600
APPLICATIONS DENIED
0
$0
2
$123,395
14
$131,479
5
$37,310
1
$252,620
APPLICATIONS WITHDRAWN
0
$0
1
$165,170
8
$161,285
2
$60,480
0
$0
FILES CLOSED FOR INCOMPLETENESS
0
$0
1
$215,700
4
$167,965
1
$188,980
0
$0
Aggregated Statistics For Year 2006 (Based on 2 partial tracts)
B) Conventional Home Purchase Loans
C) Refinancings
D) Home Improvement Loans
F) Non-occupant Loans on < 5 Family Dwellings (A B C & D)
G) Loans On Manufactured Home Dwelling (A B C & D)
Number
Average Value
Number
Average Value
Number
Average Value
Number
Average Value
Number
Average Value
LOANS ORIGINATED
18
$199,556
41
$145,420
15
$70,020
5
$175,568
0
$0
APPLICATIONS APPROVED, NOT ACCEPTED
1
$286,140
5
$131,748
1
$133,600
0
$0
0
$0
APPLICATIONS DENIED
5
$201,996
25
$157,263
5
$70,732
0
$0
1
$83,560
APPLICATIONS WITHDRAWN
2
$222,255
16
$143,432
2
$55,865
0
$0
0
$0
FILES CLOSED FOR INCOMPLETENESS
2
$198,450
8
$147,076
0
$0
0
$0
0
$0
Aggregated Statistics For Year 2005 (Based on 2 partial tracts)
B) Conventional Home Purchase Loans
C) Refinancings
D) Home Improvement Loans
F) Non-occupant Loans on < 5 Family Dwellings (A B C & D)
G) Loans On Manufactured Home Dwelling (A B C & D)
Number
Average Value
Number
Average Value
Number
Average Value
Number
Average Value
Number
Average Value
LOANS ORIGINATED
16
$220,249
34
$150,498
16
$86,472
3
$166,790
0
$0
APPLICATIONS APPROVED, NOT ACCEPTED
4
$148,898
4
$174,038
1
$109,310
0
$0
0
$0
APPLICATIONS DENIED
3
$142,827
25
$155,689
9
$113,947
1
$165,660
1
$83,560
APPLICATIONS WITHDRAWN
3
$199,503
22
$143,929
1
$39,350
2
$213,510
0
$0
FILES CLOSED FOR INCOMPLETENESS
2
$136,025
3
$215,210
0
$0
0
$0
0
$0
Aggregated Statistics For Year 2004 (Based on 2 partial tracts)
A) FHA, FSA/RHS & VA Home Purchase Loans
B) Conventional Home Purchase Loans
C) Refinancings
D) Home Improvement Loans
F) Non-occupant Loans on < 5 Family Dwellings (A B C & D)


 Nearest zip codes: 01070, 01098, 01084, 01032, 01330, 01012.


