Estimated zip code population in 2022: 570 Zip code population in 2010: 629 Zip code population in 2000: 566
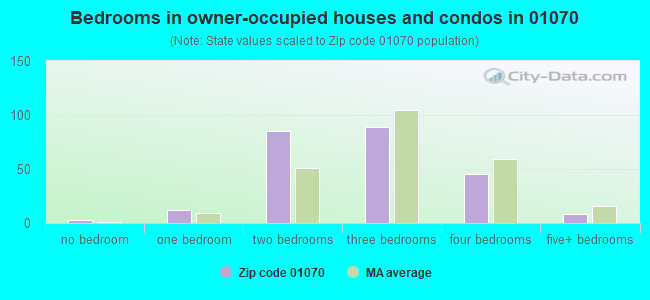
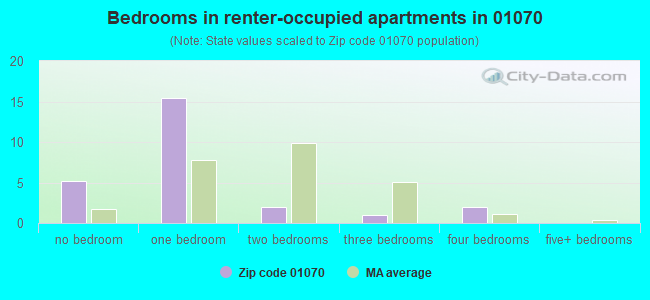
Houses and condos: 359 Renter-occupied apartments: 25
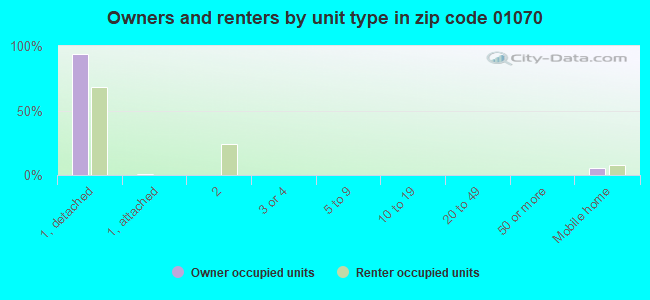
% of renters here:
10%
State:
38%
March 2022 cost of living index in zip code 01070: 87.3 (less than average, U.S. average is 100)
Land area: 20.5 sq. mi. Water area: 0.2 sq. mi.
Population density: 28 people per square mile
(very low).
OSM Map
Google Map
MSN Map
OSM Map
General Map
Google Map
MSN Map
OSM Map
Google Map
MSN Map
OSM Map
Google Map
MSN Map
Please wait while loading the map...
Real estate property taxes paid for housing units in 2022:
This zip code:
1.5% ($4,229)
Massachusetts:
1.0% ($5,536)
Median real estate property taxes paid for housing units with mortgages in 2022: $4,129 (1.5%) Median real estate property taxes paid for housing units with no mortgage in 2022: $4,296 (1.6%)
Business Search- 14 Million verified businesses
Males: 267
(46.8%)
Females: 303
(53.2%)
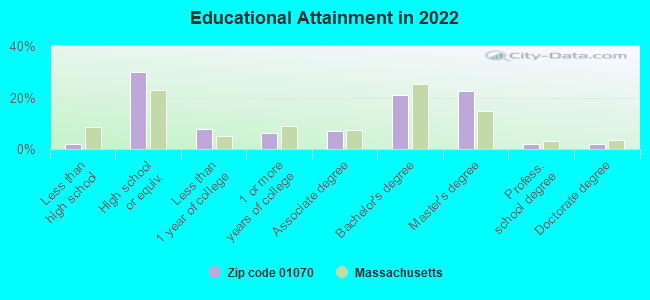
For population 25 years and over in 01070:
High school or higher: 98.3%
Bachelor's degree or higher: 47.4%
Graduate or professional degree: 26.5%
Unemployed: 1.3%
Mean travel time to work (commute): 35.6 minutes
For population 15 years and over in 01070:
Never married: 30.2%
Now married: 51.0%
Separated: 0.6%
Widowed: 3.7%
Divorced: 14.5%
Zip code 01070 compared to state average:
Median household income below state average.
Median house value below state average.
Unemployed percentage significantly below state average.
Black race population percentage significantly below state average.
Hispanic race population percentage significantly below state average.
Median age significantly above state average.
Foreign-born population percentage significantly below state average.
Renting percentage significantly below state average.
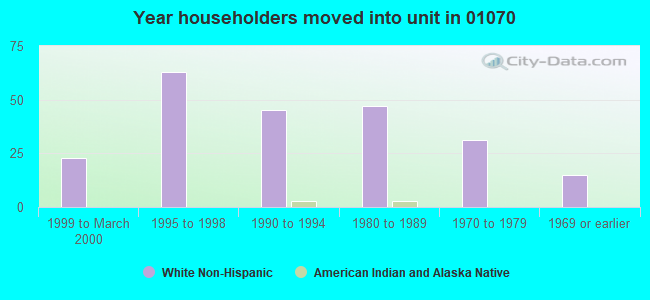
Length of stay since moving in significantly above state average.
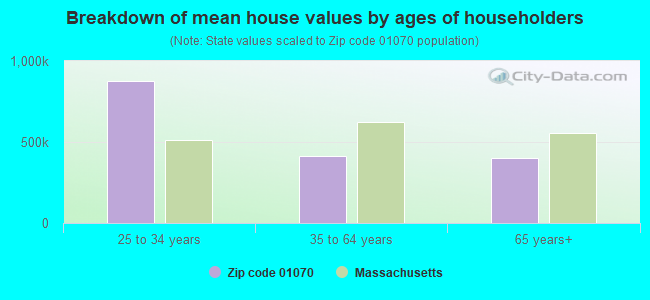
Estimated median house/condo value in 2022: $274,367
01070:
$274,367
Massachusetts:
$534,700
According to our research of Massachusetts and other state lists, there was 1 registered sex offender living in 01070 zip code as of May 24, 2024. The ratio of all residents to sex offenders in zip code 01070 is 570 to 1.
Median resident age:
This zip code:
56.3 years
Massachusetts median age:
40.3 years
Average household size:
This zip code:
2.1 people
Massachusetts:
2.4 people
Averages for the 2020 tax year for zip code 01070, filed in 2021:
Average Adjusted Gross Income (AGI) in 2020: $54,891 (Individual Income Tax Returns)
Here:
$54,891
State:
$105,130
Salary/wage: $45,909 (reported on 71.9% of returns)
Here:
$45,909
State:
$82,951
(% of AGI for various income ranges: 946.7% for AGIs below $25k, 3922.0% for AGIs $25k-50k, 6220.0% for AGIs $50k-75k, 5722.5% for AGIs $75k-100k)
Taxable interest for individuals: $546 (reported on 40.6% of returns)
This zip code:
$546
Massachusetts:
$2,361
(% of AGI for various income ranges: 25.0% for AGIs below $25k, 40.0% for AGIs $25k-50k, 36.7% for AGIs $50k-75k)
Ordinary dividends: $3,662 (reported on 25.0% of returns)
Here:
$3,662
State:
$10,365
(% of AGI for various income ranges: 85.0% for AGIs below $25k, 152.0% for AGIs $25k-50k, 415.0% for AGIs $75k-100k)
Net capital gain/loss in AGI: +$2,314 (reported on 21.9% of returns)
Here:
+$2,314
State:
+$48,178
(% of AGI for various income ranges: 154.0% for AGIs $25k-50k, 212.5% for AGIs $75k-100k)
Profit/loss from business: +$6,414 (reported on 21.9% of returns)
Here:
+$6,414
State:
+$20,792
(% of AGI for various income ranges: 171.7% for AGIs below $25k, 460.0% for AGIs $25k-50k, 386.7% for AGIs $50k-75k)
Taxable individual retirement arrangement distribution: $12,350 (reported on 12.5% of returns)
01070:
$12,350
Massachusetts:
$22,790
(% of AGI for various income ranges: 988.0% for AGIs $25k-50k)
Total itemized deductions: $19,233 (reported on 9.4% of returns)
Here:
$19,233
State:
$36,722
(% of AGI for various income ranges: 1154.0% for AGIs $25k-50k)
Taxes paid: $6,633 (reported on 9.4% of returns)
01070:
$6,633
State:
$8,782
(% of AGI for various income ranges: 663.3% for AGIs $50k-75k)
Earned income credit: $1,475 (reported on 12.5% of returns)
Here:
$1,475
State:
$1,909
(% of AGI for various income ranges: 98.3% for AGIs below $25k)
Percentage of individuals using paid preparers for their 2020 taxes: 90.6%
Here:
91%
State:
92%
(% for various income ranges: 90.0% for AGIs below $25k, 88.9% for AGIs $25k-50k, 100.0% for AGIs $50k-75k, 100.0% for AGIs $75k-100k, 80.0% for AGIs $100k-200k)
Averages for the 2012 tax year for zip code 01070, filed in 2013:
Average Adjusted Gross Income (AGI) in 2012: $46,109 (Individual Income Tax Returns)
Here:
$46,109
State:
$81,425
Salary/wage: $35,665 (reported on 81.2% of returns)
Here:
$35,665
State:
$64,752
(% of AGI for various income ranges: 59.1% for AGIs below $25k, 77.2% for AGIs $25k-50k, 103.0% for AGIs $50k-75k, 49.7% for AGIs $100k-200k)
Taxable interest for individuals: $677 (reported on 40.6% of returns)
This zip code:
$677
Massachusetts:
$2,136
(% of AGI for various income ranges: 0.7% for AGIs below $25k, 0.5% for AGIs $25k-50k, 0.6% for AGIs $50k-75k, 0.8% for AGIs $100k-200k)
Ordinary dividends: $1,988 (reported on 25.0% of returns)
Here:
$1,988
State:
$9,473
Profit/loss from business: +$11,144 (reported on 28.1% of returns)
Here:
+$11,144
State:
+$20,662
(% of AGI for various income ranges: 16.3% for AGIs below $25k, 7.1% for AGIs $25k-50k, 15.0% for AGIs $50k-75k)
Taxable individual retirement arrangement distribution: $15,375 (reported on 12.5% of returns)
01070:
$15,375
Massachusetts:
$18,892
Total itemized deductions: $16,891 (22% of AGI, reported on 34.4% of returns)
Here:
$16,891
State:
$28,907
Here:
21.8% of AGI
State:
18.2% of AGI
(% of AGI for various income ranges: 11.5% for AGIs $25k-50k, 23.4% for AGIs $50k-75k, 14.0% for AGIs $100k-200k)
Charity contributions: $2,529 (reported on 21.9% of returns)
Here:
$2,529
State:
$4,208
Taxes paid: $7,482 (reported on 34.4% of returns)
01070:
$7,482
State:
$13,303
(% of AGI for various income ranges: 4.0% for AGIs $25k-50k, 10.1% for AGIs $50k-75k, 7.0% for AGIs $100k-200k)
Earned income credit: $1,500 (reported on 12.5% of returns)
Here:
$1,500
State:
$1,971
(% of AGI for various income ranges: 4.0% for AGIs below $25k)
Percentage of individuals using paid preparers for their 2012 taxes: 53.1%
Here:
53%
State:
56%
(% for various income ranges: 46.2% for AGIs below $25k, 50.0% for AGIs $25k-50k, 66.7% for AGIs $50k-75k, 150.0% for AGIs $75k-100k)
Averages for the 2004 tax year for zip code 01070, filed in 2005:
Average Adjusted Gross Income (AGI) in 2004: $39,554 (Individual Income Tax Returns)
Here:
$39,554
State:
$62,877
Salary/wage: $34,288 (reported on 79.9% of returns)
Here:
$34,288
State:
$52,969
(% of AGI for various income ranges: 90.8% for AGIs below $10k, 68.2% for AGIs $10k-25k, 74.9% for AGIs $25k-50k, 80.1% for AGIs $50k-75k, 65.7% for AGIs $75k-100k, 50.6% for AGIs over 100k)
Taxable interest for individuals: $919 (reported on 53.6% of returns)
This zip code:
$919
Massachusetts:
$1,945
(% of AGI for various income ranges: 3.1% for AGIs below $10k, 5.1% for AGIs $10k-25k, 1.4% for AGIs $25k-50k, 0.4% for AGIs $50k-75k, 0.4% for AGIs $75k-100k, 0.6% for AGIs over 100k)
Taxable dividends: $1,486 (reported on 25.2% of returns)
Here:
$1,486
State:
$5,323
(% of AGI for various income ranges: 1.8% for AGIs $10k-25k, 0.9% for AGIs $25k-50k, 0.1% for AGIs $50k-75k, 2.8% for AGIs $75k-100k)
Net capital gain/loss: +$116 (reported on 15.5% of returns)
Here:
+$116
State:
+$20,377
Profit/loss from business: +$7,564 (reported on 28.1% of returns)
Here:
+$7,564
State:
+$17,837
(% of AGI for various income ranges: 21.5% for AGIs below $10k, 12.6% for AGIs $10k-25k, 8.5% for AGIs $25k-50k, 7.3% for AGIs $75k-100k)
IRA payment deduction: $2,312 (reported on 5.8% of returns)
01070:
$2,312
Massachusetts:
$3,100
Total itemized deductions: $14,556 (22% of AGI, reported on 32.4% of returns)
Here:
$14,556
State:
$22,573
Here:
21.8% of AGI
State:
19.5% of AGI
(% of AGI for various income ranges: 12.3% for AGIs $10k-25k, 11.7% for AGIs $25k-50k, 13.6% for AGIs $50k-75k, 13.8% for AGIs $75k-100k, 9.5% for AGIs over 100k)
Charity contributions deductions: $1,634 (2% of AGI, reported on 29.5% of returns)
Here:
$1,634
State:
$3,295
Here:
2.4% of AGI
State:
2.7% of AGI
(% of AGI for various income ranges: 1.0% for AGIs $10k-25k, 1.8% for AGIs $25k-50k, 1.5% for AGIs $50k-75k, 1.7% for AGIs $75k-100k)
Total tax: $4,504 (reported on 82.7% of returns)
01070:
$4,504
State:
$11,494
(% of AGI for various income ranges: 5.1% for AGIs below $10k, 5.3% for AGIs $10k-25k, 8.1% for AGIs $25k-50k, 8.5% for AGIs $50k-75k, 12.6% for AGIs $75k-100k, 11.9% for AGIs over 100k)
Earned income credit: $1,256 (reported on 14.0% of returns)
Here:
$1,256
State:
$1,518
Percentage of individuals using paid preparers for their 2004 taxes: 51.4%
Here:
51%
State:
58%
(% for various income ranges: 44.9% for AGIs below $10k, 56.5% for AGIs $10k-25k, 47.0% for AGIs $25k-50k, 50.0% for AGIs $50k-75k, 100.0% for AGIs $75k-100k)
Household received Food Stamps/SNAP in the past 12 months: 19 Household did not receive Food Stamps/SNAP in the past 12 months: 242
Women who had a birth in the past 12 months: 6 (7 now married, 0 unmarried) Women who did not have a birth in the past 12 months: 81 (26 now married, 54 unmarried)
Housing units in zip code 01070 with a mortgage: 131 (25 second mortgage, 7 both second mortgage and home equity loan) Houses without a mortgage: 11
Median monthly owner costs for units with a mortgage: $1,782 Median monthly owner costs for units without a mortgage: $719
Residents with income below the poverty level in 2022:
This zip code:
16.6%
Whole state:
10.4%
Residents with income below 50% of the poverty level in 2022:
This zip code:
3.6%
Whole state:
5.1%
Median number of rooms in houses and condos:
Here:
6.1
State:
6.5
Median number of rooms in apartments:
Here:
2.3
State:
4.0
Notable locations in this zip code not listed on our city pages
Notable locations in zip code 01070: Plainfield Town Hall (A), Plainfield Fire EMS (B), Plainfield Fire Department (C), Shaw Memorial Library (D). Display/hide their locations on the map
In group quarters: 5 (-1 institutionalized population)
Size of family households: 82 2-persons, 41 3-persons, 29 4-persons
Size of nonfamily households: 81 1-person, 31 2-persons, 1 5-persons
38 married couples with children.
50 single-parent households (50 women).
95.9% of residents of 01070 zip code speak English at home.
4.0% of residents speak other Indo-European language at home (100% very well).
0.2% of residents speak Asian or Pacific Island language at home (100% very well).
0.4% of residents speak other language at home (100% very well).
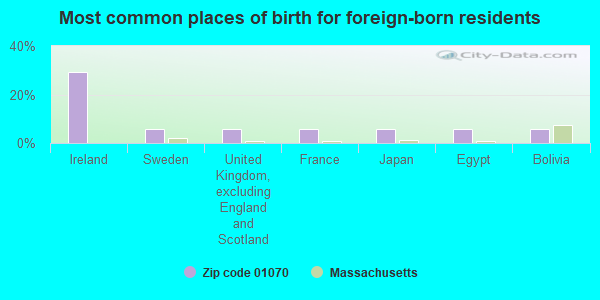
Foreign born population: 17 (3.0%) (29.8% of them are naturalized citizens)
This zip code:
3.0%
Whole state:
18.0%
29%Ireland
6%Sweden
6%United Kingdom, excluding England and Scotland
6%France
6%Japan
6%Egypt
6%Bolivia
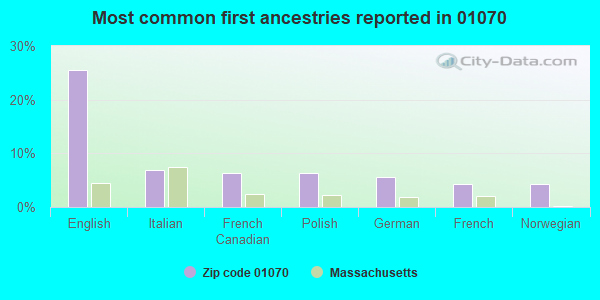
26%English
7%Italian
6%French Canadian
6%Polish
6%German
4%French
4%Norwegian
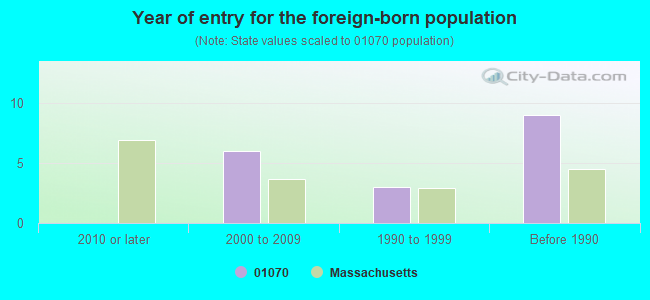
Year of entry for the foreign-born population
02010 or later
62000 to 2009
31990 to 1999
9Before 1990
Housing units lacking complete plumbing facilities: 5.3% Housing units lacking complete kitchen facilities: 5.6%
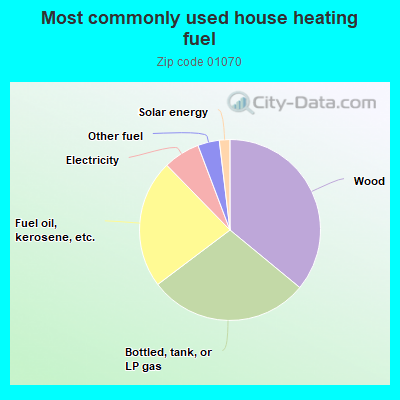
36.3%Wood
29.0%Bottled, tank, or LP gas
23.2%Fuel oil, kerosene, etc.
6.6%Electricity
3.9%Other fuel
1.9%Solar energy
Population in 1990: 571.
Place of birth for U.S.-born residents:
This state: 328
Northeast: 137
Midwest: 54
South: 24
West: 3
59% of the 01070 zip code residents lived in the same house 5 years ago. Out of people who lived in different houses, 35% lived in this county. Out of people who lived in different counties, 50% lived in Massachusetts.
93% of the 01070 zip code residents lived in the same house 1 year ago. Out of people who lived in different houses, 24% moved from this county. Out of people who lived in different houses, 64% moved from different county within same state. Out of people who lived in different houses, 9% moved from different state.
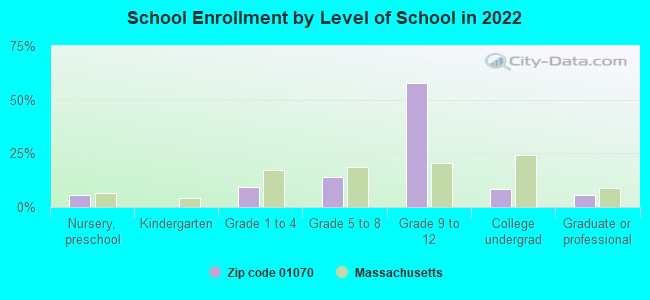
Private vs. public school enrollment:
Students in private schools in grades 1 to 8 (elementary and middle school):
Here:
3.5%
Massachusetts:
10.3%
Students in private schools in grades 9 to 12 (high school): 8
Here:
12.7%
Massachusetts:
12.3%
Students in private undergraduate colleges: 1
Here:
10.6%
Massachusetts:
51.2%
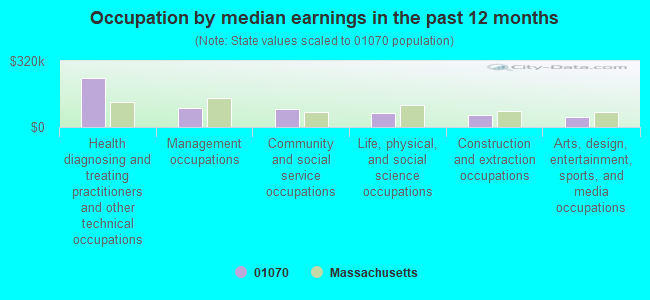
Occupation by median earnings in the past 12 months ($)
237,902Health diagnosing and treating practitioners and other technical occupations
92,565Management occupations
85,934Community and social service occupations
68,153Life, physical, and social science occupations
56,650Construction and extraction occupations
50,097Arts, design, entertainment, sports, and media occupations
Companies with federal contracts located in this zip code:
HOLE IN THE MOUNTAIN, INC (129 NORTH UNION ST in PLAINFIELD, MA; small business) : $29,004 in 2 contractsfrom 2003 to 2005
$24,855 with Army for Athletic and Sporting Equipment. Taking place in VT. Signed on 2003-08-20. Completion date: 2003-12-19.
$4,149 with Army for Outerwear, Men's. Signed on 2005-03-15. Completion date: 2005-04-15.
HALEYS (169 GRANT ST in PLAINFIELD, TX; small business)
$3,120 with Army for Recreational Services. Taking place in TX. Signed on 2004-09-16. Completion date: 2004-10-01.
Top industries in this zip code by the number of employees in 2005:
Educational Services: Fine Arts Schools (5-9 employees: 1 establishment)
Arts, Entertainment, and Recreation: Independent Artists, Writers, and Performers (1-4: 1)
Construction: New Single-Family Housing Construction (except Operative Builders) (1-4: 1)
Arts, Entertainment, and Recreation: Fitness and Recreational Sports Centers (1-4: 1)
People in group quarters in 2010:
2 people in workers' group living quarters and job corps centers
Home Mortgage Disclosure Act Aggregated Statistics For Year 2009 (Based on 2 partial tracts)
A) FHA, FSA/RHS & VA Home Purchase Loans
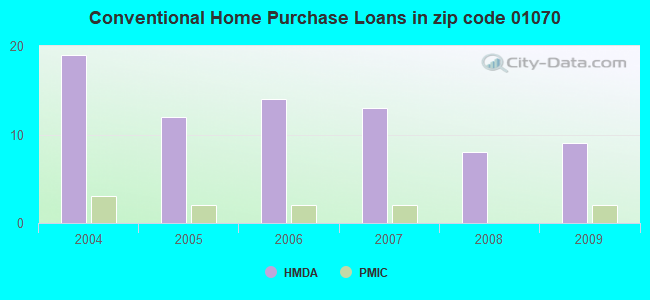
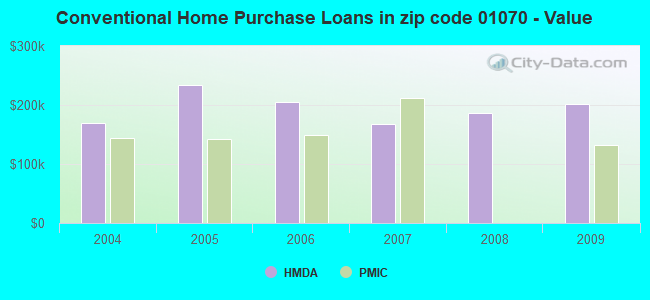
B) Conventional Home Purchase Loans
C) Refinancings
D) Home Improvement Loans
F) Non-occupant Loans on < 5 Family Dwellings (A B C & D)
Number
Average Value
Number
Average Value
Number
Average Value
Number
Average Value
Number
Average Value
LOANS ORIGINATED
1
$175,880
9
$201,964
33
$175,492
5
$100,646
2
$186,920
APPLICATIONS APPROVED, NOT ACCEPTED
0
$0
0
$0
1
$237,480
0
$0
0
$0
APPLICATIONS DENIED
1
$190,600
0
$0
11
$175,140
2
$89,875
0
$0
APPLICATIONS WITHDRAWN
0
$0
0
$0
4
$221,108
0
$0
0
$0
FILES CLOSED FOR INCOMPLETENESS
0
$0
0
$0
3
$142,047
0
$0
0
$0
Aggregated Statistics For Year 2008 (Based on 2 partial tracts)
B) Conventional Home Purchase Loans
C) Refinancings
D) Home Improvement Loans
F) Non-occupant Loans on < 5 Family Dwellings (A B C & D)
Number
Average Value
Number
Average Value
Number
Average Value
Number
Average Value
LOANS ORIGINATED
8
$186,485
15
$170,146
7
$159,830
2
$152,635
APPLICATIONS APPROVED, NOT ACCEPTED
0
$0
2
$137,720
0
$0
0
$0
APPLICATIONS DENIED
3
$181,560
8
$183,919
2
$48,425
0
$0
APPLICATIONS WITHDRAWN
0
$0
6
$185,887
0
$0
1
$100,720
FILES CLOSED FOR INCOMPLETENESS
0
$0
2
$237,090
0
$0
0
$0
Aggregated Statistics For Year 2007 (Based on 2 partial tracts)
A) FHA, FSA/RHS & VA Home Purchase Loans
B) Conventional Home Purchase Loans
C) Refinancings
D) Home Improvement Loans
F) Non-occupant Loans on < 5 Family Dwellings (A B C & D)
Number
Average Value
Number
Average Value
Number
Average Value
Number
Average Value
Number
Average Value
LOANS ORIGINATED
1
$225,850
13
$168,042
19
$217,413
14
$97,957
2
$148,375
APPLICATIONS APPROVED, NOT ACCEPTED
0
$0
2
$118,740
3
$155,090
1
$256,460
1
$106,540
APPLICATIONS DENIED
0
$0
2
$98,400
11
$133,442
4
$37,190
1
$201,450
APPLICATIONS WITHDRAWN
0
$0
1
$131,720
6
$171,488
2
$48,230
0
$0
FILES CLOSED FOR INCOMPLETENESS
0
$0
1
$172,010
3
$178,590
1
$150,700
0
$0
Aggregated Statistics For Year 2006 (Based on 2 partial tracts)
B) Conventional Home Purchase Loans
C) Refinancings
D) Home Improvement Loans
F) Non-occupant Loans on < 5 Family Dwellings (A B C & D)
G) Loans On Manufactured Home Dwelling (A B C & D)
Number
Average Value
Number
Average Value
Number
Average Value
Number
Average Value
Number
Average Value
LOANS ORIGINATED
14
$204,603
33
$144,078
12
$69,797
4
$175,008
0
$0
APPLICATIONS APPROVED, NOT ACCEPTED
1
$228,180
4
$131,328
1
$106,540
0
$0
0
$0
APPLICATIONS DENIED
4
$201,350
20
$156,762
4
$70,508
0
$0
1
$66,630
APPLICATIONS WITHDRAWN
2
$177,235
13
$140,775
2
$44,550
0
$0
0
$0
FILES CLOSED FOR INCOMPLETENESS
2
$158,255
6
$156,380
0
$0
0
$0
0
$0
Aggregated Statistics For Year 2005 (Based on 2 partial tracts)
B) Conventional Home Purchase Loans
C) Refinancings
D) Home Improvement Loans
F) Non-occupant Loans on < 5 Family Dwellings (A B C & D)
G) Loans On Manufactured Home Dwelling (A B C & D)
Number
Average Value
Number
Average Value
Number
Average Value
Number
Average Value
Number
Average Value
LOANS ORIGINATED
12
$234,183
27
$151,129
12
$91,943
3
$133,007
0
$0
APPLICATIONS APPROVED, NOT ACCEPTED
3
$158,317
3
$185,047
1
$87,170
0
$0
0
$0
APPLICATIONS DENIED
3
$113,897
20
$155,192
7
$116,829
1
$132,100
1
$66,630
APPLICATIONS WITHDRAWN
2
$238,640
18
$140,282
1
$31,380
2
$170,260
0
$0
FILES CLOSED FOR INCOMPLETENESS
2
$108,470
3
$171,617
0
$0
0
$0
0
$0
Aggregated Statistics For Year 2004 (Based on 2 partial tracts)
A) FHA, FSA/RHS & VA Home Purchase Loans
B) Conventional Home Purchase Loans
C) Refinancings
D) Home Improvement Loans
F) Non-occupant Loans on < 5 Family Dwellings (A B C & D)


 Nearest zip codes: 01026, 01339, 01330, 01338, 01270, 01032.
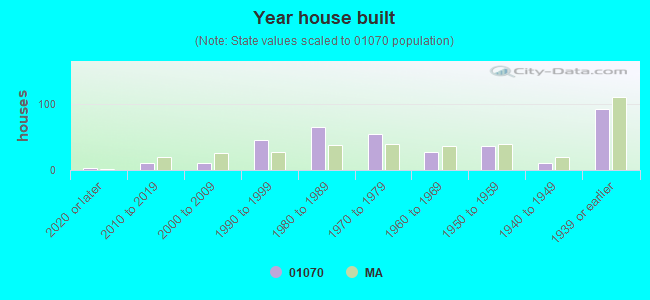


 : $29,004 in 2 contracts from 2003 to 2005