Estimated zip code population in 2022: 1,395 Zip code population in 2010: 1,438 Zip code population in 2000: 1,973
Houses and condos: 833 Renter-occupied apartments: 98
% of renters here:
15%
State:
38%
March 2022 cost of living index in zip code 01339: 88.2 (less than average, U.S. average is 100)
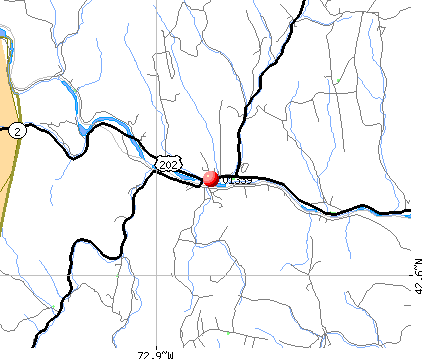
Land area: 55.0 sq. mi. Water area: 0.2 sq. mi.
Population density: 25 people per square mile
(very low).
OSM Map
Google Map
MSN Map
OSM Map
General Map
Google Map
MSN Map
OSM Map
Google Map
MSN Map
OSM Map
Google Map
MSN Map
Please wait while loading the map...
Real estate property taxes paid for housing units in 2022:
This zip code:
1.3% ($4,164)
Massachusetts:
1.0% ($5,536)
Median real estate property taxes paid for housing units with mortgages in 2022: $4,298 (1.3%) Median real estate property taxes paid for housing units with no mortgage in 2022: $4,018 (1.4%)
Business Search- 14 Million verified businesses
Males: 705
(50.5%)
Females: 690
(49.5%)
For population 25 years and over in 01339:
High school or higher: 94.2%
Bachelor's degree or higher: 36.2%
Graduate or professional degree: 14.2%
Unemployed: 4.8%
Mean travel time to work (commute): 32.7 minutes
For population 15 years and over in 01339:
Never married: 19.6%
Now married: 58.3%
Separated: 0.7%
Widowed: 10.6%
Divorced: 10.8%
Zip code 01339 compared to state average:
Median house value below state average.
Black race population percentage significantly below state average.
Hispanic race population percentage significantly below state average.
Median age significantly above state average.
Foreign-born population percentage significantly below state average.
Renting percentage significantly below state average.
Length of stay since moving in significantly above state average.
Number of college students significantly below state average.
Averages for the 2020 tax year for zip code 01339, filed in 2021:
Average Adjusted Gross Income (AGI) in 2020: $59,489 (Individual Income Tax Returns)
Here:
$59,489
State:
$105,130
Salary/wage: $48,464 (reported on 71.6% of returns)
Here:
$48,464
State:
$82,951
(% of AGI for various income ranges: 1143.1% for AGIs below $25k, 3465.7% for AGIs $25k-50k, 6022.9% for AGIs $50k-75k, 11233.3% for AGIs $75k-100k, 19603.3% for AGIs $100k-200k)
Taxable interest for individuals: $1,000 (reported on 39.2% of returns)
This zip code:
$1,000
Massachusetts:
$2,361
(% of AGI for various income ranges: 14.6% for AGIs below $25k, 12.1% for AGIs $25k-50k, 15.7% for AGIs $50k-75k, 106.7% for AGIs $75k-100k, 141.7% for AGIs $100k-200k)
Ordinary dividends: $9,617 (reported on 24.3% of returns)
Here:
$9,617
State:
$10,365
(% of AGI for various income ranges: 65.4% for AGIs below $25k, 63.6% for AGIs $25k-50k, 108.6% for AGIs $50k-75k, 676.7% for AGIs $75k-100k, 2130.0% for AGIs $100k-200k)
Net capital gain/loss in AGI: +$18,669 (reported on 17.6% of returns)
Here:
+$18,669
State:
+$48,178
(% of AGI for various income ranges: 112.1% for AGIs $25k-50k, 107.1% for AGIs $50k-75k, 3658.3% for AGIs $100k-200k)
Profit/loss from business: +$9,665 (reported on 23.0% of returns)
Here:
+$9,665
State:
+$20,792
(% of AGI for various income ranges: 266.2% for AGIs below $25k, 270.7% for AGIs $25k-50k, 597.1% for AGIs $50k-75k, 833.3% for AGIs $100k-200k)
Taxable individual retirement arrangement distribution: $11,900 (reported on 14.9% of returns)
01339:
$11,900
Massachusetts:
$22,790
(% of AGI for various income ranges: 304.6% for AGIs below $25k, 647.1% for AGIs $50k-75k, 766.7% for AGIs $100k-200k)
Total itemized deductions: $28,100 (reported on 6.8% of returns)
Here:
$28,100
State:
$36,722
(% of AGI for various income ranges: 403.1% for AGIs below $25k, 2936.7% for AGIs $75k-100k)
Charity contributions: $3,600 (reported on 2.7% of returns)
Here:
$3,600
State:
$12,529
(% of AGI for various income ranges: 102.9% for AGIs $50k-75k)
Taxes paid: $8,350 (reported on 5.4% of returns)
01339:
$8,350
State:
$8,782
(% of AGI for various income ranges: 97.7% for AGIs below $25k, 690.0% for AGIs $75k-100k)
Earned income credit: $1,744 (reported on 12.2% of returns)
Here:
$1,744
State:
$1,909
(% of AGI for various income ranges: 73.1% for AGIs below $25k, 44.3% for AGIs $25k-50k)
Percentage of individuals using paid preparers for their 2020 taxes: 90.5%
Here:
91%
State:
92%
(% for various income ranges: 82.6% for AGIs below $25k, 95.0% for AGIs $25k-50k, 100.0% for AGIs $50k-75k, 85.7% for AGIs $75k-100k, 90.0% for AGIs $100k-200k, 100.0% for AGIs over 200k)
Averages for the 2012 tax year for zip code 01339, filed in 2013:
Average Adjusted Gross Income (AGI) in 2012: $47,344 (Individual Income Tax Returns)
Here:
$47,344
State:
$81,425
Salary/wage: $36,719 (reported on 81.9% of returns)
Here:
$36,719
State:
$64,752
(% of AGI for various income ranges: 70.4% for AGIs below $25k, 71.7% for AGIs $25k-50k, 72.3% for AGIs $50k-75k, 64.2% for AGIs $75k-100k, 49.5% for AGIs $100k-200k)
Taxable interest for individuals: $704 (reported on 37.5% of returns)
This zip code:
$704
Massachusetts:
$2,136
(% of AGI for various income ranges: 0.5% for AGIs below $25k, 0.6% for AGIs $25k-50k, 0.5% for AGIs $50k-75k, 0.5% for AGIs $75k-100k, 0.6% for AGIs $100k-200k)
Ordinary dividends: $5,012 (reported on 23.6% of returns)
Here:
$5,012
State:
$9,473
(% of AGI for various income ranges: 0.8% for AGIs below $25k, 2.6% for AGIs $25k-50k, 1.0% for AGIs $50k-75k, 1.1% for AGIs $75k-100k, 5.0% for AGIs $100k-200k)
Net capital gain/loss in AGI: +$9,482 (reported on 15.3% of returns)
Here:
+$9,482
State:
+$31,437
(% of AGI for various income ranges: 0.1% for AGIs below $25k, 0.5% for AGIs $25k-50k, 9.9% for AGIs $100k-200k)
Profit/loss from business: +$15,283 (reported on 16.7% of returns)
Here:
+$15,283
State:
+$20,662
(% of AGI for various income ranges: 11.4% for AGIs below $25k, 3.8% for AGIs $25k-50k, 6.1% for AGIs $50k-75k, 11.7% for AGIs $75k-100k)
Taxable individual retirement arrangement distribution: $8,550 (reported on 11.1% of returns)
01339:
$8,550
Massachusetts:
$18,892
(% of AGI for various income ranges: 2.3% for AGIs below $25k, 5.8% for AGIs $25k-50k, 4.2% for AGIs $75k-100k)
Total itemized deductions: $17,986 (22% of AGI, reported on 30.6% of returns)
Here:
$17,986
State:
$28,907
Here:
21.8% of AGI
State:
18.2% of AGI
(% of AGI for various income ranges: 8.4% for AGIs below $25k, 10.6% for AGIs $25k-50k, 10.9% for AGIs $50k-75k, 13.4% for AGIs $75k-100k, 12.8% for AGIs $100k-200k)
Charity contributions: $2,069 (reported on 22.2% of returns)
Here:
$2,069
State:
$4,208
(% of AGI for various income ranges: 0.6% for AGIs $25k-50k, 0.8% for AGIs $50k-75k, 1.4% for AGIs $75k-100k, 1.4% for AGIs $100k-200k)
Taxes paid: $7,768 (reported on 30.6% of returns)
01339:
$7,768
State:
$13,303
(% of AGI for various income ranges: 3.1% for AGIs below $25k, 3.6% for AGIs $25k-50k, 4.6% for AGIs $50k-75k, 6.3% for AGIs $75k-100k, 6.0% for AGIs $100k-200k)
Earned income credit: $2,108 (reported on 16.7% of returns)
Here:
$2,108
State:
$1,971
(% of AGI for various income ranges: 5.5% for AGIs below $25k, 0.9% for AGIs $25k-50k)
Percentage of individuals using paid preparers for their 2012 taxes: 59.7%
Here:
60%
State:
56%
(% for various income ranges: 55.2% for AGIs below $25k, 52.9% for AGIs $25k-50k, 69.2% for AGIs $50k-75k, 57.1% for AGIs $75k-100k, 83.3% for AGIs $100k-200k)
Averages for the 2004 tax year for zip code 01339, filed in 2005:
Average Adjusted Gross Income (AGI) in 2004: $36,185 (Individual Income Tax Returns)
Here:
$36,185
State:
$62,877
Salary/wage: $31,304 (reported on 83.6% of returns)
Here:
$31,304
State:
$52,969
(% of AGI for various income ranges: 88.8% for AGIs below $10k, 72.5% for AGIs $10k-25k, 77.4% for AGIs $25k-50k, 81.6% for AGIs $50k-75k, 68.5% for AGIs $75k-100k, 51.0% for AGIs over 100k)
Taxable interest for individuals: $989 (reported on 45.7% of returns)
This zip code:
$989
Massachusetts:
$1,945
(% of AGI for various income ranges: 5.8% for AGIs below $10k, 1.7% for AGIs $10k-25k, 1.3% for AGIs $25k-50k, 1.0% for AGIs $50k-75k, 1.2% for AGIs $75k-100k, 0.7% for AGIs over 100k)
Taxable dividends: $2,751 (reported on 24.4% of returns)
Here:
$2,751
State:
$5,323
(% of AGI for various income ranges: 7.0% for AGIs below $10k, 1.2% for AGIs $10k-25k, 0.9% for AGIs $25k-50k, 2.8% for AGIs $50k-75k, 1.5% for AGIs $75k-100k, 1.7% for AGIs over 100k)
Net capital gain/loss: +$2,225 (reported on 17.8% of returns)
Here:
+$2,225
State:
+$20,377
(% of AGI for various income ranges: -0.1% for AGIs below $10k, 0.0% for AGIs $10k-25k, 0.5% for AGIs $25k-50k, -0.3% for AGIs $50k-75k, 4.8% for AGIs $75k-100k, 1.2% for AGIs over 100k)
Profit/loss from business: +$10,347 (reported on 22.3% of returns)
Here:
+$10,347
State:
+$17,837
(% of AGI for various income ranges: 16.9% for AGIs below $10k, 10.2% for AGIs $10k-25k, 7.0% for AGIs $25k-50k, 4.4% for AGIs $50k-75k, 10.7% for AGIs $75k-100k)
IRA payment deduction: $3,512 (reported on 5.3% of returns)
01339:
$3,512
Massachusetts:
$3,100
Total itemized deductions: $15,407 (24% of AGI, reported on 31.7% of returns)
Here:
$15,407
State:
$22,573
Here:
24.0% of AGI
State:
19.5% of AGI
(% of AGI for various income ranges: 17.6% for AGIs below $10k, 7.6% for AGIs $10k-25k, 12.9% for AGIs $25k-50k, 14.1% for AGIs $50k-75k, 15.0% for AGIs $75k-100k, 15.6% for AGIs over 100k)
Charity contributions deductions: $1,742 (3% of AGI, reported on 25.5% of returns)
Here:
$1,742
State:
$3,295
Here:
2.5% of AGI
State:
2.7% of AGI
(% of AGI for various income ranges: 0.8% for AGIs $10k-25k, 1.0% for AGIs $25k-50k, 1.2% for AGIs $50k-75k, 1.3% for AGIs $75k-100k, 2.0% for AGIs over 100k)
Total tax: $4,545 (reported on 78.1% of returns)
01339:
$4,545
State:
$11,494
(% of AGI for various income ranges: 4.4% for AGIs below $10k, 5.6% for AGIs $10k-25k, 7.6% for AGIs $25k-50k, 9.0% for AGIs $50k-75k, 11.1% for AGIs $75k-100k, 16.9% for AGIs over 100k)
Earned income credit: $1,347 (reported on 15.6% of returns)
Here:
$1,347
State:
$1,518
Percentage of individuals using paid preparers for their 2004 taxes: 56.6%
Here:
57%
State:
58%
(% for various income ranges: 45.9% for AGIs below $10k, 60.1% for AGIs $10k-25k, 56.0% for AGIs $25k-50k, 53.6% for AGIs $50k-75k, 70.2% for AGIs $75k-100k, 90.0% for AGIs over 100k)
Household received Food Stamps/SNAP in the past 12 months: 54 Household did not receive Food Stamps/SNAP in the past 12 months: 583
Women who had a birth in the past 12 months: 8 (6 now married, 2 unmarried) Women who did not have a birth in the past 12 months: 177 (108 now married, 67 unmarried)
Housing units in zip code 01339 with a mortgage: 248 (22 second mortgage, 21 both second mortgage and home equity loan) Houses without a mortgage: 57
Median monthly owner costs for units with a mortgage: $1,646 Median monthly owner costs for units without a mortgage: $808
Residents with income below the poverty level in 2022:
This zip code:
9.6%
Whole state:
10.4%
Residents with income below 50% of the poverty level in 2022:
This zip code:
6.3%
Whole state:
5.1%
Median number of rooms in houses and condos:
Here:
6.4
State:
6.5
Median number of rooms in apartments:
Here:
4.8
State:
4.0
Notable locations in this zip code not listed on our city pages
Lakes, reservoirs, and swamps: Beaver Pond (A), North Pond Brook (B), Cox Pond (C), Nemasket River Reservoir (D), Mill Brook Reservoir (E), Cranberry Swamp (F). Display/hide their locations on the map
Streams, rivers, and creeks: Davis Mine Brook (A), Albee Brook (B), Trout Brook (C), Tatro Brook (D), Rice Brook (E), Potash Brook (F), Patch Brook (G), North Brook (H), Legate Hill Brook (I). Display/hide their locations on the map
In group quarters: 43 (-1 institutionalized population)
Size of family households: 229 2-persons, 88 3-persons, 40 4-persons, 17 5-persons, 7 7-or-more-persons
Size of nonfamily households: 221 1-person, 42 2-persons, 2 3-persons
124 married couples with children.
16 single-parent households (10 men, 6 women).
97.6% of residents of 01339 zip code speak English at home.
0.7% of residents speak other Indo-European language at home (100% very well).
2.0% of residents speak Asian or Pacific Island language at home (19% very well, 26% well, 56% not well).
Foreign born population: 42 (3.1%) (43.3% of them are naturalized citizens)
This zip code:
3.1%
Whole state:
18.0%
30%Malaysia
9%Denmark
9%Sweden
9%United Kingdom, excluding England and Scotland
7%Thailand
21%English
18%Irish
12%Italian
8%German
7%European
7%French
7%American
Year of entry for the foreign-born population
292010 or later
12000 to 2009
01990 to 1999
14Before 1990
Facilities with environmental interests located in this zip code:
CHARLEMONT SEWER DISTRICT WWTP (20 FACTORY ROAD in CHARLEMONT, MA)
National Pollutant Discharge Elimination System NON-MAJOR (Tracking pollutant discharge elimination systems) - permit - ICIS-, ENFORCEMENT/COMPLIANCE ACTIVITY Business SIC classification: SEWERAGE SYSTEMS Alternative names: CHARLEMONT SEWER DISTRICT WWPT
HAWLEMONT REG (SCHOOL STREET in CHARLEMONT, MA)
(National Center for Education Statistics) - STATE ID-685005
CHARLEMONT (MAIN STREET in CHARLEMONT, MA)
AIR MINOR (AIRS/AFS) COMPLIANCE ACTIVITY (Tracking inspections of insecticide, fungicide, and rodenticide, and toxic substances) Business SIC classification: GENERAL GOVERNMENT Alternative names: The Academy at Charlemont
TATRO TRUCKING (RTE 2 HEALTH STAGE in CHARLEMONT, MA)
Conditionally Exempt Small Quantity Generators, less than 100 kg/month of hazardous waste (Resource Conservation and Recovery Act (tracking hazardous waste)) - notification Organizations: NORMAN TATRO (CONTACT/OWNER)
HAWLEY (PUDDING HOLLOW ROAD in HAWLEY, MA)
AIR MINOR (AIRS/AFS) Business SIC classification: GENERAL GOVERNMENT
Housing units lacking complete plumbing facilities: 3.9% Housing units lacking complete kitchen facilities: 3.8%
45.3%Fuel oil, kerosene, etc.
25.7%Wood
20.9%Bottled, tank, or LP gas
3.5%Other fuel
3.3%Utility gas
1.0%Electricity
0.8%Solar energy
Population in 1990: 1,325. Population change in the 1990s: +648 (+48.9%).
Place of birth for U.S.-born residents:
This state: 915
Northeast: 280
Midwest: 96
South: 29
West: 22
71% of the 01339 zip code residents lived in the same house 5 years ago. Out of people who lived in different houses, 66% lived in this county. Out of people who lived in different counties, 50% lived in Massachusetts.
95% of the 01339 zip code residents lived in the same house 1 year ago. Out of people who lived in different houses, 19% moved from this county. Out of people who lived in different houses, 22% moved from different county within same state. Out of people who lived in different houses, 66% moved from different state.
Private vs. public school enrollment:
Students in private schools in grades 1 to 8 (elementary and middle school): 8
Here:
12.4%
Massachusetts:
10.3%
Students in private schools in grades 9 to 12 (high school): 19
Here:
39.1%
Massachusetts:
12.3%
Students in private undergraduate colleges:
Here:
0.0%
Massachusetts:
51.2%
Occupation by median earnings in the past 12 months ($)
191,262Transportation occupations
75,107Life, physical, and social science occupations
65,616Installation, maintenance, and repair occupations
65,422Health diagnosing and treating practitioners and other technical occupations
59,615Legal occupations
59,316Production occupations
Companies with federal contracts located in this zip code:
ZOAR OUTDOOR ADVENTURE RESORT, (7 MAIN STREET in CHARLEMONT, MA; small business)
$6,029 with Army for Civilian Personnel Recruitment. Signed on 2005-06-17. Completion date: 2005-07-13.
Top industries in this zip code by the number of employees in 2005:
Arts, Entertainment, and Recreation: Skiing Facilities (100-249 employees: 1 establishment)
Accommodation and Food Services: Full-Service Restaurants (20-49: 2, 1-4: 1)
Educational Services: Elementary and Secondary Schools (20-49: 1)
Arts, Entertainment, and Recreation: All Other Amusement and Recreation Industries (10-19: 1)
Health Care and Social Assistance: Offices of Physicians (except Mental Health Specialists) (10-19: 1)
Accommodation and Food Services: Hotels (except Casino Hotels) and Motels (10-19: 1)
Other Services (except Public Administration): Appliance Repair and Maintenance (5-9: 1)
People in group quarters in 2010:
26 people in workers' group living quarters and job corps centers
2 people in other noninstitutional facilities
People in group quarters in 2000:
23 people in other nonhousehold living situations
15 people in agriculture workers' dormitories on farms
Home Mortgage Disclosure Act Aggregated Statistics For Year 2009 (Based on 2 partial tracts)
A) FHA, FSA/RHS & VA Home Purchase Loans
B) Conventional Home Purchase Loans
C) Refinancings
D) Home Improvement Loans
F) Non-occupant Loans on < 5 Family Dwellings (A B C & D)
G) Loans On Manufactured Home Dwelling (A B C & D)
Number
Average Value
Number
Average Value
Number
Average Value
Number
Average Value
Number
Average Value
Number
Average Value
LOANS ORIGINATED
3
$124,910
16
$159,418
80
$161,010
13
$104,835
7
$211,970
0
$0
APPLICATIONS APPROVED, NOT ACCEPTED
0
$0
3
$317,973
6
$171,717
2
$71,605
2
$325,800
0
$0
APPLICATIONS DENIED
1
$145,590
2
$99,850
25
$175,573
7
$72,740
2
$84,730
2
$66,435
APPLICATIONS WITHDRAWN
0
$0
3
$250,613
20
$174,992
0
$0
3
$240,800
0
$0
FILES CLOSED FOR INCOMPLETENESS
0
$0
0
$0
8
$208,646
1
$23,870
0
$0
0
$0
Aggregated Statistics For Year 2008 (Based on 2 partial tracts)
A) FHA, FSA/RHS & VA Home Purchase Loans
B) Conventional Home Purchase Loans
C) Refinancings
D) Home Improvement Loans
F) Non-occupant Loans on < 5 Family Dwellings (A B C & D)
G) Loans On Manufactured Home Dwelling (A B C & D)
Number
Average Value
Number
Average Value
Number
Average Value
Number
Average Value
Number
Average Value
Number
Average Value
LOANS ORIGINATED
6
$127,297
24
$173,175
54
$130,213
24
$71,339
11
$140,821
1
$53,310
APPLICATIONS APPROVED, NOT ACCEPTED
2
$105,815
2
$155,940
5
$102,314
2
$143,210
1
$88,310
1
$32,620
APPLICATIONS DENIED
2
$129,285
2
$75,580
28
$179,493
12
$98,986
3
$180,600
2
$37,395
APPLICATIONS WITHDRAWN
0
$0
0
$0
12
$158,788
2
$150,765
1
$198,900
0
$0
FILES CLOSED FOR INCOMPLETENESS
0
$0
0
$0
2
$141,220
2
$7,955
0
$0
0
$0
Aggregated Statistics For Year 2007 (Based on 2 partial tracts)
A) FHA, FSA/RHS & VA Home Purchase Loans
B) Conventional Home Purchase Loans
C) Refinancings
D) Home Improvement Loans
F) Non-occupant Loans on < 5 Family Dwellings (A B C & D)
G) Loans On Manufactured Home Dwelling (A B C & D)
Number
Average Value
Number
Average Value
Number
Average Value
Number
Average Value
Number
Average Value
Number
Average Value
LOANS ORIGINATED
2
$210,040
31
$163,432
67
$124,232
24
$63,250
11
$153,768
3
$115,893
APPLICATIONS APPROVED, NOT ACCEPTED
1
$171,850
1
$186,970
8
$183,286
3
$60,467
0
$0
0
$0
APPLICATIONS DENIED
0
$0
7
$180,033
50
$126,341
10
$67,228
4
$109,792
2
$37,790
APPLICATIONS WITHDRAWN
0
$0
3
$184,313
16
$166,629
0
$0
1
$318,240
2
$42,565
FILES CLOSED FOR INCOMPLETENESS
0
$0
1
$206,860
6
$258,968
0
$0
1
$102,630
0
$0
Aggregated Statistics For Year 2006 (Based on 2 partial tracts)
A) FHA, FSA/RHS & VA Home Purchase Loans
B) Conventional Home Purchase Loans
C) Refinancings
D) Home Improvement Loans
E) Loans on Dwellings For 5+ Families
F) Non-occupant Loans on < 5 Family Dwellings (A B C & D)
G) Loans On Manufactured Home Dwelling (A B C & D)
Number
Average Value
Number
Average Value
Number
Average Value
Number
Average Value
Number
Average Value
Number
Average Value
Number
Average Value
LOANS ORIGINATED
3
$162,833
37
$161,378
76
$122,020
29
$66,995
2
$107,405
14
$149,232
2
$26,655
APPLICATIONS APPROVED, NOT ACCEPTED
0
$0
10
$117,192
22
$140,857
2
$132,865
0
$0
4
$102,632
0
$0
APPLICATIONS DENIED
1
$189,350
12
$163,032
59
$155,951
22
$96,376
0
$0
2
$142,015
6
$51,183
APPLICATIONS WITHDRAWN
0
$0
5
$123,796
36
$179,364
3
$80,887
0
$0
2
$42,565
0
$0
FILES CLOSED FOR INCOMPLETENESS
0
$0
2
$521,120
14
$171,281
0
$0
0
$0
1
$47,740
0
$0
Aggregated Statistics For Year 2005 (Based on 2 partial tracts)
A) FHA, FSA/RHS & VA Home Purchase Loans
B) Conventional Home Purchase Loans
C) Refinancings
D) Home Improvement Loans
F) Non-occupant Loans on < 5 Family Dwellings (A B C & D)
G) Loans On Manufactured Home Dwelling (A B C & D)
Number
Average Value
Number
Average Value
Number
Average Value
Number
Average Value
Number
Average Value
Number
Average Value
LOANS ORIGINATED
2
$140,025
35
$157,233
104
$127,296
31
$76,326
9
$189,441
2
$52,510
APPLICATIONS APPROVED, NOT ACCEPTED
0
$0
6
$134,722
14
$131,217
4
$47,735
3
$150,103
0
$0
APPLICATIONS DENIED
0
$0
6
$144,003
67
$116,205
14
$100,984
2
$50,920
2
$51,715
APPLICATIONS WITHDRAWN
0
$0
11
$120,280
54
$149,573
4
$147,385
4
$189,950
2
$107,805
FILES CLOSED FOR INCOMPLETENESS
0
$0
5
$90,062
7
$129,229
1
$7,960
1
$144,800
0
$0
Aggregated Statistics For Year 2004 (Based on 2 partial tracts)
A) FHA, FSA/RHS & VA Home Purchase Loans
B) Conventional Home Purchase Loans
C) Refinancings
D) Home Improvement Loans
E) Loans on Dwellings For 5+ Families
F) Non-occupant Loans on < 5 Family Dwellings (A B C & D)
G) Loans On Manufactured Home Dwelling (A B C & D)
Detailed PMIC statistics for the following Tracts:0401.00
2002 - 2018 National Fire Incident Reporting System (NFIRS) incidents
Based on the data from the years 2002 - 2018 the average number of fires per year is 19. The highest number of fires - 39 took place in 2007, and the least - 7 in 2012. The data has a dropping trend.
When looking into fire subcategories, the most incidents belonged to: Structure Fires (56.9%), and Outside Fires (28.6%).
Fire incident types reported to NFIRS in Zip Code 01339


 Nearest zip codes: 01338, 01070, 01367, 01343, 01346, 01330.


 Based on the data from the years 2002 - 2018 the average number of fires per year is 19. The highest number of fires - 39 took place in 2007, and the least - 7 in 2012. The data has a dropping trend.
 When looking into fire subcategories, the most incidents belonged to: Structure Fires (56.9%), and Outside Fires (28.6%).