Estimated zip code population in 2022: 817 Zip code population in 2010: 731 Zip code population in 2000: 692
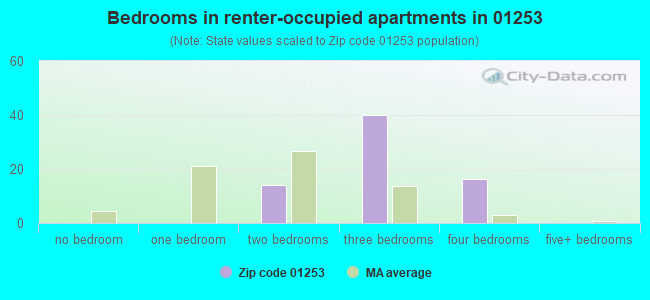
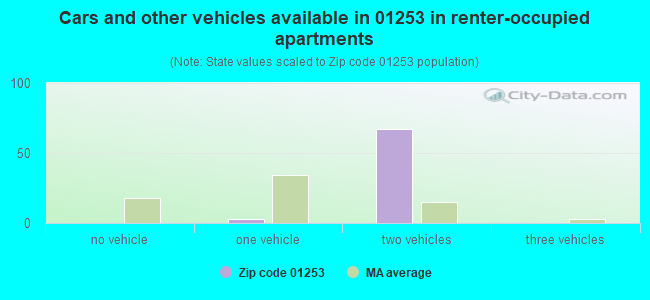
Houses and condos: 650 Renter-occupied apartments: 69
% of renters here:
18%
State:
38%
March 2022 cost of living index in zip code 01253: 81.6 (low, U.S. average is 100)
Land area: 18.3 sq. mi. Water area: 0.4 sq. mi.
Population density: 45 people per square mile
(very low).
OSM Map
Google Map
MSN Map
OSM Map
General Map
Google Map
MSN Map
OSM Map
Google Map
MSN Map
OSM Map
Google Map
MSN Map
Please wait while loading the map...
Real estate property taxes paid for housing units in 2022:
This zip code:
0.6% ($1,982)
Massachusetts:
1.0% ($5,536)
Median real estate property taxes paid for housing units with mortgages in 2022: $1,800 (0.6%) Median real estate property taxes paid for housing units with no mortgage in 2022: $2,498 (0.7%)
Business Search- 14 Million verified businesses
Males: 393
(48.1%)
Females: 424
(51.9%)
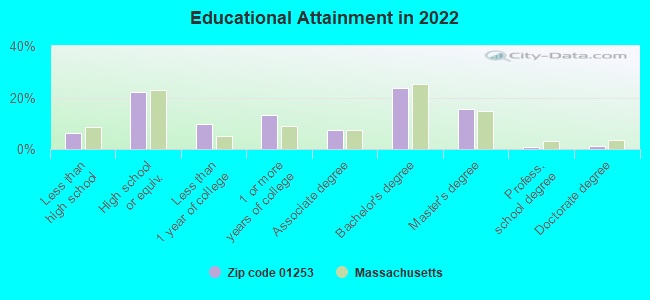
For population 25 years and over in 01253:
High school or higher: 93.2%
Bachelor's degree or higher: 41.0%
Graduate or professional degree: 17.6%
Unemployed: 7.6%
Mean travel time to work (commute): 32.6 minutes
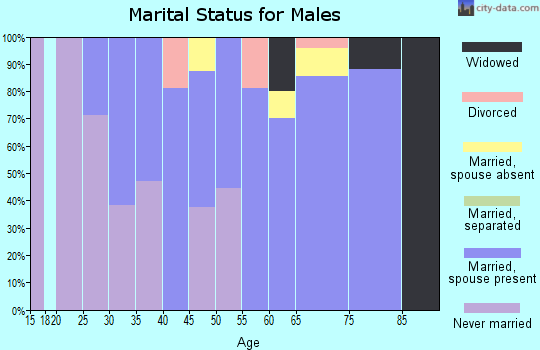
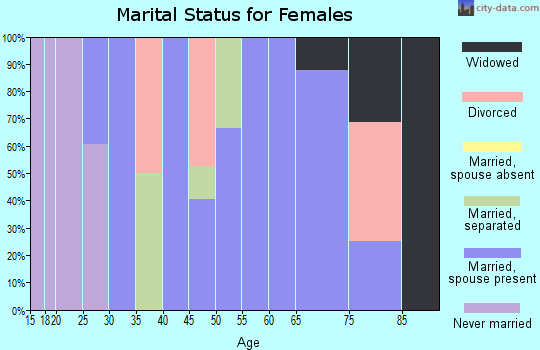
For population 15 years and over in 01253:
Never married: 29.3%
Now married: 59.7%
Separated: 2.3%
Widowed: 5.4%
Divorced: 3.3%
Zip code 01253 compared to state average:
Median house value below state average.
Unemployed percentage above state average.
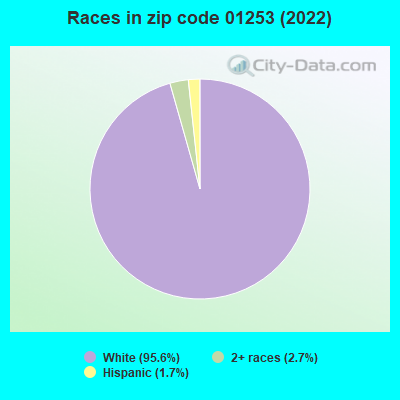
Black race population percentage significantly below state average.
Hispanic race population percentage significantly below state average.
Median age significantly above state average.
Foreign-born population percentage significantly below state average.
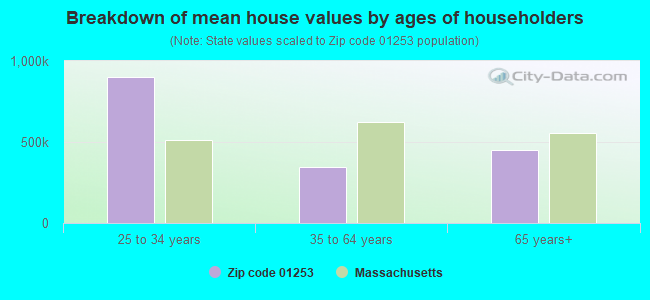
Estimated median house/condo value in 2022: $348,400
01253:
$348,400
Massachusetts:
$534,700
According to our research of Massachusetts and other state lists, there were 3 registered sex offenders living in 01253 zip code as of April 29, 2024. The ratio of all residents to sex offenders in zip code 01253 is 248 to 1.
Median resident age:
This zip code:
53.7 years
Massachusetts median age:
40.3 years
Average household size:
This zip code:
2.1 people
Massachusetts:
2.4 people
Averages for the 2020 tax year for zip code 01253, filed in 2021:
Average Adjusted Gross Income (AGI) in 2020: $80,243 (Individual Income Tax Returns)
Here:
$80,243
State:
$105,130
Salary/wage: $67,076 (reported on 72.3% of returns)
Here:
$67,076
State:
$82,951
(% of AGI for various income ranges: 1274.0% for AGIs below $25k, 3271.2% for AGIs $25k-50k, 7412.5% for AGIs $50k-75k, 8883.3% for AGIs $75k-100k, 11948.3% for AGIs $100k-200k)
Taxable interest for individuals: $674 (reported on 40.4% of returns)
This zip code:
$674
Massachusetts:
$2,361
(% of AGI for various income ranges: 10.0% for AGIs below $25k, 7.5% for AGIs $25k-50k, 60.0% for AGIs $50k-75k, 70.0% for AGIs $75k-100k, 90.0% for AGIs $100k-200k)
Ordinary dividends: $5,585 (reported on 27.7% of returns)
Here:
$5,585
State:
$10,365
(% of AGI for various income ranges: 46.2% for AGIs $25k-50k, 267.5% for AGIs $50k-75k, 511.7% for AGIs $100k-200k)
Net capital gain/loss in AGI: +$15,590 (reported on 21.3% of returns)
Here:
+$15,590
State:
+$48,178
(% of AGI for various income ranges: 2.0% for AGIs below $25k, 337.5% for AGIs $50k-75k, 1530.0% for AGIs $100k-200k)
Profit/loss from business: +$19,918 (reported on 23.4% of returns)
Here:
+$19,918
State:
+$20,792
(% of AGI for various income ranges: 278.0% for AGIs below $25k, 338.8% for AGIs $25k-50k, 1287.5% for AGIs $50k-75k, 2110.0% for AGIs $100k-200k)
Taxable individual retirement arrangement distribution: $20,217 (reported on 12.8% of returns)
01253:
$20,217
Massachusetts:
$22,790
(% of AGI for various income ranges: 304.0% for AGIs below $25k, 760.0% for AGIs $50k-75k, 1261.7% for AGIs $100k-200k)
Total itemized deductions: $35,525 (reported on 8.5% of returns)
Here:
$35,525
State:
$36,722
(% of AGI for various income ranges: )
Charity contributions: $8,133 (reported on 6.4% of returns)
Here:
$8,133
State:
$12,529
(% of AGI for various income ranges: 406.7% for AGIs $100k-200k)
Taxes paid: $9,000 (reported on 8.5% of returns)
01253:
$9,000
State:
$8,782
(% of AGI for various income ranges: )
Earned income credit: $1,240 (reported on 10.6% of returns)
Here:
$1,240
State:
$1,909
(% of AGI for various income ranges: 124.0% for AGIs below $25k)
Percentage of individuals using paid preparers for their 2020 taxes: 91.5%
Here:
91%
State:
92%
(% for various income ranges: 90.9% for AGIs below $25k, 90.9% for AGIs $25k-50k, 100.0% for AGIs $50k-75k, 100.0% for AGIs $75k-100k, 88.9% for AGIs $100k-200k, 75.0% for AGIs over 200k)
Averages for the 2012 tax year for zip code 01253, filed in 2013:
Average Adjusted Gross Income (AGI) in 2012: $52,058 (Individual Income Tax Returns)
Here:
$52,058
State:
$81,425
Salary/wage: $42,056 (reported on 75.6% of returns)
Here:
$42,056
State:
$64,752
(% of AGI for various income ranges: 63.6% for AGIs below $25k, 61.4% for AGIs $25k-50k, 70.0% for AGIs $50k-75k, 70.5% for AGIs $75k-100k, 52.6% for AGIs $100k-200k)
Taxable interest for individuals: $1,058 (reported on 42.2% of returns)
This zip code:
$1,058
Massachusetts:
$2,136
(% of AGI for various income ranges: 1.3% for AGIs below $25k, 0.9% for AGIs $25k-50k, 0.6% for AGIs $50k-75k, 0.5% for AGIs $75k-100k, 1.0% for AGIs $100k-200k)
Ordinary dividends: $5,592 (reported on 26.7% of returns)
Here:
$5,592
State:
$9,473
(% of AGI for various income ranges: 1.0% for AGIs below $25k, 1.4% for AGIs $25k-50k, 2.4% for AGIs $50k-75k, 5.1% for AGIs $100k-200k)
Net capital gain/loss in AGI: +$3,414 (reported on 15.6% of returns)
Here:
+$3,414
State:
+$31,437
(% of AGI for various income ranges: 2.9% for AGIs $100k-200k)
Profit/loss from business: +$13,958 (reported on 26.7% of returns)
Here:
+$13,958
State:
+$20,662
(% of AGI for various income ranges: 17.1% for AGIs below $25k, 22.3% for AGIs $25k-50k, 13.7% for AGIs $75k-100k)
Taxable individual retirement arrangement distribution: $11,900 (reported on 15.6% of returns)
01253:
$11,900
Massachusetts:
$18,892
Total itemized deductions: $21,665 (26% of AGI, reported on 37.8% of returns)
Here:
$21,665
State:
$28,907
Here:
26.1% of AGI
State:
18.2% of AGI
(% of AGI for various income ranges: 13.8% for AGIs below $25k, 11.0% for AGIs $25k-50k, 14.2% for AGIs $50k-75k, 18.4% for AGIs $75k-100k, 17.8% for AGIs $100k-200k)
Charity contributions: $2,717 (reported on 26.7% of returns)
Here:
$2,717
State:
$4,208
(% of AGI for various income ranges: 0.8% for AGIs below $25k, 0.7% for AGIs $50k-75k, 1.0% for AGIs $75k-100k, 2.6% for AGIs $100k-200k)
Taxes paid: $7,212 (reported on 37.8% of returns)
01253:
$7,212
State:
$13,303
(% of AGI for various income ranges: 2.8% for AGIs below $25k, 3.5% for AGIs $25k-50k, 4.3% for AGIs $50k-75k, 5.8% for AGIs $75k-100k, 6.7% for AGIs $100k-200k)
Earned income credit: $1,400 (reported on 13.3% of returns)
Here:
$1,400
State:
$1,971
(% of AGI for various income ranges: 4.1% for AGIs below $25k)
Percentage of individuals using paid preparers for their 2012 taxes: 68.9%
Here:
69%
State:
56%
(% for various income ranges: 64.7% for AGIs below $25k, 63.6% for AGIs $25k-50k, 71.4% for AGIs $50k-75k, 75.0% for AGIs $75k-100k, 83.3% for AGIs $100k-200k)
Averages for the 2004 tax year for zip code 01253, filed in 2005:
Average Adjusted Gross Income (AGI) in 2004: $44,413 (Individual Income Tax Returns)
Here:
$44,413
State:
$62,877
Salary/wage: $37,701 (reported on 80.0% of returns)
Here:
$37,701
State:
$52,969
(% of AGI for various income ranges: 155.9% for AGIs below $10k, 66.8% for AGIs $10k-25k, 77.2% for AGIs $25k-50k, 81.6% for AGIs $50k-75k, 59.5% for AGIs $75k-100k, 51.2% for AGIs over 100k)
Taxable interest for individuals: $1,085 (reported on 57.7% of returns)
This zip code:
$1,085
Massachusetts:
$1,945
(% of AGI for various income ranges: 19.1% for AGIs below $10k, 2.4% for AGIs $10k-25k, 1.5% for AGIs $25k-50k, 0.6% for AGIs $50k-75k, 1.4% for AGIs $75k-100k, 1.0% for AGIs over 100k)
Taxable dividends: $2,208 (reported on 28.2% of returns)
Here:
$2,208
State:
$5,323
(% of AGI for various income ranges: 3.9% for AGIs below $10k, 1.3% for AGIs $10k-25k, 0.5% for AGIs $25k-50k, 1.2% for AGIs $50k-75k, 3.4% for AGIs $75k-100k, 0.7% for AGIs over 100k)
Net capital gain/loss: +$9,167 (reported on 22.5% of returns)
Here:
+$9,167
State:
+$20,377
(% of AGI for various income ranges: 5.9% for AGIs below $10k, -0.6% for AGIs $10k-25k, 0.5% for AGIs $25k-50k, 0.7% for AGIs $50k-75k, -0.1% for AGIs $75k-100k, 16.4% for AGIs over 100k)
Profit/loss from business: +$9,520 (reported on 23.0% of returns)
Here:
+$9,520
State:
+$17,837
(% of AGI for various income ranges: -27.0% for AGIs below $10k, 9.8% for AGIs $10k-25k, 10.3% for AGIs $25k-50k, 2.8% for AGIs $50k-75k, 8.7% for AGIs $75k-100k)
IRA payment deduction: $3,417 (reported on 2.8% of returns)
01253:
$3,417
Massachusetts:
$3,100
Total itemized deductions: $16,061 (24% of AGI, reported on 34.5% of returns)
Here:
$16,061
State:
$22,573
Here:
23.6% of AGI
State:
19.5% of AGI
(% of AGI for various income ranges: 11.3% for AGIs $10k-25k, 13.9% for AGIs $25k-50k, 15.8% for AGIs $50k-75k, 10.7% for AGIs $75k-100k, 10.5% for AGIs over 100k)
Charity contributions deductions: $2,241 (3% of AGI, reported on 31.2% of returns)
Here:
$2,241
State:
$3,295
Here:
3.2% of AGI
State:
2.7% of AGI
(% of AGI for various income ranges: 2.9% for AGIs below $10k, 1.3% for AGIs $25k-50k, 1.4% for AGIs $50k-75k, 1.7% for AGIs $75k-100k, 2.3% for AGIs over 100k)
Total tax: $5,823 (reported on 83.3% of returns)
01253:
$5,823
State:
$11,494
(% of AGI for various income ranges: 6.4% for AGIs below $10k, 5.1% for AGIs $10k-25k, 8.0% for AGIs $25k-50k, 8.4% for AGIs $50k-75k, 12.8% for AGIs $75k-100k, 16.0% for AGIs over 100k)
Earned income credit: $1,214 (reported on 9.9% of returns)
Here:
$1,214
State:
$1,518
Percentage of individuals using paid preparers for their 2004 taxes: 62.9%
Here:
63%
State:
58%
(% for various income ranges: 55.4% for AGIs below $10k, 52.3% for AGIs $10k-25k, 61.1% for AGIs $25k-50k, 77.3% for AGIs $50k-75k, 69.0% for AGIs $75k-100k, 76.7% for AGIs over 100k)
Household received Food Stamps/SNAP in the past 12 months: 20 Household did not receive Food Stamps/SNAP in the past 12 months: 356
Women who had a birth in the past 12 months: 11 (6 now married, 5 unmarried) Women who did not have a birth in the past 12 months: 140 (43 now married, 97 unmarried)
Housing units in zip code 01253 with a mortgage: 161 (30 second mortgage, 24 both second mortgage and home equity loan) Median monthly owner costs for units with a mortgage: $1,688 Median monthly owner costs for units without a mortgage: $628
Residents with income below the poverty level in 2022:
This zip code:
2.3%
Whole state:
10.4%
Residents with income below 50% of the poverty level in 2022:
This zip code:
1.7%
Whole state:
5.1%
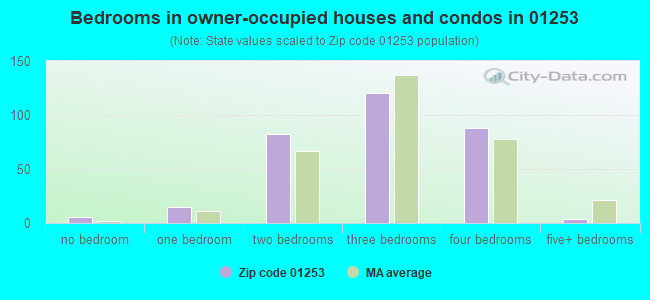
Median number of rooms in houses and condos:
Here:
6.1
State:
6.5
Median number of rooms in apartments:
Here:
7.5
State:
4.0
Notable locations in this zip code not listed on our city pages
Notable locations in zip code 01253: Otis Ridge Ski Area (A), Otis Fire Department (B), Otis Public Library (C), Otis Town Hall (D). Display/hide their locations on the map
Size of family households: 155 2-persons, 53 3-persons, 21 4-persons, 5 5-persons
Size of nonfamily households: 94 1-person, 57 2-persons
40 married couples with children.
11 single-parent households (11 women).
97.9% of residents of 01253 zip code speak English at home.
0.4% of residents speak Spanish at home (100% very well).
1.5% of residents speak other Indo-European language at home (50% very well, 50% well).
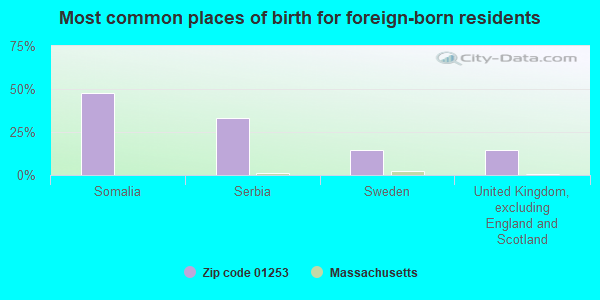
Foreign born population: 21 (2.6%) (81.3% of them are naturalized citizens)
This zip code:
2.6%
Whole state:
18.0%
48%Somalia
33%Serbia
14%Sweden
14%United Kingdom, excluding England and Scotland
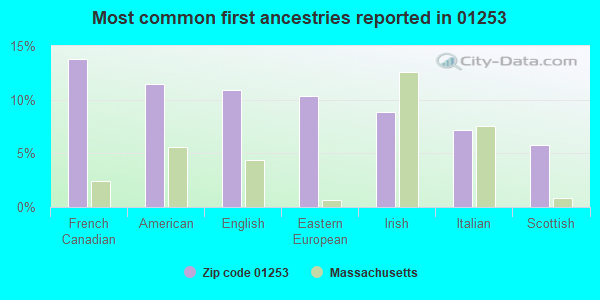
14%French Canadian
11%American
11%English
10%Eastern European
9%Irish
7%Italian
6%Scottish
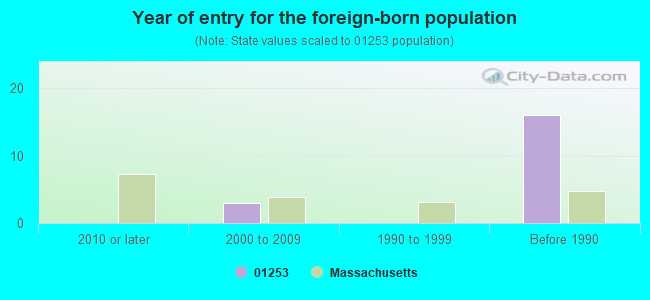
Year of entry for the foreign-born population
02010 or later
32000 to 2009
01990 to 1999
16Before 1990
Facilities with environmental interests located in this zip code:
MA TURNPIKE AUTHORITY (RUSSELL STAGE ROAD 2 E MM29 in OTIS, MA)
(Resource Conservation and Recovery Act (tracking hazardous waste)) Business NAICS classification: GENERAL AUTOMOTIVE REPAIR. Organizations: MOBILE OIL CORP (CONTACT/OWNER)
MA TURNPIKE AUTHORITY (RUSSELL STAGE ROAD 2 W MM29 in OTIS, MA)
(Resource Conservation and Recovery Act (tracking hazardous waste)) Organizations: MOBILE OIL CORP (CONTACT/OWNER)
NEW ENGLAND TELE (EAST OTIS RD in OTIS, MA)
(Resource Conservation and Recovery Act (tracking hazardous waste))
L & M AUTO INC (OLD BLARDFORD RD in OTIS, MA)
(Resource Conservation and Recovery Act (tracking hazardous waste)) Organizations: SOUTHARD LARRY (CONTACT/OWNER)
OTIS (MAIN STREET in OTIS, MA)
AIR MINOR (AIRS/AFS) Business SIC classification: GENERAL GOVERNMENT
Housing units lacking complete plumbing facilities: 0.6%
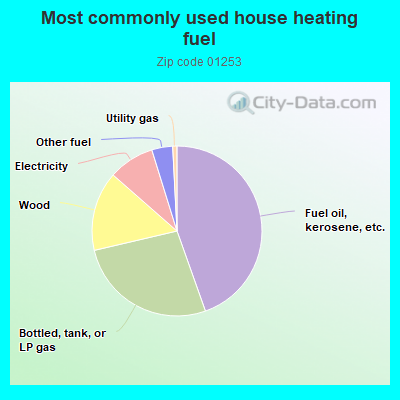
44.8%Fuel oil, kerosene, etc.
26.9%Bottled, tank, or LP gas
15.2%Wood
8.8%Electricity
4.0%Other fuel
0.8%Utility gas
Population in 1990: 1,060.
Place of birth for U.S.-born residents:
This state: 389
Northeast: 335
Midwest: 16
South: 36
West: 17
62% of the 01253 zip code residents lived in the same house 5 years ago. Out of people who lived in different houses, 50% lived in this county. Out of people who lived in different counties, 50% lived in Massachusetts.
86% of the 01253 zip code residents lived in the same house 1 year ago. Out of people who lived in different houses, 14% moved from this county. Out of people who lived in different houses, 93% moved from different state.
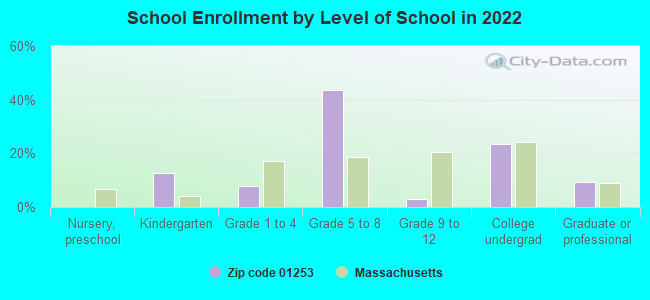
Private vs. public school enrollment:
Students in private schools in grades 1 to 8 (elementary and middle school): 14
Here:
44.6%
Massachusetts:
10.3%
Students in private schools in grades 9 to 12 (high school):
Here:
0.0%
Massachusetts:
12.3%
Students in private undergraduate colleges:
Here:
0.0%
Massachusetts:
51.2%
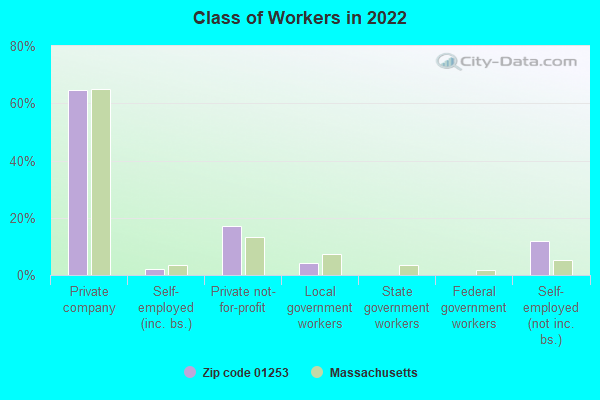
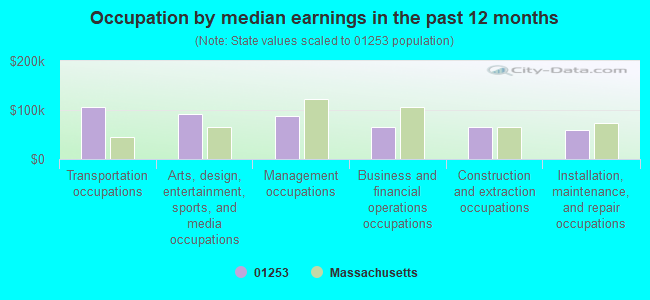
Occupation by median earnings in the past 12 months ($)
106,708Transportation occupations
91,203Arts, design, entertainment, sports, and media occupations
88,042Management occupations
66,085Business and financial operations occupations
65,432Construction and extraction occupations
59,690Installation, maintenance, and repair occupations
Top industries in this zip code by the number of employees in 2005:
Construction: Commercial and Institutional Building Construction (20-49 employees: 1 establishment)
Arts, Entertainment, and Recreation: Skiing Facilities (20-49: 1)
Administrative and Support and Waste Management and Remediation Services: Janitorial Services (10-19: 1)
Construction: Plumbing, Heating, and Air-Conditioning Contractors (5-9: 1, 1-4: 2)
Accommodation and Food Services: Limited-Service Restaurants (5-9: 1)
Construction: New Single-Family Housing Construction (except Operative Builders) (1-4: 2)
Administrative and Support and Waste Management and Remediation Services: Exterminating and Pest Control Services (1-4: 1)
Real Estate and Rental and Leasing: Lessors of Nonresidential Buildings (except Miniwarehouses) (1-4: 1)
Accommodation and Food Services: Recreational and Vacation Camps (except Campgrounds) (1-4: 1)
Other Services (except Public Administration): Reupholstery and Furniture Repair (1-4: 1)
People in group quarters in 2000:
4 people in other nonhousehold living situations
Home Mortgage Disclosure Act Aggregated Statistics For Year 2009 (Based on 2 partial tracts)
A) FHA, FSA/RHS & VA Home Purchase Loans
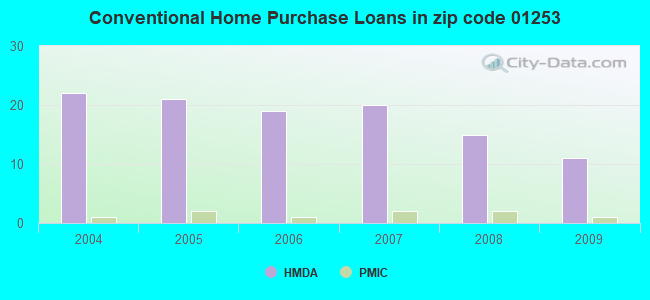
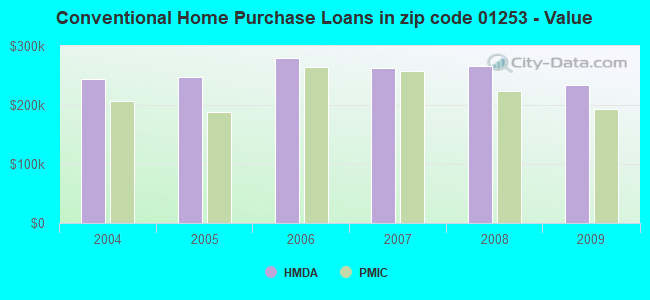
B) Conventional Home Purchase Loans
C) Refinancings
D) Home Improvement Loans
F) Non-occupant Loans on < 5 Family Dwellings (A B C & D)
Number
Average Value
Number
Average Value
Number
Average Value
Number
Average Value
Number
Average Value
LOANS ORIGINATED
1
$134,810
11
$234,308
56
$211,965
5
$195,696
28
$254,845
APPLICATIONS APPROVED, NOT ACCEPTED
0
$0
0
$0
3
$176,367
1
$97,490
1
$325,440
APPLICATIONS DENIED
0
$0
3
$224,203
7
$226,449
1
$11,960
2
$309,490
APPLICATIONS WITHDRAWN
0
$0
1
$214,900
9
$221,708
1
$191,350
3
$329,903
FILES CLOSED FOR INCOMPLETENESS
0
$0
0
$0
3
$124,907
0
$0
1
$248,240
Aggregated Statistics For Year 2008 (Based on 2 partial tracts)
B) Conventional Home Purchase Loans
C) Refinancings
D) Home Improvement Loans
F) Non-occupant Loans on < 5 Family Dwellings (A B C & D)
Number
Average Value
Number
Average Value
Number
Average Value
Number
Average Value
LOANS ORIGINATED
15
$266,775
20
$199,664
6
$113,612
11
$275,721
APPLICATIONS APPROVED, NOT ACCEPTED
1
$338,840
2
$179,205
0
$0
2
$157,825
APPLICATIONS DENIED
2
$367,290
7
$209,984
2
$83,350
3
$260,083
APPLICATIONS WITHDRAWN
1
$456,990
3
$178,663
1
$85,890
2
$352,070
FILES CLOSED FOR INCOMPLETENESS
0
$0
2
$175,765
0
$0
0
$0
Aggregated Statistics For Year 2007 (Based on 2 partial tracts)
B) Conventional Home Purchase Loans
C) Refinancings
D) Home Improvement Loans
F) Non-occupant Loans on < 5 Family Dwellings (A B C & D)
Number
Average Value
Number
Average Value
Number
Average Value
Number
Average Value
LOANS ORIGINATED
20
$263,410
22
$202,994
5
$88,354
15
$272,331
APPLICATIONS APPROVED, NOT ACCEPTED
1
$225,050
2
$179,390
1
$120,680
1
$156,560
APPLICATIONS DENIED
2
$147,135
12
$261,804
1
$30,800
2
$225,415
APPLICATIONS WITHDRAWN
2
$260,385
4
$121,858
1
$42,040
1
$323,620
FILES CLOSED FOR INCOMPLETENESS
0
$0
1
$260,930
0
$0
0
$0
Aggregated Statistics For Year 2006 (Based on 2 partial tracts)
B) Conventional Home Purchase Loans
C) Refinancings
D) Home Improvement Loans
F) Non-occupant Loans on < 5 Family Dwellings (A B C & D)
Number
Average Value
Number
Average Value
Number
Average Value
Number
Average Value
LOANS ORIGINATED
19
$280,040
26
$208,547
6
$106,365
14
$307,859
APPLICATIONS APPROVED, NOT ACCEPTED
3
$192,433
4
$221,608
0
$0
2
$190,805
APPLICATIONS DENIED
4
$206,840
16
$165,549
3
$104,130
2
$306,770
APPLICATIONS WITHDRAWN
3
$129,377
12
$159,638
1
$40,230
3
$241,117
FILES CLOSED FOR INCOMPLETENESS
1
$256,580
3
$196,420
0
$0
1
$306,590
Aggregated Statistics For Year 2005 (Based on 2 partial tracts)
B) Conventional Home Purchase Loans
C) Refinancings
D) Home Improvement Loans
F) Non-occupant Loans on < 5 Family Dwellings (A B C & D)
Number
Average Value
Number
Average Value
Number
Average Value
Number
Average Value
LOANS ORIGINATED
21
$246,932
33
$169,087
3
$220,823
19
$283,893
APPLICATIONS APPROVED, NOT ACCEPTED
1
$325,440
5
$167,718
1
$19,930
2
$165,435
APPLICATIONS DENIED
2
$177,575
18
$191,790
3
$84,440
2
$264,550
APPLICATIONS WITHDRAWN
7
$172,710
19
$169,469
1
$666,090
3
$214,180
FILES CLOSED FOR INCOMPLETENESS
1
$173,230
1
$154,020
1
$47,110
0
$0
Aggregated Statistics For Year 2004 (Based on 2 partial tracts)
B) Conventional Home Purchase Loans
C) Refinancings
D) Home Improvement Loans
F) Non-occupant Loans on < 5 Family Dwellings (A B C & D)


 Nearest zip codes: 01029, 01264, 01255, 01223, 01245, 01238.