Estimated zip code population in 2022: 930 Zip code population in 2010: 915 Zip code population in 2000: 752
Houses and condos: 642 Renter-occupied apartments: 12
% of renters here:
3%
State:
38%
March 2022 cost of living index in zip code 01255: 88.1 (less than average, U.S. average is 100)
Land area: 51.8 sq. mi. Water area: 1.2 sq. mi.
Population density: 18 people per square mile
(very low).
OSM Map
Google Map
MSN Map
OSM Map
General Map
Google Map
MSN Map
OSM Map
Google Map
MSN Map
OSM Map
Google Map
MSN Map
Please wait while loading the map...
Real estate property taxes paid for housing units in 2022:
This zip code:
1.1% ($3,602)
Massachusetts:
1.0% ($5,536)
Median real estate property taxes paid for housing units with mortgages in 2022: $3,684 (1.1%) Median real estate property taxes paid for housing units with no mortgage in 2022: $3,491 (1.2%)
Business Search- 14 Million verified businesses
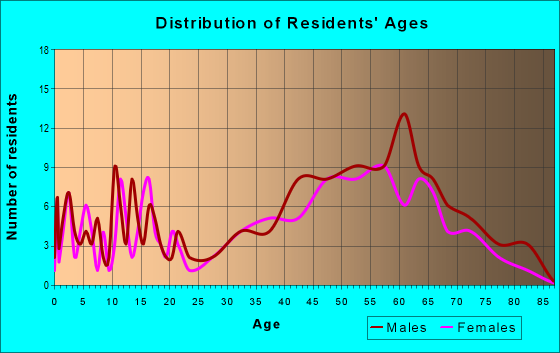
Males: 468
(50.3%)
Females: 462
(49.7%)
For population 25 years and over in 01255:
High school or higher: 87.4%
Bachelor's degree or higher: 29.5%
Graduate or professional degree: 18.8%
Unemployed: 2.2%
Mean travel time to work (commute): 36.6 minutes
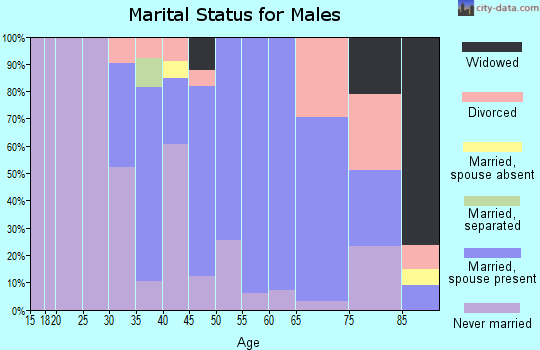
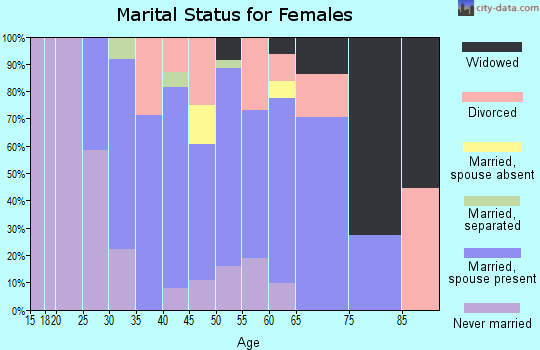
For population 15 years and over in 01255:
Never married: 37.2%
Now married: 43.2%
Separated: 0.7%
Widowed: 7.3%
Divorced: 11.7%
Zip code 01255 compared to state average:
Median house value below state average.
Unemployed percentage below state average.
Black race population percentage significantly below state average.
Hispanic race population percentage significantly below state average.
Median age significantly above state average.
Foreign-born population percentage significantly below state average.
Renting percentage significantly below state average.
Length of stay since moving in significantly above state average.
Averages for the 2020 tax year for zip code 01255, filed in 2021:
Average Adjusted Gross Income (AGI) in 2020: $84,964 (Individual Income Tax Returns)
Here:
$84,964
State:
$105,130
Salary/wage: $71,203 (reported on 79.5% of returns)
Here:
$71,203
State:
$82,951
(% of AGI for various income ranges: 1361.7% for AGIs below $25k, 3985.7% for AGIs $25k-50k, 10060.0% for AGIs $50k-75k, 11335.0% for AGIs $75k-100k, 17045.0% for AGIs $100k-200k)
Taxable interest for individuals: $562 (reported on 41.0% of returns)
This zip code:
$562
Massachusetts:
$2,361
(% of AGI for various income ranges: 13.3% for AGIs below $25k, 4.3% for AGIs $25k-50k, 76.7% for AGIs $50k-75k, 280.0% for AGIs $100k-200k)
Ordinary dividends: $5,833 (reported on 23.1% of returns)
Here:
$5,833
State:
$10,365
(% of AGI for various income ranges: 81.7% for AGIs below $25k, 173.3% for AGIs $50k-75k, 725.0% for AGIs $100k-200k)
Net capital gain/loss in AGI: +$23,612 (reported on 20.5% of returns)
Here:
+$23,612
State:
+$48,178
(% of AGI for various income ranges: 44.3% for AGIs $25k-50k, 1050.0% for AGIs $75k-100k)
Profit/loss from business: +$10,562 (reported on 20.5% of returns)
Here:
+$10,562
State:
+$20,792
(% of AGI for various income ranges: 245.0% for AGIs below $25k, 860.0% for AGIs $25k-50k, 480.0% for AGIs $75k-100k)
Taxable individual retirement arrangement distribution: $14,100 (reported on 10.3% of returns)
01255:
$14,100
Massachusetts:
$22,790
(% of AGI for various income ranges: 1880.0% for AGIs $50k-75k)
Total itemized deductions: $34,367 (reported on 7.7% of returns)
Here:
$34,367
State:
$36,722
(% of AGI for various income ranges: 5155.0% for AGIs $100k-200k)
Charity contributions: $4,867 (reported on 7.7% of returns)
Here:
$4,867
State:
$12,529
(% of AGI for various income ranges: 730.0% for AGIs $75k-100k)
Taxes paid: $7,700 (reported on 10.3% of returns)
01255:
$7,700
State:
$8,782
(% of AGI for various income ranges: 1540.0% for AGIs $100k-200k)
Earned income credit: $1,625 (reported on 10.3% of returns)
Here:
$1,625
State:
$1,909
(% of AGI for various income ranges: 108.3% for AGIs below $25k)
Percentage of individuals using paid preparers for their 2020 taxes: 89.7%
Here:
90%
State:
92%
(% for various income ranges: 83.3% for AGIs below $25k, 90.0% for AGIs $25k-50k, 85.7% for AGIs $50k-75k, 100.0% for AGIs $75k-100k, 100.0% for AGIs $100k-200k, 100.0% for AGIs over 200k)
Averages for the 2012 tax year for zip code 01255, filed in 2013:
Average Adjusted Gross Income (AGI) in 2012: $49,253 (Individual Income Tax Returns)
Here:
$49,253
State:
$81,425
Salary/wage: $40,496 (reported on 81.2% of returns)
Here:
$40,496
State:
$64,752
(% of AGI for various income ranges: 67.2% for AGIs below $25k, 69.8% for AGIs $25k-50k, 73.6% for AGIs $50k-75k, 61.0% for AGIs $75k-100k, 64.1% for AGIs $100k-200k)
Taxable interest for individuals: $446 (reported on 40.6% of returns)
This zip code:
$446
Massachusetts:
$2,136
(% of AGI for various income ranges: 0.3% for AGIs below $25k, 0.5% for AGIs $25k-50k, 1.0% for AGIs $50k-75k, 0.1% for AGIs $100k-200k)
Ordinary dividends: $3,329 (reported on 21.9% of returns)
Here:
$3,329
State:
$9,473
Net capital gain/loss in AGI: +$5,360 (reported on 15.6% of returns)
Here:
+$5,360
State:
+$31,437
Profit/loss from business: +$12,200 (reported on 21.9% of returns)
Here:
+$12,200
State:
+$20,662
Taxable individual retirement arrangement distribution: $12,267 (reported on 9.4% of returns)
01255:
$12,267
Massachusetts:
$18,892
Total itemized deductions: $20,085 (26% of AGI, reported on 40.6% of returns)
Here:
$20,085
State:
$28,907
Here:
25.9% of AGI
State:
18.2% of AGI
(% of AGI for various income ranges: 18.9% for AGIs $25k-50k, 27.6% for AGIs $50k-75k, 20.7% for AGIs $100k-200k)
Charity contributions: $1,912 (reported on 25.0% of returns)
Here:
$1,912
State:
$4,208
(% of AGI for various income ranges: 1.5% for AGIs below $25k, 0.9% for AGIs $50k-75k, 1.8% for AGIs $100k-200k)
Taxes paid: $7,669 (reported on 40.6% of returns)
01255:
$7,669
State:
$13,303
(% of AGI for various income ranges: 6.1% for AGIs $25k-50k, 10.2% for AGIs $50k-75k, 8.6% for AGIs $100k-200k)
Earned income credit: $1,480 (reported on 15.6% of returns)
Here:
$1,480
State:
$1,971
(% of AGI for various income ranges: 5.2% for AGIs below $25k)
Percentage of individuals using paid preparers for their 2012 taxes: 62.5%
Here:
62%
State:
56%
(% for various income ranges: 58.3% for AGIs below $25k, 62.5% for AGIs $25k-50k, 100.0% for AGIs $50k-75k, 75.0% for AGIs $100k-200k)
Averages for the 2004 tax year for zip code 01255, filed in 2005:
Average Adjusted Gross Income (AGI) in 2004: $43,444 (Individual Income Tax Returns)
Here:
$43,444
State:
$62,877
Salary/wage: $36,459 (reported on 78.6% of returns)
Here:
$36,459
State:
$52,969
(% of AGI for various income ranges: 107.7% for AGIs below $10k, 68.1% for AGIs $10k-25k, 64.7% for AGIs $25k-50k, 82.3% for AGIs $50k-75k, 70.3% for AGIs $75k-100k, 45.7% for AGIs over 100k)
Taxable interest for individuals: $851 (reported on 55.9% of returns)
This zip code:
$851
Massachusetts:
$1,945
(% of AGI for various income ranges: 11.8% for AGIs below $10k, 1.0% for AGIs $10k-25k, 1.7% for AGIs $25k-50k, 0.4% for AGIs $50k-75k, 1.0% for AGIs $75k-100k, 0.7% for AGIs over 100k)
Taxable dividends: $1,883 (reported on 24.6% of returns)
Here:
$1,883
State:
$5,323
(% of AGI for various income ranges: 5.5% for AGIs below $10k, 1.2% for AGIs $10k-25k, 0.8% for AGIs $25k-50k, 0.9% for AGIs $50k-75k, 1.7% for AGIs over 100k)
Net capital gain/loss: +$5,018 (reported on 18.2% of returns)
Here:
+$5,018
State:
+$20,377
(% of AGI for various income ranges: -4.1% for AGIs below $10k, -0.8% for AGIs $25k-50k, 0.2% for AGIs $50k-75k, 13.4% for AGIs $75k-100k)
Profit/loss from business: +$8,269 (reported on 24.9% of returns)
Here:
+$8,269
State:
+$17,837
Total itemized deductions: $18,983 (26% of AGI, reported on 36.7% of returns)
Here:
$18,983
State:
$22,573
Here:
25.6% of AGI
State:
19.5% of AGI
(% of AGI for various income ranges: 18.3% for AGIs $10k-25k, 9.9% for AGIs $25k-50k, 14.0% for AGIs $50k-75k, 16.6% for AGIs $75k-100k, 21.9% for AGIs over 100k)
Charity contributions deductions: $2,600 (4% of AGI, reported on 28.8% of returns)
Here:
$2,600
State:
$3,295
Here:
3.8% of AGI
State:
2.7% of AGI
(% of AGI for various income ranges: 0.7% for AGIs $10k-25k, 0.8% for AGIs $25k-50k, 1.0% for AGIs $50k-75k, 1.6% for AGIs $75k-100k, 3.5% for AGIs over 100k)
Total tax: $5,378 (reported on 83.7% of returns)
01255:
$5,378
State:
$11,494
(% of AGI for various income ranges: 5.5% for AGIs below $10k, 6.5% for AGIs $10k-25k, 7.7% for AGIs $25k-50k, 8.6% for AGIs $50k-75k, 10.6% for AGIs $75k-100k, 15.3% for AGIs over 100k)
Earned income credit: $1,821 (reported on 8.9% of returns)
Here:
$1,821
State:
$1,518
Percentage of individuals using paid preparers for their 2004 taxes: 61.7%
Here:
62%
State:
58%
(% for various income ranges: 44.1% for AGIs below $10k, 65.0% for AGIs $10k-25k, 62.9% for AGIs $25k-50k, 73.7% for AGIs $50k-75k, 57.7% for AGIs $75k-100k, 66.7% for AGIs over 100k)
Household received Food Stamps/SNAP in the past 12 months: 29 Household did not receive Food Stamps/SNAP in the past 12 months: 328
Women who had a birth in the past 12 months: 5 (2 now married, 3 unmarried) Women who did not have a birth in the past 12 months: 176 (51 now married, 125 unmarried)
Housing units in zip code 01255 with a mortgage: 207 (15 second mortgage, 13 both second mortgage and home equity loan) Houses without a mortgage: 11
Median monthly owner costs for units with a mortgage: $1,746 Median monthly owner costs for units without a mortgage: $687
Residents with income below the poverty level in 2022:
This zip code:
6.7%
Whole state:
10.4%
Residents with income below 50% of the poverty level in 2022:
This zip code:
3.2%
Whole state:
5.1%
Median number of rooms in houses and condos:
Here:
5.9
State:
6.5
Median number of rooms in apartments:
Here:
10.0
State:
4.0
Notable locations in this zip code not listed on our city pages
Notable locations in zip code 01255: Free Quarter (A), Sandisfield Fire Department Station 2 (B), Sandisfield Fire Department Station 1 Headquarters (C), West New Boston Town Hall (D). Display/hide their locations on the map
Lakes, reservoirs, and swamps: Spectacle Ponds (A), Lake Marguerite (B), Mirror Lake (C), Abbey Lake (D), West Lake (E), Lower Spectacle Pond (F), Upper Spectacle Pond (G), Gilder Pond (H). Display/hide their locations on the map
Streams, rivers, and creeks: Spectacle Pond Brook (A), Silver Brook (B), Clam River (C), Buck River (D), Cherry Brook (E), Riiska Brook (F). Display/hide their locations on the map
In group quarters: 52 (-1 institutionalized population)
Size of family households: 118 2-persons, 40 3-persons, 33 4-persons, 34 5-persons, 2 7-or-more-persons
Size of nonfamily households: 108 1-person, 22 2-persons, 2 3-persons
62 married couples with children.
37 single-parent households (22 men, 15 women).
96.1% of residents of 01255 zip code speak English at home.
1.7% of residents speak Spanish at home (60% very well, 40% not well).
0.7% of residents speak other Indo-European language at home (33% very well, 67% well).
1.3% of residents speak Asian or Pacific Island language at home (83% very well, 17% well).
0.1% of residents speak other language at home (100% very well).
Foreign born population: 14 (1.5%) (36.2% of them are naturalized citizens)
This zip code:
1.5%
Whole state:
18.0%
29%Honduras
14%Sweden
14%United Kingdom, excluding England and Scotland
14%Taiwan
7%Czechoslovakia (includes Czech Republic and Slovakia)
18%American
12%Irish
12%Italian
8%English
7%Swedish
4%European
3%German
Year of entry for the foreign-born population
102010 or later
22000 to 2009
21990 to 1999
1Before 1990
Facilities with environmental interests located in this zip code:
A&M AUTO SERVICE (RTE 57 in SANDISFIELD, MA)
Conditionally Exempt Small Quantity Generators, less than 100 kg/month of hazardous waste (Resource Conservation and Recovery Act (tracking hazardous waste)) - notification Organizations: RALPH E MORRISON (CONTACT/OWNER)
Housing units lacking complete plumbing facilities: 4.5% Housing units lacking complete kitchen facilities: 4.3%
33.5%Fuel oil, kerosene, etc.
32.3%Wood
17.9%Bottled, tank, or LP gas
11.6%Electricity
2.3%Utility gas
1.7%Solar energy
1.4%Other fuel
Population in 1990: 651. Population change in the 1990s: +101 (+15.5%).
Place of birth for U.S.-born residents:
This state: 424
Northeast: 386
Midwest: 30
South: 54
West: 17
77% of the 01255 zip code residents lived in the same house 5 years ago. Out of people who lived in different houses, 35% lived in this county. Out of people who lived in different counties, 50% lived in Massachusetts.
86% of the 01255 zip code residents lived in the same house 1 year ago. Out of people who lived in different houses, 17% moved from this county. Out of people who lived in different houses, 14% moved from different county within same state. Out of people who lived in different houses, 68% moved from different state. Out of people who lived in different houses, 7% moved from abroad.
Private vs. public school enrollment:
Students in private schools in grades 1 to 8 (elementary and middle school): 11
Here:
21.3%
Massachusetts:
10.3%
Students in private schools in grades 9 to 12 (high school):
Here:
0.0%
Massachusetts:
12.3%
Students in private undergraduate colleges: 10
Here:
19.4%
Massachusetts:
51.2%
Occupation by median earnings in the past 12 months ($)
214,376Health diagnosing and treating practitioners and other technical occupations
165,057Community and social service occupations
128,541Architecture and engineering occupations
121,604Arts, design, entertainment, sports, and media occupations
100,488Management occupations
65,658Education, training, and library occupations
Top industries in this zip code by the number of employees in 2005:
Health Care and Social Assistance: Nursing Care Facilities (20-49 employees: 1 establishment)
Accommodation and Food Services: Full-Service Restaurants (5-9: 1, 1-4: 1)
Construction: Framing Contractors (5-9: 1)
Construction: New Single-Family Housing Construction (except Operative Builders) (5-9: 1)
Other Services (except Public Administration): General Automotive Repair (1-4: 1)
Construction: Residential Remodelers (1-4: 1)
People in group quarters in 2010:
54 people in nursing facilities/skilled-nursing facilities
People in group quarters in 2000:
48 people in nursing homes
Home Mortgage Disclosure Act Aggregated Statistics For Year 2009 (Based on 2 partial tracts)
A) FHA, FSA/RHS & VA Home Purchase Loans
B) Conventional Home Purchase Loans
C) Refinancings
D) Home Improvement Loans
F) Non-occupant Loans on < 5 Family Dwellings (A B C & D)
G) Loans On Manufactured Home Dwelling (A B C & D)
Number
Average Value
Number
Average Value
Number
Average Value
Number
Average Value
Number
Average Value
Number
Average Value
LOANS ORIGINATED
2
$192,175
31
$237,036
160
$211,509
14
$199,260
81
$251,157
1
$111,590
APPLICATIONS APPROVED, NOT ACCEPTED
1
$101,250
1
$256,230
9
$167,608
4
$69,482
4
$231,952
0
$0
APPLICATIONS DENIED
0
$0
7
$273,946
20
$225,961
2
$17,050
5
$352,942
0
$0
APPLICATIONS WITHDRAWN
0
$0
2
$306,345
25
$227,552
4
$136,382
9
$313,519
0
$0
FILES CLOSED FOR INCOMPLETENESS
0
$0
0
$0
7
$152,619
0
$0
4
$176,935
0
$0
Aggregated Statistics For Year 2008 (Based on 2 partial tracts)
A) FHA, FSA/RHS & VA Home Purchase Loans
B) Conventional Home Purchase Loans
C) Refinancings
D) Home Improvement Loans
F) Non-occupant Loans on < 5 Family Dwellings (A B C & D)
G) Loans On Manufactured Home Dwelling (A B C & D)
Number
Average Value
Number
Average Value
Number
Average Value
Number
Average Value
Number
Average Value
Number
Average Value
LOANS ORIGINATED
1
$252,100
43
$265,316
57
$199,734
18
$107,969
32
$270,214
1
$77,490
APPLICATIONS APPROVED, NOT ACCEPTED
0
$0
3
$322,013
5
$204,366
1
$8,270
5
$179,984
0
$0
APPLICATIONS DENIED
0
$0
6
$349,050
19
$220,561
6
$79,212
8
$278,060
0
$0
APPLICATIONS WITHDRAWN
0
$0
2
$651,435
9
$169,789
2
$122,435
5
$401,502
1
$66,120
FILES CLOSED FOR INCOMPLETENESS
0
$0
0
$0
5
$200,440
0
$0
1
$379,180
0
$0
Aggregated Statistics For Year 2007 (Based on 2 partial tracts)
B) Conventional Home Purchase Loans
C) Refinancings
D) Home Improvement Loans
E) Loans on Dwellings For 5+ Families
F) Non-occupant Loans on < 5 Family Dwellings (A B C & D)
G) Loans On Manufactured Home Dwelling (A B C & D)
Number
Average Value
Number
Average Value
Number
Average Value
Number
Average Value
Number
Average Value
Number
Average Value
LOANS ORIGINATED
58
$258,959
64
$198,939
14
$89,962
0
$0
43
$270,843
1
$56,830
APPLICATIONS APPROVED, NOT ACCEPTED
4
$160,405
6
$170,478
3
$114,687
1
$268,630
3
$148,780
0
$0
APPLICATIONS DENIED
5
$167,792
35
$255,909
3
$29,273
0
$0
6
$214,217
1
$56,830
APPLICATIONS WITHDRAWN
5
$296,942
12
$115,804
2
$59,925
0
$0
3
$307,550
0
$0
FILES CLOSED FOR INCOMPLETENESS
1
$231,440
3
$247,967
1
$754,240
0
$0
1
$754,240
0
$0
Aggregated Statistics For Year 2006 (Based on 2 partial tracts)
B) Conventional Home Purchase Loans
C) Refinancings
D) Home Improvement Loans
E) Loans on Dwellings For 5+ Families
F) Non-occupant Loans on < 5 Family Dwellings (A B C & D)
G) Loans On Manufactured Home Dwelling (A B C & D)
Number
Average Value
Number
Average Value
Number
Average Value
Number
Average Value
Number
Average Value
Number
Average Value
LOANS ORIGINATED
55
$275,808
75
$206,117
18
$101,082
0
$0
41
$299,704
0
$0
APPLICATIONS APPROVED, NOT ACCEPTED
8
$205,736
12
$210,601
1
$573,430
0
$0
5
$217,592
0
$0
APPLICATIONS DENIED
11
$214,436
44
$171,629
9
$98,958
1
$268,630
6
$291,535
1
$144,650
APPLICATIONS WITHDRAWN
7
$158,080
34
$160,632
2
$57,345
0
$0
9
$229,141
0
$0
FILES CLOSED FOR INCOMPLETENESS
3
$243,837
8
$209,998
0
$0
0
$0
4
$218,522
0
$0
Aggregated Statistics For Year 2005 (Based on 2 partial tracts)
A) FHA, FSA/RHS & VA Home Purchase Loans
B) Conventional Home Purchase Loans
C) Refinancings
D) Home Improvement Loans
E) Loans on Dwellings For 5+ Families
F) Non-occupant Loans on < 5 Family Dwellings (A B C & D)
G) Loans On Manufactured Home Dwelling (A B C & D)
Number
Average Value
Number
Average Value
Number
Average Value
Number
Average Value
Number
Average Value
Number
Average Value
Number
Average Value
LOANS ORIGINATED
0
$0
61
$242,362
93
$171,056
9
$209,854
1
$553,800
55
$279,603
0
$0
APPLICATIONS APPROVED, NOT ACCEPTED
0
$0
4
$231,952
14
$170,773
2
$28,415
1
$574,460
6
$157,218
0
$0
APPLICATIONS DENIED
0
$0
6
$168,757
51
$192,985
9
$80,246
0
$0
6
$251,412
1
$56,830
APPLICATIONS WITHDRAWN
1
$199,410
19
$181,408
55
$166,909
4
$474,755
1
$294,460
8
$228,982
0
$0
FILES CLOSED FOR INCOMPLETENESS
0
$0
2
$246,935
3
$146,370
2
$67,160
0
$0
1
$185,980
0
$0
Aggregated Statistics For Year 2004 (Based on 2 partial tracts)
B) Conventional Home Purchase Loans
C) Refinancings
D) Home Improvement Loans
F) Non-occupant Loans on < 5 Family Dwellings (A B C & D)
G) Loans On Manufactured Home Dwelling (A B C & D)
Detailed PMIC statistics for the following Tracts:9334.00
2002 - 2018 National Fire Incident Reporting System (NFIRS) incidents
Based on the data from the years 2002 - 2018 the average number of fire incidents per year is 7. The highest number of reported fire incidents - 19 took place in 2008, and the least - 0 in 2004. The data has a growing trend.
When looking into fire subcategories, the most reports belonged to: Structure Fires (52.0%), and Outside Fires (35.8%).
Fire incident types reported to NFIRS in Zip Code 01255


 Nearest zip codes: 06021, 01253, 01029, 01259, 01245, 01244.


 Based on the data from the years 2002 - 2018 the average number of fire incidents per year is 7. The highest number of reported fire incidents - 19 took place in 2008, and the least - 0 in 2004. The data has a growing trend.
 When looking into fire subcategories, the most reports belonged to: Structure Fires (52.0%), and Outside Fires (35.8%).