Estimated zip code population in 2022: 3,711 Zip code population in 2010: 4,084 Zip code population in 2000: 4,432
Houses and condos: 1,987 Renter-occupied apartments: 561
% of renters here:
32%
State:
38%
March 2022 cost of living index in zip code 01370: 88.2 (less than average, U.S. average is 100)
Land area: 49.8 sq. mi. Water area: 0.5 sq. mi.
Population density: 74 people per square mile
(very low).
OSM Map
Google Map
MSN Map
OSM Map
General Map
Google Map
MSN Map
OSM Map
Google Map
MSN Map
OSM Map
Google Map
MSN Map
Please wait while loading the map...
Real estate property taxes paid for housing units in 2022:
This zip code:
1.3% ($4,698)
Massachusetts:
1.0% ($5,536)
Median real estate property taxes paid for housing units with mortgages in 2022: $4,368 (1.2%) Median real estate property taxes paid for housing units with no mortgage in 2022: $5,062 (1.4%)
Business Search- 14 Million verified businesses
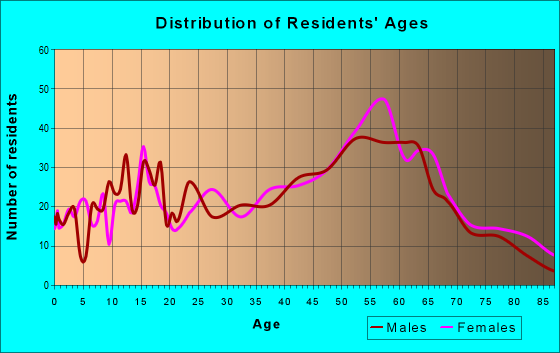
Males: 1,782
(48.0%)
Females: 1,929
(52.0%)
For population 25 years and over in 01370:
High school or higher: 95.2%
Bachelor's degree or higher: 53.4%
Graduate or professional degree: 24.7%
Unemployed: 4.0%
Mean travel time to work (commute): 23.2 minutes
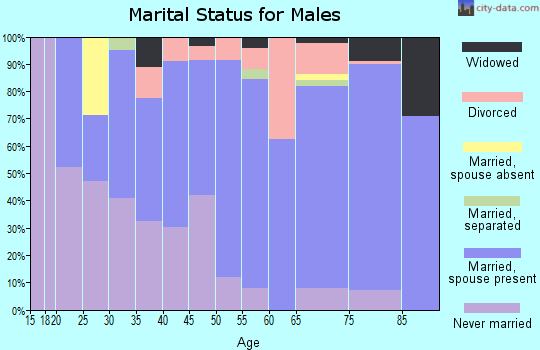
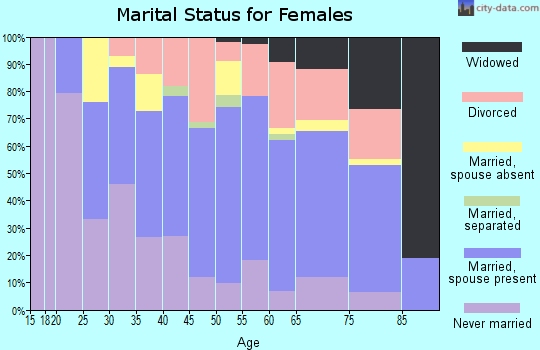
For population 15 years and over in 01370:
Never married: 30.3%
Now married: 47.6%
Separated: 1.3%
Widowed: 6.3%
Divorced: 14.5%
Zip code 01370 compared to state average:
Black race population percentage significantly below state average.
Hispanic race population percentage below state average.
Median age significantly above state average.
Foreign-born population percentage significantly below state average.
Length of stay since moving in significantly above state average.
Estimated median house/condo value in 2022: $363,539
01370:
$363,539
Massachusetts:
$534,700
According to our research of Massachusetts and other state lists, there were 2 registered sex offenders living in 01370 zip code as of April 27, 2024. The ratio of all residents to sex offenders in zip code 01370 is 1,967 to 1. The ratio of registered sex offenders to all residents in this zip code is lower than the state average.
Median resident age:
This zip code:
53.1 years
Massachusetts median age:
40.3 years
Average household size:
This zip code:
2.1 people
Massachusetts:
2.4 people
Averages for the 2020 tax year for zip code 01370, filed in 2021:
Average Adjusted Gross Income (AGI) in 2020: $64,162 (Individual Income Tax Returns)
Here:
$64,162
State:
$105,130
Salary/wage: $49,434 (reported on 70.9% of returns)
Here:
$49,434
State:
$82,951
(% of AGI for various income ranges: 1024.5% for AGIs below $25k, 3254.8% for AGIs $25k-50k, 5714.3% for AGIs $50k-75k, 10220.0% for AGIs $75k-100k, 13946.3% for AGIs $100k-200k)
Taxable interest for individuals: $1,733 (reported on 42.7% of returns)
This zip code:
$1,733
Massachusetts:
$2,361
(% of AGI for various income ranges: 38.4% for AGIs below $25k, 53.0% for AGIs $25k-50k, 152.2% for AGIs $50k-75k, 179.0% for AGIs $75k-100k, 202.1% for AGIs $100k-200k)
Ordinary dividends: $7,882 (reported on 29.1% of returns)
Here:
$7,882
State:
$10,365
(% of AGI for various income ranges: 69.7% for AGIs below $25k, 142.7% for AGIs $25k-50k, 249.1% for AGIs $50k-75k, 300.0% for AGIs $75k-100k, 626.8% for AGIs $100k-200k)
Net capital gain/loss in AGI: +$16,938 (reported on 24.9% of returns)
Here:
+$16,938
State:
+$48,178
(% of AGI for various income ranges: 24.5% for AGIs below $25k, 104.5% for AGIs $25k-50k, 239.6% for AGIs $50k-75k, 432.0% for AGIs $75k-100k, 1023.2% for AGIs $100k-200k)
Profit/loss from business: +$14,044 (reported on 23.5% of returns)
Here:
+$14,044
State:
+$20,792
(% of AGI for various income ranges: 187.9% for AGIs below $25k, 387.6% for AGIs $25k-50k, 462.2% for AGIs $50k-75k, 743.0% for AGIs $75k-100k, 767.9% for AGIs $100k-200k)
Taxable individual retirement arrangement distribution: $16,221 (reported on 16.0% of returns)
01370:
$16,221
Massachusetts:
$22,790
(% of AGI for various income ranges: 140.8% for AGIs below $25k, 223.9% for AGIs $25k-50k, 401.7% for AGIs $50k-75k, 404.0% for AGIs $75k-100k, 1533.2% for AGIs $100k-200k)
Self-employed (Keogh) retirement plans: $20,350 (reported on 0.9% of returns)
01370:
$20,350
Massachusetts:
$26,868
(% of AGI for various income ranges: 123.3% for AGIs $25k-50k)
Total itemized deductions: $23,212 (reported on 7.5% of returns)
Here:
$23,212
State:
$36,722
(% of AGI for various income ranges: 119.2% for AGIs below $25k, 164.2% for AGIs $25k-50k, 474.3% for AGIs $50k-75k, 856.8% for AGIs $100k-200k)
Charity contributions: $4,345 (reported on 5.2% of returns)
Here:
$4,345
State:
$12,529
(% of AGI for various income ranges: 58.5% for AGIs $25k-50k, 27.0% for AGIs $50k-75k, 117.4% for AGIs $100k-200k)
Taxes paid: $7,088 (reported on 7.5% of returns)
01370:
$7,088
State:
$8,782
(% of AGI for various income ranges: 38.4% for AGIs below $25k, 47.9% for AGIs $25k-50k, 158.3% for AGIs $50k-75k, 245.3% for AGIs $100k-200k)
Earned income credit: $1,750 (reported on 10.3% of returns)
Here:
$1,750
State:
$1,909
(% of AGI for various income ranges: 56.6% for AGIs below $25k, 51.5% for AGIs $25k-50k)
Percentage of individuals using paid preparers for their 2020 taxes: 93.0%
Here:
93%
State:
92%
(% for various income ranges: 94.0% for AGIs below $25k, 93.9% for AGIs $25k-50k, 91.9% for AGIs $50k-75k, 89.5% for AGIs $75k-100k, 93.9% for AGIs $100k-200k, 87.5% for AGIs over 200k)
Averages for the 2012 tax year for zip code 01370, filed in 2013:
Average Adjusted Gross Income (AGI) in 2012: $51,286 (Individual Income Tax Returns)
Here:
$51,286
State:
$81,425
Salary/wage: $41,483 (reported on 77.2% of returns)
Here:
$41,483
State:
$64,752
(% of AGI for various income ranges: 60.8% for AGIs below $25k, 69.8% for AGIs $25k-50k, 71.7% for AGIs $50k-75k, 73.0% for AGIs $75k-100k, 66.8% for AGIs $100k-200k, 33.8% for AGIs over 200k)
Taxable interest for individuals: $1,477 (reported on 45.5% of returns)
This zip code:
$1,477
Massachusetts:
$2,136
(% of AGI for various income ranges: 2.3% for AGIs below $25k, 1.2% for AGIs $25k-50k, 1.3% for AGIs $50k-75k, 0.9% for AGIs $75k-100k, 0.8% for AGIs $100k-200k, 1.9% for AGIs over 200k)
Ordinary dividends: $5,448 (reported on 27.7% of returns)
Here:
$5,448
State:
$9,473
(% of AGI for various income ranges: 4.5% for AGIs below $25k, 2.1% for AGIs $25k-50k, 2.4% for AGIs $50k-75k, 2.3% for AGIs $75k-100k, 3.1% for AGIs $100k-200k, 3.8% for AGIs over 200k)
Net capital gain/loss in AGI: +$7,735 (reported on 21.3% of returns)
Here:
+$7,735
State:
+$31,437
(% of AGI for various income ranges: 1.6% for AGIs $50k-75k, 1.0% for AGIs $75k-100k, 3.9% for AGIs $100k-200k, 10.7% for AGIs over 200k)
Profit/loss from business: +$14,442 (reported on 24.8% of returns)
Here:
+$14,442
State:
+$20,662
(% of AGI for various income ranges: 11.1% for AGIs below $25k, 8.9% for AGIs $25k-50k, 5.5% for AGIs $50k-75k, 5.4% for AGIs $75k-100k, 11.8% for AGIs $100k-200k)
Taxable individual retirement arrangement distribution: $9,250 (reported on 12.9% of returns)
01370:
$9,250
Massachusetts:
$18,892
(% of AGI for various income ranges: 4.9% for AGIs below $25k, 2.5% for AGIs $25k-50k, 2.7% for AGIs $50k-75k, 1.3% for AGIs $75k-100k, 3.3% for AGIs $100k-200k)
Self-employment retirement plans: $13,433 (reported on 1.5% of returns)
01370:
$13,433
Massachusetts:
$20,669
Total itemized deductions: $19,561 (21% of AGI, reported on 32.7% of returns)
Here:
$19,561
State:
$28,907
Here:
20.7% of AGI
State:
18.2% of AGI
(% of AGI for various income ranges: 15.6% for AGIs below $25k, 9.5% for AGIs $25k-50k, 13.1% for AGIs $50k-75k, 13.1% for AGIs $75k-100k, 13.1% for AGIs $100k-200k, 11.8% for AGIs over 200k)
Charity contributions: $2,351 (reported on 25.2% of returns)
Here:
$2,351
State:
$4,208
(% of AGI for various income ranges: 0.8% for AGIs below $25k, 0.7% for AGIs $25k-50k, 0.9% for AGIs $50k-75k, 1.1% for AGIs $75k-100k, 1.4% for AGIs $100k-200k, 1.8% for AGIs over 200k)
Taxes paid: $9,045 (reported on 32.7% of returns)
01370:
$9,045
State:
$13,303
(% of AGI for various income ranges: 4.2% for AGIs below $25k, 3.6% for AGIs $25k-50k, 5.7% for AGIs $50k-75k, 6.1% for AGIs $75k-100k, 6.6% for AGIs $100k-200k, 7.4% for AGIs over 200k)
Earned income credit: $1,528 (reported on 14.4% of returns)
Here:
$1,528
State:
$1,971
(% of AGI for various income ranges: 3.4% for AGIs below $25k, 0.7% for AGIs $25k-50k)
Percentage of individuals using paid preparers for their 2012 taxes: 58.9%
Here:
59%
State:
56%
(% for various income ranges: 54.9% for AGIs below $25k, 57.1% for AGIs $25k-50k, 61.3% for AGIs $50k-75k, 61.1% for AGIs $75k-100k, 66.7% for AGIs $100k-200k, 100.0% for AGIs over 200k)
Averages for the 2004 tax year for zip code 01370, filed in 2005:
Average Adjusted Gross Income (AGI) in 2004: $46,872 (Individual Income Tax Returns)
Here:
$46,872
State:
$62,877
Salary/wage: $36,691 (reported on 80.3% of returns)
Here:
$36,691
State:
$52,969
(% of AGI for various income ranges: 93.3% for AGIs below $10k, 67.8% for AGIs $10k-25k, 76.4% for AGIs $25k-50k, 77.4% for AGIs $50k-75k, 77.6% for AGIs $75k-100k, 40.0% for AGIs over 100k)
Taxable interest for individuals: $1,497 (reported on 54.0% of returns)
This zip code:
$1,497
Massachusetts:
$1,945
(% of AGI for various income ranges: 7.9% for AGIs below $10k, 2.5% for AGIs $10k-25k, 1.7% for AGIs $25k-50k, 1.2% for AGIs $50k-75k, 1.5% for AGIs $75k-100k, 1.6% for AGIs over 100k)
Taxable dividends: $4,180 (reported on 30.3% of returns)
Here:
$4,180
State:
$5,323
(% of AGI for various income ranges: 7.2% for AGIs below $10k, 1.9% for AGIs $10k-25k, 2.0% for AGIs $25k-50k, 1.8% for AGIs $50k-75k, 1.5% for AGIs $75k-100k, 4.0% for AGIs over 100k)
Net capital gain/loss: +$19,282 (reported on 24.4% of returns)
Here:
+$19,282
State:
+$20,377
(% of AGI for various income ranges: -2.8% for AGIs below $10k, 0.7% for AGIs $10k-25k, 1.4% for AGIs $25k-50k, 1.8% for AGIs $50k-75k, 3.2% for AGIs $75k-100k, 24.4% for AGIs over 100k)
Profit/loss from business: +$12,282 (reported on 25.6% of returns)
Here:
+$12,282
State:
+$17,837
(% of AGI for various income ranges: 11.1% for AGIs below $10k, 12.4% for AGIs $10k-25k, 6.1% for AGIs $25k-50k, 3.7% for AGIs $50k-75k, 7.8% for AGIs $75k-100k, 6.5% for AGIs over 100k)
IRA payment deduction: $2,605 (reported on 4.2% of returns)
01370:
$2,605
Massachusetts:
$3,100
(% of AGI for various income ranges: 0.5% for AGIs $10k-25k, 0.3% for AGIs $25k-50k, 0.3% for AGIs $50k-75k, 0.4% for AGIs $75k-100k)
Self-employed pension: $8,920 (reported on 2.4% of returns)
Here:
$8,920
Massachusetts:
$14,516
(% of AGI for various income ranges: 0.9% for AGIs $10k-25k, 0.6% for AGIs $50k-75k, 0.8% for AGIs over 100k)
Total itemized deductions: $16,662 (19% of AGI, reported on 33.0% of returns)
Here:
$16,662
State:
$22,573
Here:
18.9% of AGI
State:
19.5% of AGI
(% of AGI for various income ranges: 19.2% for AGIs below $10k, 10.9% for AGIs $10k-25k, 9.4% for AGIs $25k-50k, 12.9% for AGIs $50k-75k, 14.3% for AGIs $75k-100k, 11.4% for AGIs over 100k)
Charity contributions deductions: $2,002 (2% of AGI, reported on 28.2% of returns)
Here:
$2,002
State:
$3,295
Here:
2.1% of AGI
State:
2.7% of AGI
(% of AGI for various income ranges: 1.7% for AGIs below $10k, 1.0% for AGIs $10k-25k, 0.7% for AGIs $25k-50k, 1.1% for AGIs $50k-75k, 1.5% for AGIs $75k-100k, 1.5% for AGIs over 100k)
Total tax: $7,755 (reported on 78.9% of returns)
01370:
$7,755
State:
$11,494
(% of AGI for various income ranges: 4.2% for AGIs below $10k, 5.9% for AGIs $10k-25k, 7.8% for AGIs $25k-50k, 9.3% for AGIs $50k-75k, 11.4% for AGIs $75k-100k, 20.5% for AGIs over 100k)
Earned income credit: $1,342 (reported on 11.2% of returns)
Here:
$1,342
State:
$1,518
Percentage of individuals using paid preparers for their 2004 taxes: 60.6%
Here:
61%
State:
58%
(% for various income ranges: 54.8% for AGIs below $10k, 58.9% for AGIs $10k-25k, 60.9% for AGIs $25k-50k, 60.6% for AGIs $50k-75k, 64.1% for AGIs $75k-100k, 78.9% for AGIs over 100k)
Likely homosexual households (counted as self-reported same-sex unmarried-partner households)
Lesbian couples: 0.2% of all households
Gay men: 0.0% of all households
Household received Food Stamps/SNAP in the past 12 months: 268 Household did not receive Food Stamps/SNAP in the past 12 months: 1,507
Women who had a birth in the past 12 months: 34 (35 now married, 0 unmarried) Women who did not have a birth in the past 12 months: 585 (225 now married, 358 unmarried)
Housing units in zip code 01370 with a mortgage: 648 (158 second mortgage, 159 both second mortgage and home equity loan) Houses without a mortgage: 29
Median monthly owner costs for units with a mortgage: $1,845 Median monthly owner costs for units without a mortgage: $804
Residents with income below the poverty level in 2022:
This zip code:
14.2%
Whole state:
10.4%
Residents with income below 50% of the poverty level in 2022:
This zip code:
6.0%
Whole state:
5.1%
Median number of rooms in houses and condos:
Here:
6.9
State:
6.5
Median number of rooms in apartments:
Here:
4.2
State:
4.0
Notable locations in this zip code not listed on our city pages
Notable locations in zip code 01370: Apex Orchard (A), Camp Apex (B), Springbrook Campground (C), Shelburne Fire Department Station 1 Headquarters (D), Buckland Fire District (E), Shelburne Falls Fire District (F), Arms Library Association Library (G). Display/hide their locations on the map
Cemeteries: South Cemetery (1), Hawks Cemetery (2), Hill Cemetery (3), Skinner Cemetery (4), Shelburne Center Cemetery (5), Jones Cemetery (6), North Shirkshire Cemetery (7). Display/hide their locations on the map
Reservoirs: Deerfield River Reservoir (A), Hillman Ice Pond (B), Gardner Falls Station Canal Reservoir (C), Deerfield River Reservoir (D), Number 3 Forebay Reservoir (E), Deerfield River Reservoir (F), Albert Davenport Pond (G), Deerfield River Reservoir (H). Display/hide their locations on the map
Streams, rivers, and creeks: Hawkes Brook (A), Great Brook (B), Dragon Brook (C), Bear River (D), First Brook (E), Clesson Brook (F), Clark Brook (G), Avery Brook (H), Smith Brook (I). Display/hide their locations on the map
In group quarters: 58 (-1 institutionalized population)
Size of family households: 485 2-persons, 284 3-persons, 158 4-persons, 41 5-persons, 16 6-persons, 7 7-or-more-persons
Size of nonfamily households: 646 1-person, 132 2-persons, 11 3-persons
343 married couples with children.
158 single-parent households (51 men, 107 women).
93.9% of residents of 01370 zip code speak English at home.
1.6% of residents speak Spanish at home (32% very well, 48% well, 20% not well).
3.0% of residents speak other Indo-European language at home (86% very well, 3% well, 11% not well).
1.0% of residents speak Asian or Pacific Island language at home (57% very well, 43% well).
0.8% of residents speak other language at home (100% very well).
Foreign born population: 182 (4.9%) (78.9% of them are naturalized citizens)
This zip code:
4.9%
Whole state:
18.0%
20%Chile
10%United Kingdom, excluding England and Scotland
9%Sweden
9%Czechoslovakia (includes Czech Republic and Slovakia)
8%Taiwan
6%Cambodia
4%France
30%English
11%American
6%Irish
5%French Canadian
5%German
4%Polish
4%Eastern European
Year of entry for the foreign-born population
362010 or later
392000 to 2009
51990 to 1999
142Before 1990
Facilities with environmental interests located in this zip code:
BUCKLAND-SHELBURNE REG (75 MECHANIC STREET in SHELBURNE FALLS, MA)
(National Center for Education Statistics) - STATE ID-717005 Organizations: MOHAWK TRAIL (SCHOOL DISTRICT)
MOHAWK TRAIL REG HIGH (26 ASHFIELD ROAD in SHELBURNE FALLS, MA)
(National Center for Education Statistics) - STATE ID-717505
MAYHEW STEEL PRODUCT (2 SEARS ST in SHELBURNE, MA)
AIR MINOR (AIRS/AFS) CRITERIA AND HAZARDOUS AIR POLLUTANT INVENTORY (Inventory of air pollution sources) Small Quantity Generators, between 100 kg and 1000 kg of hazardous waste/month (Resource Conservation and Recovery Act (tracking hazardous waste)) - notification Business SIC classification: HAND AND EDGE TOOLS, EXCEPT MACHINE TOOLS AND HANDSAWS Organizations: MAYHEW STEEL PRODUCTS INC (CONTACT/OWNER)
MOHAWK TRAIL REGIONAL HIGH SCHOOL (RTE 112 ASHFIELD STAR RTE in SHELBURNE, MA)
(Resource Conservation and Recovery Act (tracking hazardous waste)) Organizations: BUCKLAND REG SCH DIS (CONTACT/OPERATOR)
, MOHAWK TRAIL REGIONAL SCHOOL (CONTACT/OWNER)
MILLERS GARAGE (WINDY HILL RD in SHELBURNE, MA)
(Resource Conservation and Recovery Act (tracking hazardous waste)) Organizations: MILLER ROBERT A (CONTACT/OWNER)
MOHAWK AUTOMOTIVE ELECTRIC (27 ELM ST in SHELBURNE, MA)
(Resource Conservation and Recovery Act (tracking hazardous waste)) Organizations: WILLIAM POULIN (CONTACT/OWNER)
MAYHEW STEEL PRODUCT (DEEEFIELD AVENUE in SHELBURNE, MA)
AIR MINOR (AIRS/AFS) CRITERIA AND HAZARDOUS AIR POLLUTANT INVENTORY (Inventory of air pollution sources) Business SIC classification: HAND AND EDGE TOOLS, EXCEPT MACHINE TOOLS AND HANDSAWS
JF ALLEN CO (3 PECKVILLE RD in SHELBURNE, MA)
Conditionally Exempt Small Quantity Generators, less than 100 kg/month of hazardous waste (Resource Conservation and Recovery Act (tracking hazardous waste)) - notification Organizations: JOHN F ALLEN (CONTACT/OWNER)
Alternative names: ALLEN J F CO
Housing units lacking complete kitchen facilities: 0.1%
56.8%Fuel oil, kerosene, etc.
19.2%Wood
12.3%Bottled, tank, or LP gas
7.2%Electricity
2.5%Utility gas
2.4%Other fuel
Population in 1990: 4,525.
Place of birth for U.S.-born residents:
This state: 2,394
Northeast: 663
Midwest: 107
South: 162
West: 144
62% of the 01370 zip code residents lived in the same house 5 years ago. Out of people who lived in different houses, 66% lived in this county. Out of people who lived in different counties, 50% lived in Massachusetts.
96% of the 01370 zip code residents lived in the same house 1 year ago. Out of people who lived in different houses, 46% moved from this county. Out of people who lived in different houses, 40% moved from different county within same state. Out of people who lived in different houses, 15% moved from different state.
Private vs. public school enrollment:
Students in private schools in grades 1 to 8 (elementary and middle school): 22
Here:
8.5%
Massachusetts:
10.3%
Students in private schools in grades 9 to 12 (high school): 27
Here:
22.6%
Massachusetts:
12.3%
Students in private undergraduate colleges: 2
Here:
4.8%
Massachusetts:
51.2%
Occupation by median earnings in the past 12 months ($)
115,812Computer and mathematical occupations
93,547Health technologists and technicians
84,292Architecture and engineering occupations
77,893Business and financial operations occupations
69,461Education, training, and library occupations
63,043Health diagnosing and treating practitioners and other technical occupations
Top industries in this zip code by the number of employees in 2005:
Detailed PMIC statistics for the following Tracts:0415.00
2002 - 2018 National Fire Incident Reporting System (NFIRS) incidents
Based on the data from the years 2002 - 2018 the average number of fires per year is 18. The highest number of fires - 32 took place in 2013, and the least - 5 in 2014. The data has a dropping trend.
When looking into fire subcategories, the most incidents belonged to: Structure Fires (52.3%), and Outside Fires (30.3%).
Fire incident types reported to NFIRS in Zip Code 01370


 Nearest zip codes: 01341, 01338, 01340, 01330, 01342, 01301.


 Based on the data from the years 2002 - 2018 the average number of fires per year is 18. The highest number of fires - 32 took place in 2013, and the least - 5 in 2014. The data has a dropping trend.
 When looking into fire subcategories, the most incidents belonged to: Structure Fires (52.3%), and Outside Fires (30.3%).