Estimated zip code population in 2022: 2,535 Zip code population in 2010: 2,329 Zip code population in 2000: 3,639
Houses and condos: 1,901 Renter-occupied apartments: 258
% of renters here:
26%
State:
28%
March 2022 cost of living index in zip code 03814: 99.1 (near average, U.S. average is 100)
Land area: 31.7 sq. mi. Water area: 4.4 sq. mi.
Population density: 80 people per square mile
(very low).
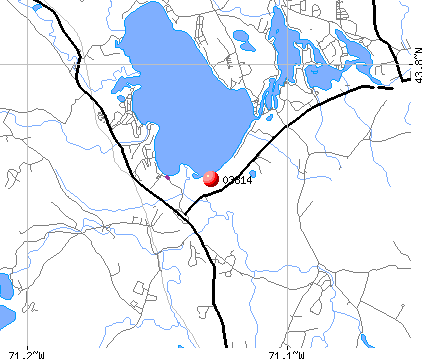
OSM Map
Google Map
MSN Map
OSM Map
General Map
Google Map
MSN Map
OSM Map
Google Map
MSN Map
OSM Map
Google Map
MSN Map
Please wait while loading the map...
Real estate property taxes paid for housing units in 2022:
This zip code:
1.4% ($3,762)
New Hampshire:
1.6% ($6,209)
Median real estate property taxes paid for housing units with mortgages in 2022: $3,382 (1.3%) Median real estate property taxes paid for housing units with no mortgage in 2022: $4,518 (1.4%)
Averages for the 2020 tax year for zip code 03814, filed in 2021:
Average Adjusted Gross Income (AGI) in 2020: $56,375 (Individual Income Tax Returns)
Here:
$56,375
State:
$88,845
Salary/wage: $47,308 (reported on 78.5% of returns)
Here:
$47,308
State:
$71,693
(% of AGI for various income ranges: 1105.6% for AGIs below $25k, 3486.4% for AGIs $25k-50k, 5712.0% for AGIs $50k-75k, 8540.0% for AGIs $75k-100k, 14247.1% for AGIs $100k-200k)
Taxable interest for individuals: $1,039 (reported on 25.6% of returns)
This zip code:
$1,039
New Hampshire:
$1,640
(% of AGI for various income ranges: 7.2% for AGIs below $25k, 10.7% for AGIs $25k-50k, 32.7% for AGIs $50k-75k, 105.0% for AGIs $75k-100k, 127.1% for AGIs $100k-200k)
Ordinary dividends: $5,560 (reported on 16.5% of returns)
Here:
$5,560
State:
$8,258
(% of AGI for various income ranges: 22.4% for AGIs below $25k, 41.8% for AGIs $25k-50k, 36.7% for AGIs $50k-75k, 198.8% for AGIs $75k-100k, 648.6% for AGIs $100k-200k)
Net capital gain/loss in AGI: +$16,633 (reported on 14.9% of returns)
Here:
+$16,633
State:
+$28,952
(% of AGI for various income ranges: 14.8% for AGIs below $25k, 27.1% for AGIs $25k-50k, 297.5% for AGIs $75k-100k, 3791.4% for AGIs $100k-200k)
Profit/loss from business: +$13,247 (reported on 15.7% of returns)
Here:
+$13,247
State:
+$24,424
(% of AGI for various income ranges: 214.0% for AGIs below $25k, 235.4% for AGIs $25k-50k, 174.7% for AGIs $50k-75k, 597.5% for AGIs $75k-100k, 832.9% for AGIs $100k-200k)
Taxable individual retirement arrangement distribution: $21,118 (reported on 9.1% of returns)
03814:
$21,118
New Hampshire:
$21,952
(% of AGI for various income ranges: 105.2% for AGIs below $25k, 478.0% for AGIs $50k-75k, 1918.6% for AGIs $100k-200k)
Total itemized deductions: $28,760 (reported on 4.1% of returns)
Here:
$28,760
State:
$32,702
(% of AGI for various income ranges: 174.4% for AGIs below $25k, 1431.4% for AGIs $100k-200k)
Charity contributions: $2,325 (reported on 3.3% of returns)
Here:
$2,325
State:
$9,866
(% of AGI for various income ranges: 132.9% for AGIs $100k-200k)
Taxes paid: $8,280 (reported on 4.1% of returns)
03814:
$8,280
State:
$8,247
(% of AGI for various income ranges: 58.4% for AGIs below $25k, 382.9% for AGIs $100k-200k)
Earned income credit: $2,185 (reported on 16.5% of returns)
Here:
$2,185
State:
$1,831
(% of AGI for various income ranges: 102.8% for AGIs below $25k, 64.3% for AGIs $25k-50k)
Percentage of individuals using paid preparers for their 2020 taxes: 91.7%
Here:
92%
State:
92%
(% for various income ranges: 92.1% for AGIs below $25k, 91.7% for AGIs $25k-50k, 89.5% for AGIs $50k-75k, 91.7% for AGIs $75k-100k, 92.3% for AGIs $100k-200k, 100.0% for AGIs over 200k)
Averages for the 2012 tax year for zip code 03814, filed in 2013:
Average Adjusted Gross Income (AGI) in 2012: $41,135 (Individual Income Tax Returns)
Here:
$41,135
State:
$66,185
Salary/wage: $31,185 (reported on 79.6% of returns)
Here:
$31,185
State:
$55,674
(% of AGI for various income ranges: 67.5% for AGIs below $25k, 74.7% for AGIs $25k-50k, 73.0% for AGIs $50k-75k, 65.8% for AGIs $75k-100k, 32.4% for AGIs $100k-200k)
Taxable interest for individuals: $863 (reported on 25.0% of returns)
This zip code:
$863
New Hampshire:
$1,674
(% of AGI for various income ranges: 0.6% for AGIs below $25k, 0.3% for AGIs $25k-50k, 0.3% for AGIs $50k-75k, 0.4% for AGIs $75k-100k, 0.8% for AGIs $100k-200k)
Ordinary dividends: $5,129 (reported on 15.7% of returns)
Here:
$5,129
State:
$6,774
(% of AGI for various income ranges: 3.4% for AGIs below $25k, 1.8% for AGIs $25k-50k, 1.0% for AGIs $50k-75k, 1.1% for AGIs $75k-100k, 2.6% for AGIs $100k-200k)
Net capital gain/loss in AGI: +$8,064 (reported on 10.2% of returns)
Here:
+$8,064
State:
+$13,759
(% of AGI for various income ranges: 0.3% for AGIs $50k-75k, 1.4% for AGIs $75k-100k, 6.4% for AGIs $100k-200k)
Profit/loss from business: +$8,912 (reported on 15.7% of returns)
Here:
+$8,912
State:
+$19,298
(% of AGI for various income ranges: 9.0% for AGIs below $25k, 5.2% for AGIs $25k-50k, 4.5% for AGIs $50k-75k)
Taxable individual retirement arrangement distribution: $17,375 (reported on 11.1% of returns)
03814:
$17,375
New Hampshire:
$16,908
(% of AGI for various income ranges: 2.8% for AGIs below $25k, 1.9% for AGIs $25k-50k, 6.3% for AGIs $50k-75k, 9.1% for AGIs $100k-200k)
Total itemized deductions: $18,308 (24% of AGI, reported on 23.1% of returns)
Here:
$18,308
State:
$22,617
Here:
24.1% of AGI
State:
18.1% of AGI
(% of AGI for various income ranges: 11.3% for AGIs below $25k, 9.0% for AGIs $25k-50k, 9.8% for AGIs $50k-75k, 10.0% for AGIs $75k-100k, 11.4% for AGIs $100k-200k)
Charity contributions: $1,718 (reported on 15.7% of returns)
Here:
$1,718
State:
$2,860
(% of AGI for various income ranges: 0.2% for AGIs below $25k, 0.5% for AGIs $25k-50k, 0.6% for AGIs $50k-75k, 0.7% for AGIs $75k-100k, 1.1% for AGIs $100k-200k)
Taxes paid: $6,667 (reported on 22.2% of returns)
03814:
$6,667
State:
$8,830
(% of AGI for various income ranges: 2.8% for AGIs below $25k, 2.7% for AGIs $25k-50k, 3.5% for AGIs $50k-75k, 3.8% for AGIs $75k-100k, 4.8% for AGIs $100k-200k)
Earned income credit: $2,209 (reported on 21.3% of returns)
Here:
$2,209
State:
$1,863
(% of AGI for various income ranges: 6.0% for AGIs below $25k, 1.3% for AGIs $25k-50k)
Percentage of individuals using paid preparers for their 2012 taxes: 46.3%
Here:
46%
State:
45%
(% for various income ranges: 40.0% for AGIs below $25k, 46.4% for AGIs $25k-50k, 56.2% for AGIs $50k-75k, 57.1% for AGIs $75k-100k, 57.1% for AGIs $100k-200k)
Averages for the 2004 tax year for zip code 03814, filed in 2005:
Average Adjusted Gross Income (AGI) in 2004: $36,327 (Individual Income Tax Returns)
Here:
$36,327
State:
$54,348
Salary/wage: $29,789 (reported on 82.6% of returns)
Here:
$29,789
State:
$46,966
(% of AGI for various income ranges: 84.7% for AGIs below $10k, 74.9% for AGIs $10k-25k, 78.2% for AGIs $25k-50k, 76.6% for AGIs $50k-75k, 68.3% for AGIs $75k-100k, 39.0% for AGIs over 100k)
Taxable interest for individuals: $956 (reported on 38.2% of returns)
This zip code:
$956
New Hampshire:
$1,634
(% of AGI for various income ranges: 2.6% for AGIs below $10k, 1.9% for AGIs $10k-25k, 0.9% for AGIs $25k-50k, 0.7% for AGIs $50k-75k, 0.7% for AGIs $75k-100k, 1.0% for AGIs over 100k)
Taxable dividends: $2,380 (reported on 18.2% of returns)
Here:
$2,380
State:
$3,855
(% of AGI for various income ranges: 2.1% for AGIs below $10k, 1.5% for AGIs $10k-25k, 1.0% for AGIs $25k-50k, 0.7% for AGIs $50k-75k, 1.4% for AGIs $75k-100k, 1.6% for AGIs over 100k)
Net capital gain/loss: +$12,566 (reported on 14.7% of returns)
Here:
+$12,566
State:
+$13,739
(% of AGI for various income ranges: 1.0% for AGIs below $10k, 0.3% for AGIs $10k-25k, 1.3% for AGIs $25k-50k, 2.5% for AGIs $50k-75k, 1.5% for AGIs $75k-100k, 17.2% for AGIs over 100k)
Profit/loss from business: +$10,474 (reported on 19.0% of returns)
Here:
+$10,474
State:
+$16,641
(% of AGI for various income ranges: 11.8% for AGIs below $10k, 6.9% for AGIs $10k-25k, 5.3% for AGIs $25k-50k, 4.7% for AGIs $50k-75k, 2.9% for AGIs $75k-100k, 6.2% for AGIs over 100k)
IRA payment deduction: $2,921 (reported on 4.4% of returns)
03814:
$2,921
New Hampshire:
$3,013
(% of AGI for various income ranges: 0.6% for AGIs $10k-25k, 0.2% for AGIs $25k-50k, 0.5% for AGIs $50k-75k, 1.0% for AGIs $75k-100k)
Total itemized deductions: $15,264 (22% of AGI, reported on 22.3% of returns)
Here:
$15,264
State:
$18,832
Here:
22.2% of AGI
State:
19.6% of AGI
(% of AGI for various income ranges: 14.6% for AGIs below $10k, 9.0% for AGIs $10k-25k, 9.3% for AGIs $25k-50k, 9.0% for AGIs $50k-75k, 12.2% for AGIs $75k-100k, 8.1% for AGIs over 100k)
Charity contributions deductions: $2,053 (3% of AGI, reported on 17.1% of returns)
Here:
$2,053
State:
$2,473
Here:
2.8% of AGI
State:
2.4% of AGI
(% of AGI for various income ranges: 0.7% for AGIs $10k-25k, 0.5% for AGIs $25k-50k, 1.1% for AGIs $50k-75k, 1.9% for AGIs $75k-100k, 1.2% for AGIs over 100k)
Total tax: $4,710 (reported on 75.6% of returns)
03814:
$4,710
State:
$8,835
(% of AGI for various income ranges: 3.6% for AGIs below $10k, 4.4% for AGIs $10k-25k, 7.1% for AGIs $25k-50k, 8.9% for AGIs $50k-75k, 11.3% for AGIs $75k-100k, 17.1% for AGIs over 100k)
Earned income credit: $1,453 (reported on 18.5% of returns)
Here:
$1,453
State:
$1,447
Percentage of individuals using paid preparers for their 2004 taxes: 54.4%
Here:
54%
State:
51%
(% for various income ranges: 45.7% for AGIs below $10k, 51.9% for AGIs $10k-25k, 58.0% for AGIs $25k-50k, 61.3% for AGIs $50k-75k, 52.4% for AGIs $75k-100k, 70.7% for AGIs over 100k)
Likely homosexual households (counted as self-reported same-sex unmarried-partner households)
Lesbian couples: 0.0% of all households
Gay men: 2.7% of all households
Household received Food Stamps/SNAP in the past 12 months: 95 Household did not receive Food Stamps/SNAP in the past 12 months: 892
Women who had a birth in the past 12 months: 41 (28 now married, 12 unmarried) Women who did not have a birth in the past 12 months: 317 (241 now married, 78 unmarried)
Housing units in zip code 03814 with a mortgage: 440 (14 second mortgage, 15 both second mortgage and home equity loan) Median monthly owner costs for units with a mortgage: $1,744 Median monthly owner costs for units without a mortgage: $745
Residents with income below the poverty level in 2022:
This zip code:
4.0%
Whole state:
7.2%
Residents with income below 50% of the poverty level in 2022:
This zip code:
3.1%
Whole state:
3.7%
Median number of rooms in houses and condos:
Here:
5.8
State:
6.4
Median number of rooms in apartments:
Here:
3.9
State:
4.0
Notable locations in this zip code not listed on our city pages
Notable locations in zip code 03814: Camp Weetamoe (A), Camp Calumet (B), Camp Winnemont (C), Deer Cap Campground (D), Deer Cap Ski Touring Center (E), Indian Mound Golf Course (F), Center Ossipee Fire and Rescue (G). Display/hide their locations on the map
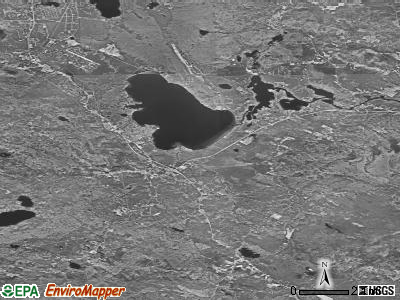
Lakes and reservoirs: Bean Pond (A), Conner Pond (B), Heath Pond (C), Little Dan Hole Pond (D), Moody Pond (E), Dan Hole River Reservoir (F), Dan Hole Pond (G). Display/hide their locations on the map
Streams, rivers, and creeks: Bearcamp River (A), Red Brook (B), West Branch (C), Pine River (D), Phillips Brook (E), Lovell River (F), Gile Brook (G), Folsom Brook (H), Dan Hole River (I). Display/hide their locations on the map
Facilities with environmental interests located in this zip code:
EFFINGHAM ELEMENTARY SCHOOL (RR 1 330A in CENTER OSSIPEE, NH)
(Geographic Names Information System) (National Center for Education Statistics) - STATE ID-14920816122395 Organizations: GOVERNOR WENTWORTH REG SCHOOL DISTRICT (SCHOOL DISTRICT)
OSSIPEE CENTRAL SCHOOL (68 MAIN ST in CENTER OSSIPEE, NH)
(Geographic Names Information System) (National Center for Education Statistics) - STATE ID-14920841922405 Organizations: GOVERNOR WENTWORTH REG SCHOOL DISTRICT (SCHOOL DISTRICT)
OSSIPEE CHIPPING (400 ROUTE 25 in CENTER OSSIPEE, NH)
AIR MINOR (AIRS/AFS) CRITERIA AND HAZARDOUS AIR POLLUTANT INVENTORY (Inventory of air pollution sources) Business SIC classification: SAWMILLS AND PLANING MILLS, GENERAL
OSSIPEE, TOWN OF (41 CHICKVILLE ROAD in CENTER OSSIPEE, NH)
AIR MINOR (AIRS/AFS) Business SIC classification: AIR AND WATER RESOURCE AND SOLID WASTE MANAGEMENT
D & A AUTO BODY NORTH (OLD RTE 16 in CENTER OSSIPEE, NH)
Conditionally Exempt Small Quantity Generators, less than 100 kg/month of hazardous waste (Resource Conservation and Recovery Act (tracking hazardous waste)) Organizations: DAVID A LEO (CONTACT/OWNER)
Alternative names: BUFFING WHEEL AUTO BODY
OSSIPEE CENTRAL SCHOOL (SAU #49) (MAIN STREET PO BOX 68 in CENTER OSSIPEE, NH)
COMPLIANCE ACTIVITY (Tracking inspections of insecticide, fungicide, and rodenticide, and toxic substances)
50.1%Fuel oil, kerosene, etc.
26.5%Bottled, tank, or LP gas
14.1%Wood
7.9%Electricity
1.6%Other fuel
Population in 1990: 2,492. Population change in the 1990s: +1,147 (+46.0%).
Place of birth for U.S.-born residents:
This state: 1,256
Northeast: 972
Midwest: 31
South: 28
West: 146
61% of the 03814 zip code residents lived in the same house 5 years ago. Out of people who lived in different houses, 45% lived in this county. Out of people who lived in different counties, 50% lived in New Hampshire.
89% of the 03814 zip code residents lived in the same house 1 year ago. Out of people who lived in different houses, 82% moved from this county. Out of people who lived in different houses, 10% moved from abroad.
Private vs. public school enrollment:
Students in private schools in grades 1 to 8 (elementary and middle school):
Here:
0.0%
New Hampshire:
11.4%
Students in private schools in grades 9 to 12 (high school):
Here:
0.0%
New Hampshire:
14.0%
Students in private undergraduate colleges: 14
Here:
100.0%
New Hampshire:
38.0%
Occupation by median earnings in the past 12 months ($)
105,502Installation, maintenance, and repair occupations
46,618Production occupations
29,969Health technologists and technicians
29,009Office and administrative support occupations
28,994Construction and extraction occupations
21,863Sales and related occupations
Top industries in this zip code by the number of employees in 2005:
Health Care and Social Assistance: Services for the Elderly and Persons with Disabilities (50-99 employees: 1 establishment)
Accommodation and Food Services: Full-Service Restaurants (20-49: 1, 5-9: 1)
Finance and Insurance: Insurance Agencies and Brokerages (20-49: 1)
Health Care and Social Assistance: Community Food Services (20-49: 1)
Other Services (except Public Administration): Religious Organizations (10-19: 1, 1-4: 2)
89 people in other noninstitutional group quarters
14 people in nursing homes
Fatal accident statistics in 2011:
Fatal accident count: 1
Vehicles involved in fatal accidents: 1
Fatal accidents caused by drunken drivers: 0
Fatalities: 1
Persons involved in fatal accidents: 1
Pedestrians involved in fatal accidents: 0
Fatal accident statistics in 2010:
Fatal accident count: 2
Vehicles involved in fatal accidents: 3
Fatal accidents caused by drunken drivers: 0
Fatalities: 2
Persons involved in fatal accidents: 3
Pedestrians involved in fatal accidents: 0
2002 - 2018 National Fire Incident Reporting System (NFIRS) incidents
According to the data from the years 2002 - 2018 the average number of fire incidents per year is 18. The highest number of fires - 37 took place in 2017, and the least - 1 in 2006. The data has a growing trend.
When looking into fire subcategories, the most reports belonged to: Structure Fires (67.2%), and Outside Fires (18.7%).
Fire incident types reported to NFIRS in Zip Code 03814


 Nearest zip codes: 03890, 03816, 03864, 03875, 03817, 03836.


 (Students: 330, Location: 68 MAIN ST., Grades: PK-6)


 According to the data from the years 2002 - 2018 the average number of fire incidents per year is 18. The highest number of fires - 37 took place in 2017, and the least - 1 in 2006. The data has a growing trend.
 When looking into fire subcategories, the most reports belonged to: Structure Fires (67.2%), and Outside Fires (18.7%).