Estimated zip code population in 2022: 5,781 Zip code population in 2010: 5,542 Zip code population in 2000: 4,804
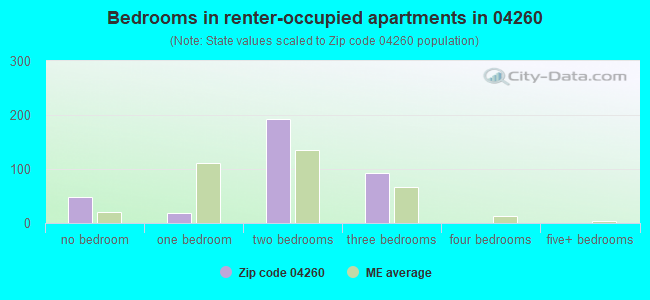
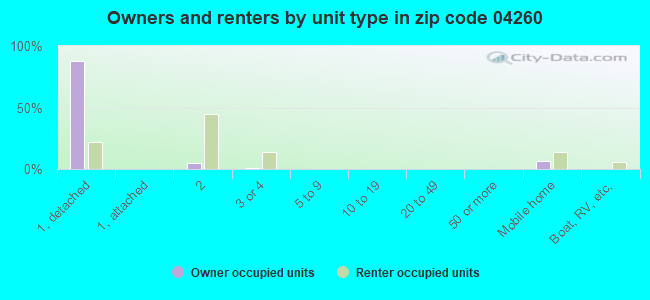
Houses and condos: 2,289 Renter-occupied apartments: 348
% of renters here:
16%
State:
26%
March 2022 cost of living index in zip code 04260: 87.8 (less than average, U.S. average is 100)
Land area: 47.1 sq. mi. Water area: 0.7 sq. mi.
Population density: 123 people per square mile
(very low).
OSM Map
Google Map
MSN Map
OSM Map
General Map
Google Map
MSN Map
OSM Map
Google Map
MSN Map
OSM Map
Google Map
MSN Map
Please wait while loading the map...
Real estate property taxes paid for housing units in 2022:
This zip code:
0.9% ($3,174)
Maine:
1.0% ($2,785)
Median real estate property taxes paid for housing units with mortgages in 2022: $3,125 (0.9%) Median real estate property taxes paid for housing units with no mortgage in 2022: $3,303 (0.9%)
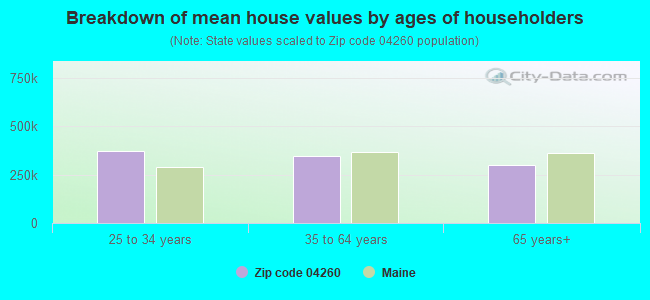
Estimated median house/condo value in 2022: $356,009
04260:
$356,009
Maine:
$290,600
According to our research of Maine and other state lists, there were 8 registered sex offenders living in 04260 zip code as of April 26, 2024. The ratio of all residents to sex offenders in zip code 04260 is 717 to 1. The ratio of registered sex offenders to all residents in this zip code is lower than the state average.
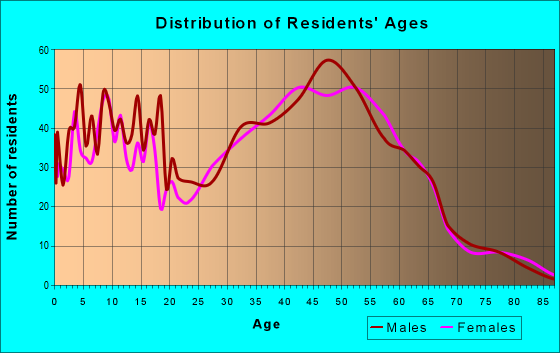
Median resident age:
This zip code:
44.0 years
Maine median age:
45.1 years
Average household size:
This zip code:
2.6 people
Maine:
2.2 people
Averages for the 2020 tax year for zip code 04260, filed in 2021:
Average Adjusted Gross Income (AGI) in 2020: $71,596 (Individual Income Tax Returns)
Here:
$71,596
State:
$68,227
Salary/wage: $60,882 (reported on 86.1% of returns)
Here:
$60,882
State:
$55,127
(% of AGI for various income ranges: 1333.0% for AGIs below $25k, 3856.3% for AGIs $25k-50k, 6792.4% for AGIs $50k-75k, 9882.9% for AGIs $75k-100k, 19189.7% for AGIs $100k-200k, 79453.3% for AGIs over 200k)
Taxable interest for individuals: $755 (reported on 38.0% of returns)
This zip code:
$755
Maine:
$1,162
(% of AGI for various income ranges: 14.0% for AGIs below $25k, 12.3% for AGIs $25k-50k, 24.9% for AGIs $50k-75k, 71.2% for AGIs $75k-100k, 76.0% for AGIs $100k-200k, 790.0% for AGIs over 200k)
Ordinary dividends: $5,308 (reported on 16.8% of returns)
Here:
$5,308
State:
$7,695
(% of AGI for various income ranges: 15.8% for AGIs below $25k, 38.6% for AGIs $25k-50k, 63.0% for AGIs $50k-75k, 117.9% for AGIs $75k-100k, 292.7% for AGIs $100k-200k, 3380.0% for AGIs over 200k)
Net capital gain/loss in AGI: +$14,349 (reported on 14.9% of returns)
Here:
+$14,349
State:
+$22,201
(% of AGI for various income ranges: 8.4% for AGIs below $25k, 38.2% for AGIs $25k-50k, 158.1% for AGIs $50k-75k, 235.8% for AGIs $75k-100k, 613.0% for AGIs $100k-200k, 10690.0% for AGIs over 200k)
Profit/loss from business: +$13,213 (reported on 14.9% of returns)
Here:
+$13,213
State:
+$15,095
(% of AGI for various income ranges: 153.2% for AGIs below $25k, 225.3% for AGIs $25k-50k, 282.7% for AGIs $50k-75k, 324.2% for AGIs $75k-100k, 653.0% for AGIs $100k-200k, 376.7% for AGIs over 200k)
Taxable individual retirement arrangement distribution: $17,965 (reported on 8.6% of returns)
04260:
$17,965
Maine:
$18,314
(% of AGI for various income ranges: 56.2% for AGIs below $25k, 85.8% for AGIs $25k-50k, 196.5% for AGIs $50k-75k, 248.7% for AGIs $75k-100k, 859.0% for AGIs $100k-200k)
Total itemized deductions: $23,700 (reported on 6.9% of returns)
Here:
$23,700
State:
$31,197
(% of AGI for various income ranges: 150.9% for AGIs $25k-50k, 222.7% for AGIs $50k-75k, 307.9% for AGIs $75k-100k, 515.3% for AGIs $100k-200k, 3360.0% for AGIs over 200k)
Charity contributions: $7,825 (reported on 4.0% of returns)
Here:
$7,825
State:
$9,863
(% of AGI for various income ranges: 47.3% for AGIs $50k-75k, 124.3% for AGIs $100k-200k, 1303.3% for AGIs over 200k)
Taxes paid: $7,652 (reported on 6.9% of returns)
04260:
$7,652
State:
$8,241
(% of AGI for various income ranges: 26.7% for AGIs $25k-50k, 87.0% for AGIs $50k-75k, 129.6% for AGIs $75k-100k, 184.0% for AGIs $100k-200k, 900.0% for AGIs over 200k)
Earned income credit: $1,878 (reported on 10.6% of returns)
Here:
$1,878
State:
$1,960
(% of AGI for various income ranges: 62.8% for AGIs below $25k, 50.4% for AGIs $25k-50k)
Percentage of individuals using paid preparers for their 2020 taxes: 92.1%
Here:
92%
State:
92%
(% for various income ranges: 90.8% for AGIs below $25k, 92.0% for AGIs $25k-50k, 90.2% for AGIs $50k-75k, 91.4% for AGIs $75k-100k, 96.3% for AGIs $100k-200k, 91.7% for AGIs over 200k)
Averages for the 2012 tax year for zip code 04260, filed in 2013:
Average Adjusted Gross Income (AGI) in 2012: $57,907 (Individual Income Tax Returns)
Here:
$57,907
State:
$52,375
Salary/wage: $51,573 (reported on 90.3% of returns)
Here:
$51,573
State:
$43,415
(% of AGI for various income ranges: 78.4% for AGIs below $25k, 83.2% for AGIs $25k-50k, 83.7% for AGIs $50k-75k, 88.0% for AGIs $75k-100k, 82.1% for AGIs $100k-200k, 63.8% for AGIs over 200k)
Taxable interest for individuals: $622 (reported on 30.5% of returns)
This zip code:
$622
Maine:
$1,221
(% of AGI for various income ranges: 0.5% for AGIs below $25k, 0.5% for AGIs $25k-50k, 0.3% for AGIs $50k-75k, 0.2% for AGIs $75k-100k, 0.4% for AGIs $100k-200k, 0.3% for AGIs over 200k)
Ordinary dividends: $3,000 (reported on 18.1% of returns)
Here:
$3,000
State:
$5,812
(% of AGI for various income ranges: 1.4% for AGIs below $25k, 0.7% for AGIs $25k-50k, 0.6% for AGIs $50k-75k, 0.4% for AGIs $75k-100k, 1.4% for AGIs $100k-200k, 1.2% for AGIs over 200k)
Net capital gain/loss in AGI: +$4,661 (reported on 12.0% of returns)
Here:
+$4,661
State:
+$11,897
(% of AGI for various income ranges: 0.5% for AGIs $25k-50k, 0.4% for AGIs $50k-75k, 0.1% for AGIs $75k-100k, 1.7% for AGIs $100k-200k, 2.3% for AGIs over 200k)
Profit/loss from business: +$9,391 (reported on 17.4% of returns)
Here:
+$9,391
State:
+$12,144
(% of AGI for various income ranges: 8.9% for AGIs below $25k, 3.1% for AGIs $25k-50k, 3.4% for AGIs $50k-75k, 2.3% for AGIs $75k-100k, 2.7% for AGIs $100k-200k)
Taxable individual retirement arrangement distribution: $13,170 (reported on 7.7% of returns)
04260:
$13,170
Maine:
$13,385
(% of AGI for various income ranges: 1.7% for AGIs below $25k, 1.9% for AGIs $25k-50k, 1.8% for AGIs $50k-75k, 1.1% for AGIs $75k-100k, 3.2% for AGIs $100k-200k)
Total itemized deductions: $19,203 (20% of AGI, reported on 39.8% of returns)
Here:
$19,203
State:
$21,859
Here:
19.7% of AGI
State:
20.9% of AGI
(% of AGI for various income ranges: 6.9% for AGIs below $25k, 11.0% for AGIs $25k-50k, 12.9% for AGIs $50k-75k, 15.6% for AGIs $75k-100k, 15.9% for AGIs $100k-200k, 11.4% for AGIs over 200k)
Charity contributions: $2,049 (reported on 29.3% of returns)
Here:
$2,049
State:
$2,741
(% of AGI for various income ranges: 0.3% for AGIs below $25k, 0.6% for AGIs $25k-50k, 1.1% for AGIs $50k-75k, 1.0% for AGIs $75k-100k, 1.6% for AGIs $100k-200k, 0.9% for AGIs over 200k)
Taxes paid: $8,894 (reported on 39.4% of returns)
04260:
$8,894
State:
$9,996
(% of AGI for various income ranges: 1.9% for AGIs below $25k, 3.4% for AGIs $25k-50k, 4.9% for AGIs $50k-75k, 6.5% for AGIs $75k-100k, 8.1% for AGIs $100k-200k, 7.9% for AGIs over 200k)
Earned income credit: $1,954 (reported on 15.1% of returns)
Here:
$1,954
State:
$1,959
(% of AGI for various income ranges: 5.3% for AGIs below $25k, 0.9% for AGIs $25k-50k)
Percentage of individuals using paid preparers for their 2012 taxes: 42.9%
Here:
43%
State:
48%
(% for various income ranges: 34.9% for AGIs below $25k, 42.4% for AGIs $25k-50k, 43.2% for AGIs $50k-75k, 50.0% for AGIs $75k-100k, 51.6% for AGIs $100k-200k, 80.0% for AGIs over 200k)
Averages for the 2004 tax year for zip code 04260, filed in 2005:
Average Adjusted Gross Income (AGI) in 2004: $46,509 (Individual Income Tax Returns)
Here:
$46,509
State:
$42,606
Salary/wage: $41,910 (reported on 89.7% of returns)
Here:
$41,910
State:
$36,376
(% of AGI for various income ranges: 103.9% for AGIs below $10k, 77.9% for AGIs $10k-25k, 85.8% for AGIs $25k-50k, 86.9% for AGIs $50k-75k, 88.8% for AGIs $75k-100k, 67.0% for AGIs over 100k)
Taxable interest for individuals: $1,096 (reported on 45.6% of returns)
This zip code:
$1,096
Maine:
$1,367
(% of AGI for various income ranges: 3.7% for AGIs below $10k, 1.6% for AGIs $10k-25k, 0.6% for AGIs $25k-50k, 0.5% for AGIs $50k-75k, 0.5% for AGIs $75k-100k, 1.9% for AGIs over 100k)
Taxable dividends: $2,501 (reported on 19.8% of returns)
Here:
$2,501
State:
$3,533
(% of AGI for various income ranges: 2.9% for AGIs below $10k, 1.1% for AGIs $10k-25k, 0.4% for AGIs $25k-50k, 0.9% for AGIs $50k-75k, 0.4% for AGIs $75k-100k, 2.1% for AGIs over 100k)
Net capital gain/loss: +$8,659 (reported on 15.9% of returns)
Here:
+$8,659
State:
+$11,433
(% of AGI for various income ranges: -1.5% for AGIs below $10k, 0.8% for AGIs $10k-25k, 0.5% for AGIs $25k-50k, 1.1% for AGIs $50k-75k, 1.3% for AGIs $75k-100k, 8.1% for AGIs over 100k)
Profit/loss from business: +$10,061 (reported on 19.1% of returns)
Here:
+$10,061
State:
+$10,755
(% of AGI for various income ranges: 10.7% for AGIs below $10k, 7.3% for AGIs $10k-25k, 6.4% for AGIs $25k-50k, 3.7% for AGIs $50k-75k, 1.9% for AGIs $75k-100k, 2.9% for AGIs over 100k)
IRA payment deduction: $2,652 (reported on 3.7% of returns)
04260:
$2,652
Maine:
$3,014
(% of AGI for various income ranges: 0.5% for AGIs $25k-50k, 0.1% for AGIs $50k-75k, 0.2% for AGIs $75k-100k, 0.1% for AGIs over 100k)
Self-employed pension: $6,067 (reported on 0.6% of returns)
Here:
$6,067
Maine:
$12,886
Total itemized deductions: $16,828 (22% of AGI, reported on 40.9% of returns)
Here:
$16,828
State:
$18,231
Here:
21.5% of AGI
State:
21.7% of AGI
(% of AGI for various income ranges: 7.5% for AGIs below $10k, 8.4% for AGIs $10k-25k, 12.1% for AGIs $25k-50k, 16.5% for AGIs $50k-75k, 18.1% for AGIs $75k-100k, 15.5% for AGIs over 100k)
Charity contributions deductions: $1,882 (2% of AGI, reported on 34.7% of returns)
Here:
$1,882
State:
$2,466
Here:
2.3% of AGI
State:
2.8% of AGI
(% of AGI for various income ranges: 0.7% for AGIs $10k-25k, 0.8% for AGIs $25k-50k, 1.3% for AGIs $50k-75k, 1.5% for AGIs $75k-100k, 2.2% for AGIs over 100k)
Total tax: $5,953 (reported on 80.9% of returns)
04260:
$5,953
State:
$6,047
(% of AGI for various income ranges: 3.4% for AGIs below $10k, 5.0% for AGIs $10k-25k, 6.9% for AGIs $25k-50k, 8.2% for AGIs $50k-75k, 9.4% for AGIs $75k-100k, 17.2% for AGIs over 100k)
Earned income credit: $1,616 (reported on 11.1% of returns)
Here:
$1,616
State:
$1,520
Percentage of individuals using paid preparers for their 2004 taxes: 47.1%
Here:
47%
State:
53%
(% for various income ranges: 31.7% for AGIs below $10k, 45.7% for AGIs $10k-25k, 49.6% for AGIs $25k-50k, 50.6% for AGIs $50k-75k, 49.6% for AGIs $75k-100k, 65.3% for AGIs over 100k)
Household received Food Stamps/SNAP in the past 12 months: 97 Household did not receive Food Stamps/SNAP in the past 12 months: 2,091
Women who had a birth in the past 12 months: 83 (82 now married, 0 unmarried) Women who did not have a birth in the past 12 months: 1,047 (546 now married, 500 unmarried)
Housing units in zip code 04260 with a mortgage: 1,171 (200 second mortgage, 203 both second mortgage and home equity loan) Median monthly owner costs for units with a mortgage: $1,835 Median monthly owner costs for units without a mortgage: $721
Residents with income below the poverty level in 2022:
This zip code:
2.3%
Whole state:
10.8%
Residents with income below 50% of the poverty level in 2022:
This zip code:
1.2%
Whole state:
5.8%
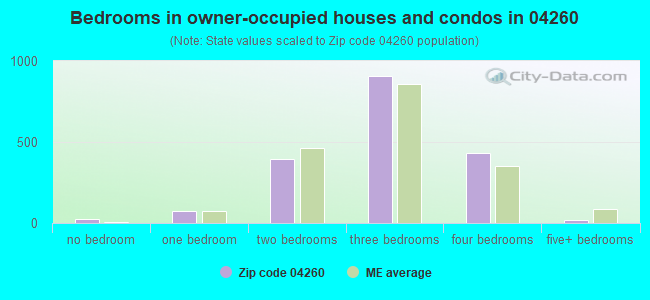
Median number of rooms in houses and condos:
Here:
6.3
State:
6.1
Median number of rooms in apartments:
Here:
3.9
State:
4.0
Notable locations in this zip code not listed on our city pages
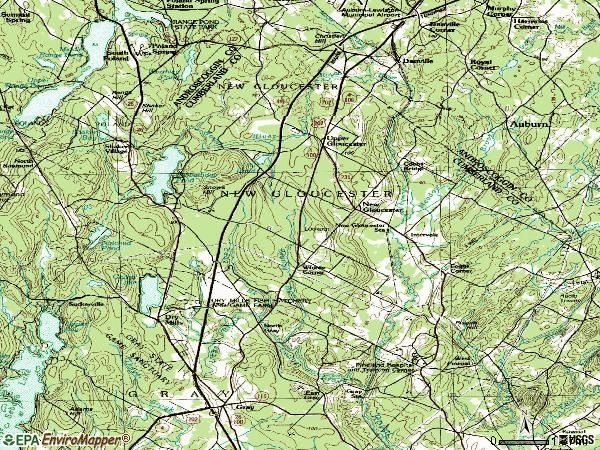
Notable locations in zip code 04260: New Gloucester Station (A), Cobbs Bridge (B), New Gloucester Fish Hatchery (C), New Gloucester Fire Department Station 2 (D), New Gloucester Public Library (E), New Gloucester Volunteer Fire / Rescue Department (F). Display/hide their locations on the map
Lakes, reservoirs, and swamps: Lily Pond (A), Sabbathday Pond (B), The Sinkhole (C), Royal River Reservoir (D), Brandy Bog (E). Display/hide their locations on the map
Streams, rivers, and creeks: Stevens Brook (A), Westcott Brook (B), Foster Brook (C), Meadow Brook (D), Mosquito Brook (E), Bear Brook (F). Display/hide their locations on the map
In group quarters: 37 (-1 institutionalized population)
Size of family households: 674 2-persons, 290 3-persons, 306 4-persons, 235 5-persons, 39 6-persons
Size of nonfamily households: 526 1-person, 81 2-persons, 25 4-persons
1,008 married couples with children.
59 single-parent households (59 men).
97.9% of residents of 04260 zip code speak English at home.
1.1% of residents speak other Indo-European language at home (100% very well).
0.3% of residents speak other language at home (100% very well).
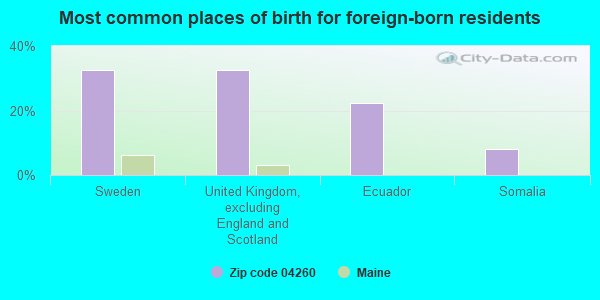
Foreign born population: 54 (0.9%) (92.3% of them are naturalized citizens)
This zip code:
0.9%
Whole state:
4.1%
33%Sweden
33%United Kingdom, excluding England and Scotland
22%Ecuador
8%Somalia
27%English
15%Irish
14%American
9%French
6%Scottish
4%Scandinavian
4%French Canadian
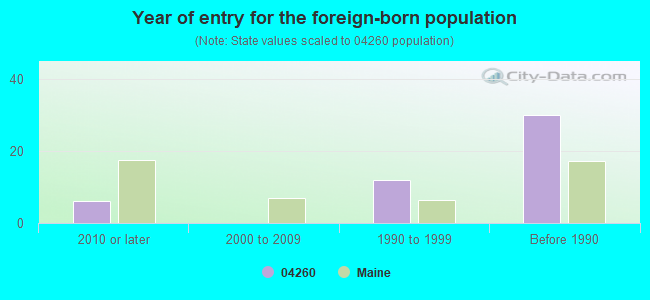
Year of entry for the foreign-born population
62010 or later
02000 to 2009
121990 to 1999
30Before 1990
Facilities with environmental interests located in this zip code:
BURCHARD A DUNN SCHOOL (667 MORSE ROAD in NEW GLOUCESTER, ME)
(National Center for Education Statistics) - STATE ID-29902 Organizations: MSAD 15 GRAY (SCHOOL DISTRICT)
MEMORIAL SCHOOL (RTE 231 PO BOX 131 in NEW GLOUCESTER, ME)
(National Center for Education Statistics) - STATE ID-29901 Organizations: MSAD 15 GRAY (SCHOOL DISTRICT)
NEW GLOUCESTER STATE FISH HAT INLAND FISHERIES AND WILDLIFE (RTS 100 AND US 202 in NEW GLOUCESTER, ME)
National Pollutant Discharge Elimination System NON-MAJOR (Tracking pollutant discharge elimination systems) - permit Business SIC classification: FISH HATCHERIES AND PRESERVES Organizations: NEW GLOUCESTER STATE FISH HATC (CONTACT/OWNER)
Alternative names: NEW GLOUCESTER FISH HATCHERY, NEW GLOUCESTER STATE FISH HAT., NEW GLOUCESTER STATE FISH HATC
PINELAND CENTER (ROUTE 231 in NEW GLOUCESTER, ME)
AIR MAJOR (AIRS/AFS) Small Quantity Generators, between 100 kg and 1000 kg of hazardous waste/month (Resource Conservation and Recovery Act (tracking hazardous waste)) - notification Business SIC classification: SPECIALTY HOSPITALS, EXCEPT PSYCHIATRIC Organizations: STATE OF MAINE (CONTACT/OWNER)
EASTGATE CHRISTIAN SCHOOL (68 COBBS BRIDGE ROAD in NEW GLOUCESTER, ME)
COMPLIANCE ACTIVITY (Tracking inspections of insecticide, fungicide, and rodenticide, and toxic substances) Alternative names: CHRISTIAN FELLOWSHIP INC
H. E. SARGENT (ROUTE 231? in NEW GLOUCESTER, ME)
AIR MAJOR (AIRS/AFS) Business SIC classification: ASPHALT PAVING MIXTURES AND BLOCKS
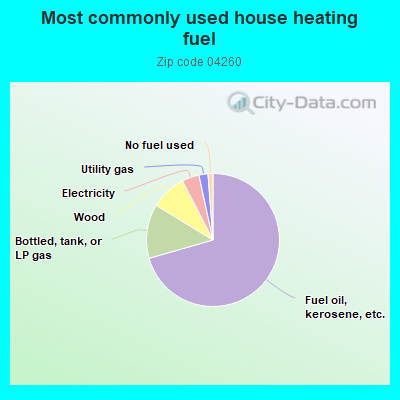
70.7%Fuel oil, kerosene, etc.
13.2%Bottled, tank, or LP gas
8.7%Wood
4.2%Electricity
2.2%Utility gas
1.2%No fuel used
Population in 1990: 3,916. Population change in the 1990s: +888 (+22.7%).
Place of birth for U.S.-born residents:
This state: 4,066
Northeast: 1,069
Midwest: 127
South: 323
West: 82
60% of the 04260 zip code residents lived in the same house 5 years ago. Out of people who lived in different houses, 68% lived in this county. Out of people who lived in different counties, 50% lived in Maine.
98% of the 04260 zip code residents lived in the same house 1 year ago. Out of people who lived in different houses, 29% moved from this county. Out of people who lived in different houses, 40% moved from different county within same state. Out of people who lived in different houses, 89% moved from different state.
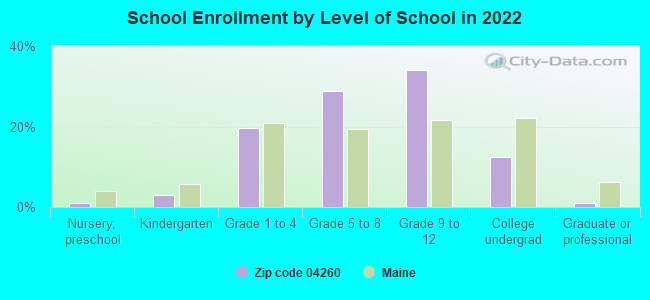
Private vs. public school enrollment:
Students in private schools in grades 1 to 8 (elementary and middle school): 37
Here:
6.5%
Maine:
12.7%
Students in private schools in grades 9 to 12 (high school): 68
Here:
17.2%
Maine:
12.6%
Students in private undergraduate colleges: 58
Here:
39.3%
Maine:
34.5%
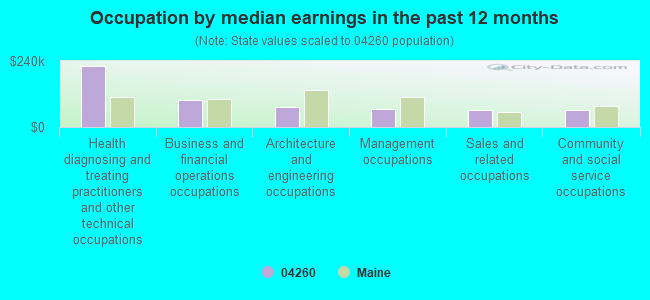
Occupation by median earnings in the past 12 months ($)
220,377Health diagnosing and treating practitioners and other technical occupations
99,729Business and financial operations occupations
73,255Architecture and engineering occupations
66,881Management occupations
62,157Sales and related occupations
60,263Community and social service occupations
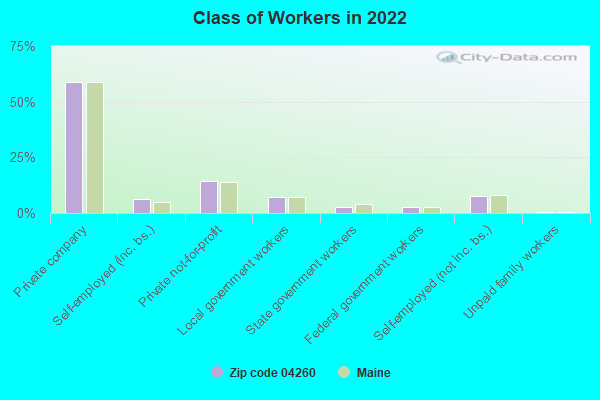
Top industries in this zip code by the number of employees in 2005:
Administrative and Support and Waste Management and Remediation Services: Office Administrative Services (250-499 employees: 1 establishment, 20-49 employees: 1 establishment)
Health Care and Social Assistance: Services for the Elderly and Persons with Disabilities (50-99: 1, 10-19: 1)
Health Care and Social Assistance: Other Residential Care Facilities (20-49: 1, 10-19: 1)
Construction: Other Building Equipment Contractors (20-49: 1, 5-9: 1)
Health Care and Social Assistance: Child Day Care Services (10-19: 1, 5-9: 2, 1-4: 4)
Health Care and Social Assistance: Residential Mental Retardation Facilities (10-19: 2, 1-4: 2)
Construction: New Single-Family Housing Construction (except Operative Builders) (5-9: 1, 1-4: 8)
People in group quarters in 2010:
14 people in group homes intended for adults
11 people in group homes for juveniles (non-correctional)
5 people in other noninstitutional facilities
People in group quarters in 2000:
10 people in nursing homes
8 people in religious group quarters
5 people in homes for the mentally retarded
Fatal accident statistics in 2013:
Fatal accident count: 1
Vehicles involved in fatal accidents: 1
Fatal accidents caused by drunken drivers: 1
Fatalities: 1
Persons involved in fatal accidents: 1
Pedestrians involved in fatal accidents: 0
Home Mortgage Disclosure Act Aggregated Statistics For Year 2009 (Based on 2 partial tracts)
A) FHA, FSA/RHS & VA Home Purchase Loans
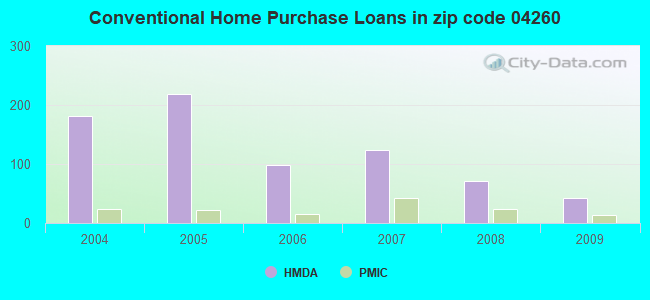
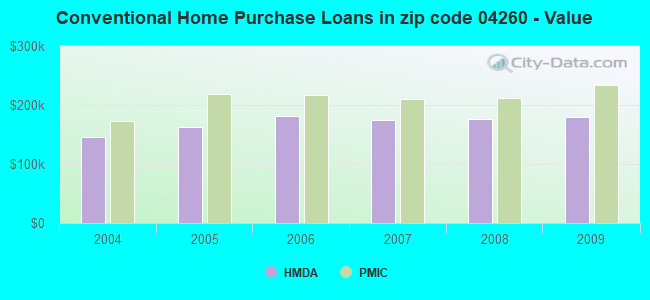
B) Conventional Home Purchase Loans
C) Refinancings
D) Home Improvement Loans
F) Non-occupant Loans on < 5 Family Dwellings (A B C & D)
G) Loans On Manufactured Home Dwelling (A B C & D)
Number
Average Value
Number
Average Value
Number
Average Value
Number
Average Value
Number
Average Value
Number
Average Value
LOANS ORIGINATED
34
$187,101
43
$179,975
288
$162,503
36
$86,691
9
$157,239
13
$84,230
APPLICATIONS APPROVED, NOT ACCEPTED
3
$137,660
8
$243,145
38
$177,708
7
$112,613
0
$0
4
$74,322
APPLICATIONS DENIED
5
$185,638
12
$171,737
120
$171,278
16
$71,632
3
$121,067
4
$87,775
APPLICATIONS WITHDRAWN
3
$138,557
3
$190,570
48
$181,630
7
$124,143
0
$0
1
$138,560
FILES CLOSED FOR INCOMPLETENESS
0
$0
0
$0
12
$209,963
0
$0
0
$0
0
$0
Aggregated Statistics For Year 2008 (Based on 2 partial tracts)
A) FHA, FSA/RHS & VA Home Purchase Loans
B) Conventional Home Purchase Loans
C) Refinancings
D) Home Improvement Loans
F) Non-occupant Loans on < 5 Family Dwellings (A B C & D)
G) Loans On Manufactured Home Dwelling (A B C & D)
Number
Average Value
Number
Average Value
Number
Average Value
Number
Average Value
Number
Average Value
Number
Average Value
LOANS ORIGINATED
20
$196,601
71
$175,444
183
$160,263
46
$39,069
20
$178,104
20
$68,672
APPLICATIONS APPROVED, NOT ACCEPTED
1
$363,200
15
$286,079
27
$175,324
8
$136,874
3
$231,373
4
$103,245
APPLICATIONS DENIED
5
$177,836
15
$165,908
100
$188,758
19
$75,331
3
$157,837
8
$91,810
APPLICATIONS WITHDRAWN
3
$107,167
9
$165,310
34
$175,311
5
$40,356
1
$166,800
3
$95,060
FILES CLOSED FOR INCOMPLETENESS
0
$0
1
$174,880
8
$221,958
0
$0
0
$0
0
$0
Aggregated Statistics For Year 2007 (Based on 2 partial tracts)
A) FHA, FSA/RHS & VA Home Purchase Loans
B) Conventional Home Purchase Loans
C) Refinancings
D) Home Improvement Loans
F) Non-occupant Loans on < 5 Family Dwellings (A B C & D)
G) Loans On Manufactured Home Dwelling (A B C & D)
Number
Average Value
Number
Average Value
Number
Average Value
Number
Average Value
Number
Average Value
Number
Average Value
LOANS ORIGINATED
16
$166,216
124
$174,518
218
$160,208
69
$59,111
11
$158,489
26
$81,074
APPLICATIONS APPROVED, NOT ACCEPTED
1
$199,090
12
$139,901
34
$127,913
7
$62,649
3
$141,693
4
$79,702
APPLICATIONS DENIED
3
$156,490
17
$170,128
104
$190,799
28
$46,361
3
$109,410
9
$55,003
APPLICATIONS WITHDRAWN
1
$320,160
13
$167,322
70
$162,385
16
$61,207
3
$164,113
3
$43,943
FILES CLOSED FOR INCOMPLETENESS
0
$0
7
$188,136
9
$201,780
3
$65,913
0
$0
0
$0
Aggregated Statistics For Year 2006 (Based on 2 partial tracts)
A) FHA, FSA/RHS & VA Home Purchase Loans
B) Conventional Home Purchase Loans
C) Refinancings
D) Home Improvement Loans
F) Non-occupant Loans on < 5 Family Dwellings (A B C & D)
G) Loans On Manufactured Home Dwelling (A B C & D)
Number
Average Value
Number
Average Value
Number
Average Value
Number
Average Value
Number
Average Value
Number
Average Value
LOANS ORIGINATED
9
$227,040
98
$181,245
257
$142,780
81
$63,407
12
$153,017
26
$74,814
APPLICATIONS APPROVED, NOT ACCEPTED
1
$279,800
19
$166,238
40
$110,104
7
$55,730
3
$81,160
3
$95,510
APPLICATIONS DENIED
1
$119,720
35
$142,207
153
$159,578
30
$121,203
8
$157,892
19
$76,252
APPLICATIONS WITHDRAWN
1
$199,090
20
$117,167
100
$172,320
11
$119,111
7
$128,754
1
$282,490
FILES CLOSED FOR INCOMPLETENESS
0
$0
0
$0
28
$197,600
1
$119,720
0
$0
0
$0
Aggregated Statistics For Year 2005 (Based on 2 partial tracts)
A) FHA, FSA/RHS & VA Home Purchase Loans
B) Conventional Home Purchase Loans
C) Refinancings
D) Home Improvement Loans
E) Loans on Dwellings For 5+ Families
F) Non-occupant Loans on < 5 Family Dwellings (A B C & D)
G) Loans On Manufactured Home Dwelling (A B C & D)
Number
Average Value
Number
Average Value
Number
Average Value
Number
Average Value
Number
Average Value
Number
Average Value
Number
Average Value
LOANS ORIGINATED
7
$176,797
219
$163,095
332
$147,125
82
$62,191
0
$0
38
$146,485
8
$87,101
APPLICATIONS APPROVED, NOT ACCEPTED
0
$0
17
$190,544
43
$152,602
9
$44,840
0
$0
7
$142,591
3
$82,507
APPLICATIONS DENIED
3
$125,103
40
$142,625
109
$169,804
17
$51,118
3
$228,237
13
$145,385
19
$60,251
APPLICATIONS WITHDRAWN
1
$86,090
19
$149,246
140
$147,741
7
$122,606
1
$147,970
3
$140,797
7
$78,214
FILES CLOSED FOR INCOMPLETENESS
0
$0
7
$139,517
13
$169,495
1
$269,040
0
$0
0
$0
0
$0
Aggregated Statistics For Year 2004 (Based on 2 partial tracts)
A) FHA, FSA/RHS & VA Home Purchase Loans
B) Conventional Home Purchase Loans
C) Refinancings
D) Home Improvement Loans
E) Loans on Dwellings For 5+ Families
F) Non-occupant Loans on < 5 Family Dwellings (A B C & D)
G) Loans On Manufactured Home Dwelling (A B C & D)
Detailed PMIC statistics for the following Tracts:0115.00
2003 - 2018 National Fire Incident Reporting System (NFIRS) incidents
Based on the data from the years 2003 - 2018 the average number of fire incidents per year is 17. The highest number of reported fires - 41 took place in 2015, and the least - 2 in 2004. The data has an increasing trend.
When looking into fire subcategories, the most reports belonged to: Structure Fires (50.0%), and Outside Fires (33.2%).
Fire incident types reported to NFIRS in Zip Code 04260


 Nearest zip codes: 04039, 04097, 04069, 04274, 04210, 04071.


 Based on the data from the years 2003 - 2018 the average number of fire incidents per year is 17. The highest number of reported fires - 41 took place in 2015, and the least - 2 in 2004. The data has an increasing trend.
 When looking into fire subcategories, the most reports belonged to: Structure Fires (50.0%), and Outside Fires (33.2%).