Estimated zip code population in 2022: 10,162 Zip code population in 2010: 8,958 Zip code population in 2000: 7,400
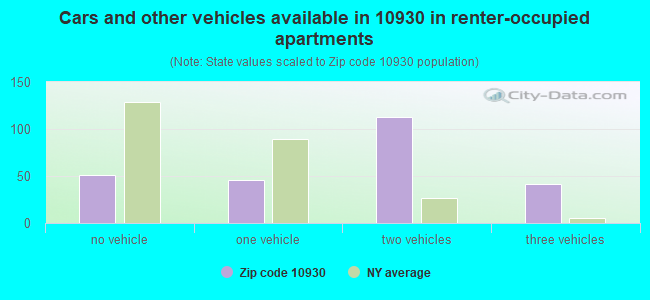
Houses and condos: 3,623 Renter-occupied apartments: 257
% of renters here:
8%
State:
46%
March 2022 cost of living index in zip code 10930: 133.8 (high, U.S. average is 100)
Land area: 13.9 sq. mi. Water area: 0.2 sq. mi.
Population density: 732 people per square mile
(low).
OSM Map
General Map
Google Map
MSN Map
OSM Map
General Map
Google Map
MSN Map
OSM Map
General Map
Google Map
MSN Map
OSM Map
General Map
Google Map
MSN Map
Please wait while loading the map...
Real estate property taxes paid for housing units in 2022:
This zip code:
2.4% ($9,805)
New York:
1.5% ($6,180)
Median real estate property taxes paid for housing units with mortgages in 2022: $9,858 (2.2%) Median real estate property taxes paid for housing units with no mortgage in 2022: $9,755 (2.6%)
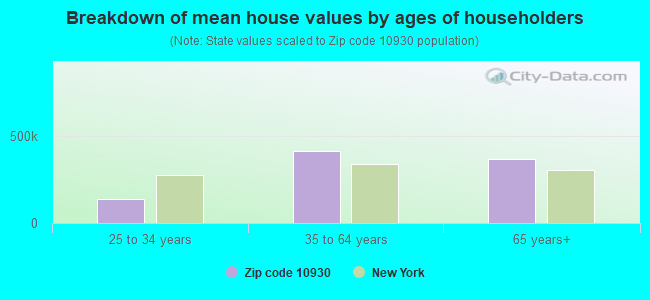
Estimated median house/condo value in 2022: $415,620
10930:
$415,620
New York:
$400,400
According to our research of New York and other state lists, there were 2 registered sex offenders living in 10930 zip code as of April 26, 2024. The ratio of all residents to sex offenders in zip code 10930 is 4,455 to 1. The ratio of registered sex offenders to all residents in this zip code is much lower than the state average.
Median resident age:
This zip code:
40.6 years
New York median age:
40.0 years
Average household size:
This zip code:
3.0 people
New York:
2.5 people
Averages for the 2020 tax year for zip code 10930, filed in 2021:
Average Adjusted Gross Income (AGI) in 2020: $91,266 (Individual Income Tax Returns)
Here:
$91,266
State:
$90,930
Salary/wage: $79,638 (reported on 85.7% of returns)
Here:
$79,638
State:
$72,104
(% of AGI for various income ranges: 1087.4% for AGIs below $25k, 3564.1% for AGIs $25k-50k, 6445.8% for AGIs $50k-75k, 9787.1% for AGIs $75k-100k, 18492.9% for AGIs $100k-200k, 68599.3% for AGIs over 200k)
Taxable interest for individuals: $918 (reported on 42.1% of returns)
This zip code:
$918
New York:
$3,075
(% of AGI for various income ranges: 10.8% for AGIs below $25k, 11.7% for AGIs $25k-50k, 24.2% for AGIs $50k-75k, 46.1% for AGIs $75k-100k, 89.4% for AGIs $100k-200k, 515.3% for AGIs over 200k)
Ordinary dividends: $4,529 (reported on 23.9% of returns)
Here:
$4,529
State:
$11,095
(% of AGI for various income ranges: 20.5% for AGIs below $25k, 38.3% for AGIs $25k-50k, 63.7% for AGIs $50k-75k, 102.6% for AGIs $75k-100k, 244.4% for AGIs $100k-200k, 1570.0% for AGIs over 200k)
Net capital gain/loss in AGI: +$10,969 (reported on 21.3% of returns)
Here:
+$10,969
State:
+$44,925
(% of AGI for various income ranges: 9.0% for AGIs below $25k, 19.3% for AGIs $25k-50k, 59.8% for AGIs $50k-75k, 61.9% for AGIs $75k-100k, 340.3% for AGIs $100k-200k, 5119.3% for AGIs over 200k)
Profit/loss from business: +$16,740 (reported on 15.2% of returns)
Here:
+$16,740
State:
+$14,940
(% of AGI for various income ranges: 116.0% for AGIs below $25k, 196.8% for AGIs $25k-50k, 206.3% for AGIs $50k-75k, 223.5% for AGIs $75k-100k, 316.1% for AGIs $100k-200k, 3859.3% for AGIs over 200k)
Taxable individual retirement arrangement distribution: $17,100 (reported on 7.2% of returns)
10930:
$17,100
New York:
$19,609
(% of AGI for various income ranges: 39.6% for AGIs below $25k, 107.5% for AGIs $25k-50k, 134.7% for AGIs $50k-75k, 205.5% for AGIs $75k-100k, 379.2% for AGIs $100k-200k, 644.0% for AGIs over 200k)
Self-employed (Keogh) retirement plans: $26,333 (reported on 0.7% of returns)
10930:
$26,333
New York:
$32,497
(% of AGI for various income ranges: 526.7% for AGIs over 200k)
Total itemized deductions: $31,807 (reported on 17.0% of returns)
Here:
$31,807
State:
$39,326
(% of AGI for various income ranges: 74.8% for AGIs below $25k, 186.4% for AGIs $25k-50k, 521.9% for AGIs $50k-75k, 810.6% for AGIs $75k-100k, 1336.9% for AGIs $100k-200k, 6300.7% for AGIs over 200k)
Charity contributions: $11,920 (reported on 14.3% of returns)
Here:
$11,920
State:
$15,420
(% of AGI for various income ranges: 25.6% for AGIs $25k-50k, 71.9% for AGIs $50k-75k, 98.4% for AGIs $75k-100k, 268.5% for AGIs $100k-200k, 3466.0% for AGIs over 200k)
Taxes paid: $9,458 (reported on 17.0% of returns)
10930:
$9,458
State:
$9,183
(% of AGI for various income ranges: 24.8% for AGIs below $25k, 71.0% for AGIs $25k-50k, 206.7% for AGIs $50k-75k, 335.2% for AGIs $75k-100k, 477.3% for AGIs $100k-200k, 1127.3% for AGIs over 200k)
Earned income credit: $2,128 (reported on 8.7% of returns)
Here:
$2,128
State:
$2,138
(% of AGI for various income ranges: 56.2% for AGIs below $25k, 67.3% for AGIs $25k-50k)
Percentage of individuals using paid preparers for their 2020 taxes: 95.3%
Here:
95%
State:
95%
(% for various income ranges: 94.0% for AGIs below $25k, 93.5% for AGIs $25k-50k, 96.6% for AGIs $50k-75k, 95.7% for AGIs $75k-100k, 96.3% for AGIs $100k-200k, 97.6% for AGIs over 200k)
Averages for the 2012 tax year for zip code 10930, filed in 2013:
Average Adjusted Gross Income (AGI) in 2012: $84,407 (Individual Income Tax Returns)
Here:
$84,407
State:
$77,088
Salary/wage: $77,039 (reported on 87.3% of returns)
Here:
$77,039
State:
$60,593
(% of AGI for various income ranges: 76.1% for AGIs below $25k, 78.7% for AGIs $25k-50k, 71.8% for AGIs $50k-75k, 75.9% for AGIs $75k-100k, 82.5% for AGIs $100k-200k, 80.0% for AGIs over 200k)
Taxable interest for individuals: $987 (reported on 47.9% of returns)
This zip code:
$987
New York:
$3,125
(% of AGI for various income ranges: 1.6% for AGIs below $25k, 0.5% for AGIs $25k-50k, 0.4% for AGIs $50k-75k, 0.5% for AGIs $75k-100k, 0.4% for AGIs $100k-200k, 0.7% for AGIs over 200k)
Ordinary dividends: $2,692 (reported on 28.2% of returns)
Here:
$2,692
State:
$10,299
(% of AGI for various income ranges: 2.2% for AGIs below $25k, 0.6% for AGIs $25k-50k, 1.6% for AGIs $50k-75k, 0.6% for AGIs $75k-100k, 0.7% for AGIs $100k-200k, 0.9% for AGIs over 200k)
Net capital gain/loss in AGI: +$4,543 (reported on 19.4% of returns)
Here:
+$4,543
State:
+$42,474
(% of AGI for various income ranges: 0.2% for AGIs $75k-100k, 0.4% for AGIs $100k-200k, 3.2% for AGIs over 200k)
Profit/loss from business: +$18,210 (reported on 13.9% of returns)
Here:
+$18,210
State:
+$16,168
(% of AGI for various income ranges: 6.2% for AGIs below $25k, 4.3% for AGIs $25k-50k, 2.0% for AGIs $50k-75k, 2.2% for AGIs $75k-100k, 1.6% for AGIs $100k-200k, 5.1% for AGIs over 200k)
Taxable individual retirement arrangement distribution: $15,672 (reported on 9.3% of returns)
10930:
$15,672
New York:
$17,621
(% of AGI for various income ranges: 2.9% for AGIs below $25k, 2.3% for AGIs $25k-50k, 3.5% for AGIs $50k-75k, 2.1% for AGIs $75k-100k, 1.6% for AGIs $100k-200k, 0.8% for AGIs over 200k)
Self-employment retirement plans: $27,967 (reported on 0.7% of returns)
10930:
$27,967
New York:
$27,330
Total itemized deductions: $30,560 (24% of AGI, reported on 56.7% of returns)
Here:
$30,560
State:
$34,985
Here:
23.8% of AGI
State:
21.3% of AGI
(% of AGI for various income ranges: 16.7% for AGIs below $25k, 17.1% for AGIs $25k-50k, 21.7% for AGIs $50k-75k, 24.0% for AGIs $75k-100k, 22.2% for AGIs $100k-200k, 17.3% for AGIs over 200k)
Charity contributions: $2,738 (reported on 50.7% of returns)
Here:
$2,738
State:
$5,572
(% of AGI for various income ranges: 0.7% for AGIs below $25k, 1.1% for AGIs $25k-50k, 1.8% for AGIs $50k-75k, 1.8% for AGIs $75k-100k, 1.7% for AGIs $100k-200k, 1.6% for AGIs over 200k)
Taxes paid: $16,633 (reported on 56.5% of returns)
10930:
$16,633
State:
$18,656
(% of AGI for various income ranges: 6.7% for AGIs below $25k, 7.2% for AGIs $25k-50k, 10.6% for AGIs $50k-75k, 12.0% for AGIs $75k-100k, 12.0% for AGIs $100k-200k, 11.0% for AGIs over 200k)
Earned income credit: $2,093 (reported on 6.7% of returns)
Here:
$2,093
State:
$2,230
(% of AGI for various income ranges: 3.5% for AGIs below $25k, 0.6% for AGIs $25k-50k)
Percentage of individuals using paid preparers for their 2012 taxes: 70.1%
Here:
70%
State:
66%
(% for various income ranges: 62.0% for AGIs below $25k, 68.3% for AGIs $25k-50k, 75.5% for AGIs $50k-75k, 73.5% for AGIs $75k-100k, 74.5% for AGIs $100k-200k, 78.1% for AGIs over 200k)
Averages for the 2004 tax year for zip code 10930, filed in 2005:
Average Adjusted Gross Income (AGI) in 2004: $72,181 (Individual Income Tax Returns)
Here:
$72,181
State:
$59,519
Salary/wage: $67,946 (reported on 89.0% of returns)
Here:
$67,946
State:
$50,673
(% of AGI for various income ranges: 125.4% for AGIs below $10k, 73.3% for AGIs $10k-25k, 77.9% for AGIs $25k-50k, 80.9% for AGIs $50k-75k, 87.0% for AGIs $75k-100k, 84.3% for AGIs over 100k)
Taxable interest for individuals: $801 (reported on 68.9% of returns)
This zip code:
$801
New York:
$2,377
(% of AGI for various income ranges: 5.9% for AGIs below $10k, 2.4% for AGIs $10k-25k, 1.1% for AGIs $25k-50k, 1.0% for AGIs $50k-75k, 0.6% for AGIs $75k-100k, 0.6% for AGIs over 100k)
Taxable dividends: $1,616 (reported on 35.8% of returns)
Here:
$1,616
State:
$5,394
(% of AGI for various income ranges: 4.2% for AGIs below $10k, 2.5% for AGIs $10k-25k, 1.3% for AGIs $25k-50k, 0.6% for AGIs $50k-75k, 0.6% for AGIs $75k-100k, 0.7% for AGIs over 100k)
Net capital gain/loss: +$3,880 (reported on 27.1% of returns)
Here:
+$3,880
State:
+$23,581
(% of AGI for various income ranges: -2.4% for AGIs below $10k, 0.3% for AGIs $10k-25k, 0.7% for AGIs $25k-50k, -0.1% for AGIs $50k-75k, -0.3% for AGIs $75k-100k, 2.5% for AGIs over 100k)
Profit/loss from business: +$13,136 (reported on 14.4% of returns)
Here:
+$13,136
State:
+$13,809
(% of AGI for various income ranges: 3.0% for AGIs below $10k, 4.0% for AGIs $10k-25k, 4.8% for AGIs $25k-50k, 2.4% for AGIs $50k-75k, 1.8% for AGIs $75k-100k, 2.5% for AGIs over 100k)
IRA payment deduction: $3,282 (reported on 2.8% of returns)
10930:
$3,282
New York:
$3,115
(% of AGI for various income ranges: 0.4% for AGIs $25k-50k, 0.2% for AGIs $50k-75k, 0.1% for AGIs $75k-100k, 0.1% for AGIs over 100k)
Self-employed pension: $10,907 (reported on 1.1% of returns)
Here:
$10,907
New York:
$19,016
Total itemized deductions: $26,430 (26% of AGI, reported on 62.3% of returns)
Here:
$26,430
State:
$25,864
Here:
25.5% of AGI
State:
21.9% of AGI
(% of AGI for various income ranges: 17.9% for AGIs below $10k, 18.3% for AGIs $10k-25k, 21.9% for AGIs $25k-50k, 27.2% for AGIs $50k-75k, 26.7% for AGIs $75k-100k, 21.1% for AGIs over 100k)
Charity contributions deductions: $2,878 (3% of AGI, reported on 58.4% of returns)
Here:
$2,878
State:
$4,439
Here:
2.7% of AGI
State:
3.6% of AGI
(% of AGI for various income ranges: 0.5% for AGIs below $10k, 2.1% for AGIs $10k-25k, 2.2% for AGIs $25k-50k, 2.6% for AGIs $50k-75k, 2.6% for AGIs $75k-100k, 2.3% for AGIs over 100k)
Total tax: $10,864 (reported on 82.8% of returns)
10930:
$10,864
State:
$11,730
(% of AGI for various income ranges: 2.9% for AGIs below $10k, 4.4% for AGIs $10k-25k, 7.3% for AGIs $25k-50k, 7.8% for AGIs $50k-75k, 8.5% for AGIs $75k-100k, 15.8% for AGIs over 100k)
Earned income credit: $1,475 (reported on 4.6% of returns)
Here:
$1,475
State:
$1,757
Percentage of individuals using paid preparers for their 2004 taxes: 69.2%
Here:
69%
State:
67%
(% for various income ranges: 57.2% for AGIs below $10k, 65.6% for AGIs $10k-25k, 68.0% for AGIs $25k-50k, 72.7% for AGIs $50k-75k, 74.4% for AGIs $75k-100k, 74.8% for AGIs over 100k)
Household received Food Stamps/SNAP in the past 12 months: 239 Household did not receive Food Stamps/SNAP in the past 12 months: 3,117
Women who had a birth in the past 12 months: 38 (38 now married, 0 unmarried) Women who did not have a birth in the past 12 months: 2,501 (930 now married, 1,569 unmarried)
Housing units in zip code 10930 with a mortgage: 2,216 (171 second mortgage, 173 both second mortgage and home equity loan) Houses without a mortgage: 15
Median monthly owner costs for units with a mortgage: $3,047 Median monthly owner costs for units without a mortgage: $1,393
Residents with income below the poverty level in 2022:
This zip code:
4.9%
Whole state:
14.3%
Residents with income below 50% of the poverty level in 2022:
This zip code:
3.4%
Whole state:
6.8%
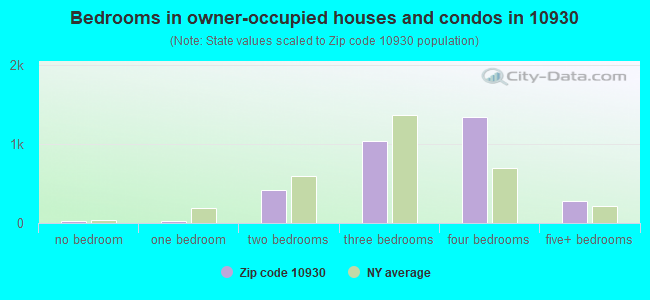
Median number of rooms in houses and condos:
Here:
7.5
State:
6.3
Median number of rooms in apartments:
Here:
4.2
State:
3.8
Notable locations in this zip code not listed on our city pages
Notable locations in zip code 10930: Thevenet Hall (A), West Point Girls Camp (B), Woodbury Public Library (C), Woodbury Fire District Highland Mills Fire Company (D). Display/hide their locations on the map
Churches in zip code 10930 include: Highland Mills Methodist Church (A), Saint David's Episcopal Church (B), Saint Patrick's Roman Catholic Church (C), Mountainville Methodist Church (D), Quaker Meetinghouse (E). Display/hide their locations on the map
Lakes and reservoirs: Saltzmans Lake (A), Spring Lake (B), Cromwell Lake (C), Hillside Lake (D), Lebanon Lake (E), Earl Reservoir (F). Display/hide their locations on the map
In group quarters: 10 (-1 institutionalized population)
Size of family households: 584 2-persons, 722 3-persons, 802 4-persons, 265 5-persons, 132 6-persons, 32 7-or-more-persons
Size of nonfamily households: 753 1-person, 41 2-persons
1,795 married couples with children.
199 single-parent households (199 women).
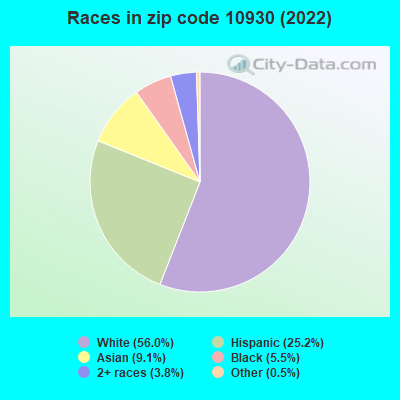
80.8% of residents of 10930 zip code speak English at home.
11.3% of residents speak Spanish at home (88% very well, 3% well, 9% not well).
5.4% of residents speak other Indo-European language at home (83% very well, 11% well, 6% not well).
1.5% of residents speak Asian or Pacific Island language at home (77% very well, 15% well, 8% not well).
Foreign born population: 1,434 (14.1%) (67.8% of them are naturalized citizens)
This zip code:
14.1%
Whole state:
22.7%
13%Honduras
13%Malaysia
12%Dominica
12%Bhutan
7%Czechoslovakia (includes Czech Republic and Slovakia)
5%United Kingdom, excluding England and Scotland
5%Sweden
13%Irish
9%American
8%Italian
5%Polish
3%Jamaican
2%German
2%Lithuanian
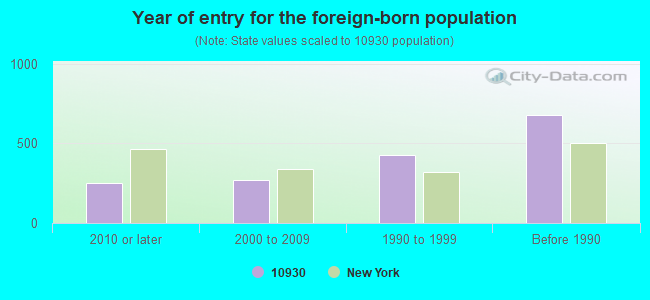
Year of entry for the foreign-born population
2542010 or later
2702000 to 2009
4301990 to 1999
679Before 1990
Facilities with environmental interests located in this zip code:
HIGHLAND STONE (911 RT 32 in HIGHLAND MILLS, NY)
AIR SYNTHETIC MINOR (AIRS/AFS) STATE MASTER (New York facility tracking) - MINE OPERATING PERMIT, AIR PROGRAM, Business SIC classification: CRUSHED AND BROKEN STONE; READY-MIXED CONCRETE Business NAICS classification: READY-MIX CONCRETE MANUFACTURING. Organizations: HIGHLAND SAND & GRAVEL INC (LEGALLY RESPONSIBLE PARTY)
10 CASTLETON DR ( in HIGHLAND MILLS, NY)
National Pollutant Discharge Elimination System NON-MAJOR (Tracking pollutant discharge elimination systems) - permit Organizations: SETH PULVER (CONTACT/OWNER)
Alternative names: PULVER PROPERTY
CLASSIC CLEANERS (479 RTE 32 in HIGHLAND MILLS, NY)
Conditionally Exempt Small Quantity Generators, less than 100 kg/month of hazardous waste (Resource Conservation and Recovery Act (tracking hazardous waste)) - notification TRANSPORTER (Resource Conservation and Recovery Act (tracking hazardous waste)) - notification Organizations: SHERRLY DECHER (CONTACT/OWNER)
Housing units lacking complete plumbing facilities: 0.6%
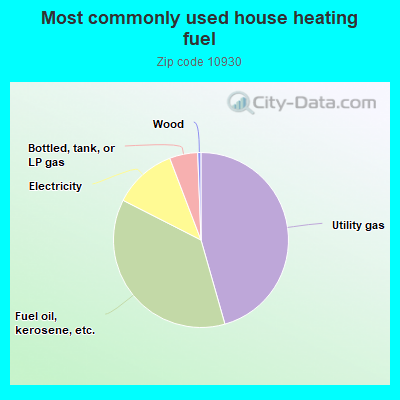
45.6%Utility gas
36.9%Fuel oil, kerosene, etc.
11.7%Electricity
5.2%Bottled, tank, or LP gas
0.6%Wood
Population in 1990: 5,629. Population change in the 1990s: +1,771 (+31.5%).
Place of birth for U.S.-born residents:
This state: 7,063
Northeast: 1,047
Midwest: 118
South: 170
West: 67
60% of the 10930 zip code residents lived in the same house 5 years ago. Out of people who lived in different houses, 42% lived in this county. Out of people who lived in different counties, 50% lived in New York.
96% of the 10930 zip code residents lived in the same house 1 year ago. Out of people who lived in different houses, 43% moved from this county. Out of people who lived in different houses, 43% moved from different county within same state. Out of people who lived in different houses, 10% moved from different state. Out of people who lived in different houses, 1% moved from abroad.
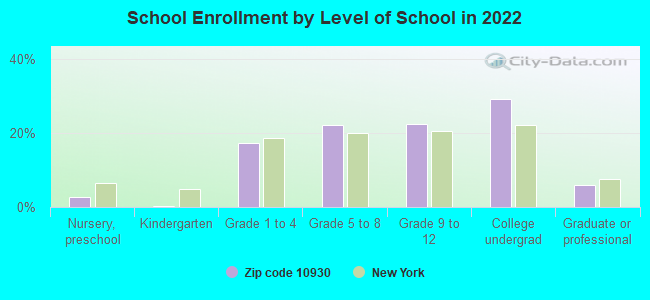
Private vs. public school enrollment:
Students in private schools in grades 1 to 8 (elementary and middle school): 157
Here:
13.3%
New York:
15.6%
Students in private schools in grades 9 to 12 (high school): 29
Here:
4.4%
New York:
15.0%
Students in private undergraduate colleges: 150
Here:
17.5%
New York:
39.2%
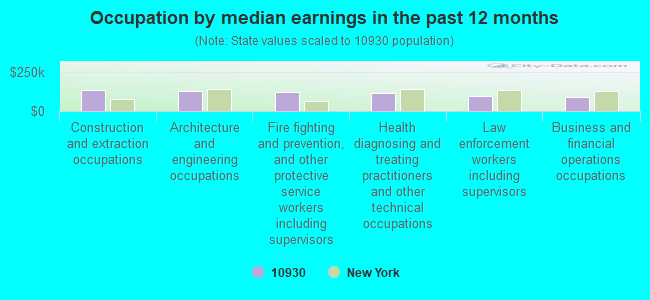
Occupation by median earnings in the past 12 months ($)
130,787Construction and extraction occupations
126,712Architecture and engineering occupations
121,610Fire fighting and prevention, and other protective service workers including supervisors
112,569Health diagnosing and treating practitioners and other technical occupations
97,901Law enforcement workers including supervisors
89,336Business and financial operations occupations
Top industries in this zip code by the number of employees in 2005:
Health Care and Social Assistance: Offices of Physicians (except Mental Health Specialists) (20-49 employees: 1 establishment, 10-19 employees: 1 establishment, 5-9 employees: 1 establishment)
Accommodation and Food Services: Full-Service Restaurants (5-9: 3, 1-4: 2)
Construction: Plumbing, Heating, and Air-Conditioning Contractors (10-19: 1, 1-4: 4)
Other Services (except Public Administration): Religious Organizations (10-19: 1, 5-9: 1)
Educational Services: Elementary and Secondary Schools (10-19: 1, 5-9: 1)
Administrative and Support and Waste Management and Remediation Services: Landscaping Services (5-9: 1, 1-4: 7)
Health Care and Social Assistance: Offices of Physical, Occupational and Speech Therapists, and Audiologists (10-19: 1, 1-4: 1)
Administrative and Support and Waste Management and Remediation Services: Janitorial Services (10-19: 1, 1-4: 1)
Accommodation and Food Services: Limited-Service Restaurants (5-9: 2, 1-4: 1)
Wholesale Trade: Other Professional Equipment and Supplies Merchant Wholesalers (10-19: 1)
People in group quarters in 2010:
18 people in group homes intended for adults
2 people in other noninstitutional facilities
People in group quarters in 2000:
19 people in homes for the mentally retarded
11 people in homes for the mentally ill
2 people in other nonhousehold living situations
Fatal accident statistics in 2014:
Fatal accident count: 2
Vehicles involved in fatal accidents: 3
Fatal accidents caused by drunken drivers: 0
Fatalities: 2
Persons involved in fatal accidents: 3
Pedestrians involved in fatal accidents: 0
Fatal accident statistics in 2012:
Fatal accident count: 1
Vehicles involved in fatal accidents: 2
Fatal accidents caused by drunken drivers: 1
Fatalities: 1
Persons involved in fatal accidents: 2
Pedestrians involved in fatal accidents: 0
Home Mortgage Disclosure Act Aggregated Statistics For Year 2009 (Based on 2 full and 4 partial tracts)
A) FHA, FSA/RHS & VA Home Purchase Loans
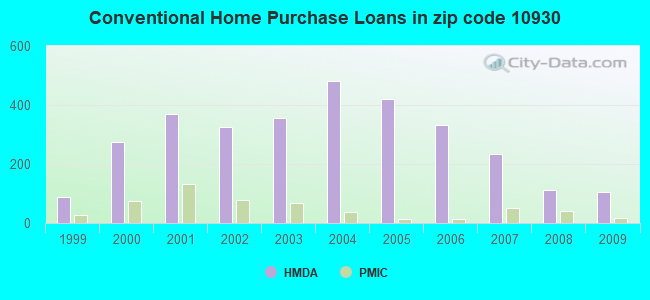
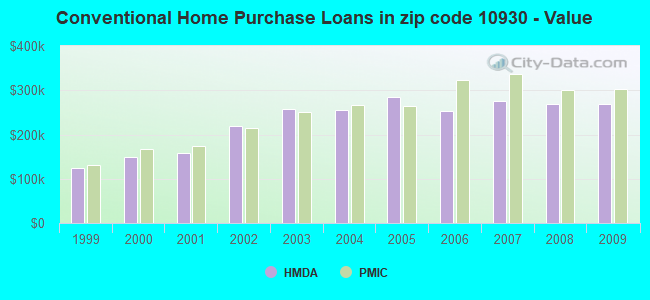
B) Conventional Home Purchase Loans
C) Refinancings
D) Home Improvement Loans
F) Non-occupant Loans on < 5 Family Dwellings (A B C & D)
G) Loans On Manufactured Home Dwelling (A B C & D)
Number
Average Value
Number
Average Value
Number
Average Value
Number
Average Value
Number
Average Value
Number
Average Value
LOANS ORIGINATED
65
$282,490
106
$269,019
264
$241,217
8
$96,548
16
$319,083
4
$71,818
APPLICATIONS APPROVED, NOT ACCEPTED
4
$331,048
14
$324,037
31
$245,715
2
$23,255
4
$297,258
0
$0
APPLICATIONS DENIED
11
$276,159
37
$284,516
136
$279,845
11
$112,420
18
$257,198
0
$0
APPLICATIONS WITHDRAWN
8
$303,970
11
$223,588
62
$270,472
6
$35,208
3
$216,650
0
$0
FILES CLOSED FOR INCOMPLETENESS
0
$0
8
$255,832
15
$326,633
0
$0
0
$0
0
$0
Aggregated Statistics For Year 2008 (Based on 2 full and 4 partial tracts)
A) FHA, FSA/RHS & VA Home Purchase Loans
B) Conventional Home Purchase Loans
C) Refinancings
D) Home Improvement Loans
F) Non-occupant Loans on < 5 Family Dwellings (A B C & D)
Number
Average Value
Number
Average Value
Number
Average Value
Number
Average Value
Number
Average Value
LOANS ORIGINATED
21
$323,307
112
$269,367
101
$254,027
31
$77,002
11
$270,887
APPLICATIONS APPROVED, NOT ACCEPTED
0
$0
32
$271,373
22
$229,887
3
$73,993
7
$256,193
APPLICATIONS DENIED
3
$323,483
37
$279,664
99
$284,697
18
$136,361
18
$215,053
APPLICATIONS WITHDRAWN
2
$322,970
14
$212,910
63
$287,012
4
$69,178
2
$431,245
FILES CLOSED FOR INCOMPLETENESS
2
$242,015
14
$302,376
8
$290,085
6
$145,245
0
$0
Aggregated Statistics For Year 2007 (Based on 2 full and 4 partial tracts)
A) FHA, FSA/RHS & VA Home Purchase Loans
B) Conventional Home Purchase Loans
C) Refinancings
D) Home Improvement Loans
F) Non-occupant Loans on < 5 Family Dwellings (A B C & D)
G) Loans On Manufactured Home Dwelling (A B C & D)
Number
Average Value
Number
Average Value
Number
Average Value
Number
Average Value
Number
Average Value
Number
Average Value
LOANS ORIGINATED
8
$320,144
234
$274,760
184
$237,183
59
$82,812
25
$327,443
4
$87,068
APPLICATIONS APPROVED, NOT ACCEPTED
0
$0
41
$296,978
55
$263,052
12
$145,456
11
$342,011
4
$69,850
APPLICATIONS DENIED
0
$0
63
$295,511
205
$288,021
31
$57,813
22
$451,789
0
$0
APPLICATIONS WITHDRAWN
2
$372,860
34
$275,282
65
$300,969
14
$159,644
5
$328,588
0
$0
FILES CLOSED FOR INCOMPLETENESS
0
$0
11
$316,006
22
$265,851
0
$0
1
$87,490
0
$0
Aggregated Statistics For Year 2006 (Based on 2 full and 4 partial tracts)
A) FHA, FSA/RHS & VA Home Purchase Loans
B) Conventional Home Purchase Loans
C) Refinancings
D) Home Improvement Loans
F) Non-occupant Loans on < 5 Family Dwellings (A B C & D)
G) Loans On Manufactured Home Dwelling (A B C & D)
Number
Average Value
Number
Average Value
Number
Average Value
Number
Average Value
Number
Average Value
Number
Average Value
LOANS ORIGINATED
2
$308,195
331
$254,001
278
$233,634
59
$62,347
35
$267,157
2
$73,785
APPLICATIONS APPROVED, NOT ACCEPTED
0
$0
47
$268,550
99
$201,251
26
$66,596
7
$247,464
0
$0
APPLICATIONS DENIED
2
$502,720
73
$295,774
188
$233,097
33
$59,982
15
$280,931
2
$51,160
APPLICATIONS WITHDRAWN
2
$291,205
46
$292,859
155
$272,984
21
$86,799
12
$353,762
0
$0
FILES CLOSED FOR INCOMPLETENESS
0
$0
16
$377,479
34
$258,645
2
$71,815
5
$247,898
0
$0
Aggregated Statistics For Year 2005 (Based on 2 full and 4 partial tracts)
B) Conventional Home Purchase Loans
C) Refinancings
D) Home Improvement Loans
E) Loans on Dwellings For 5+ Families
F) Non-occupant Loans on < 5 Family Dwellings (A B C & D)
G) Loans On Manufactured Home Dwelling (A B C & D)
Number
Average Value
Number
Average Value
Number
Average Value
Number
Average Value
Number
Average Value
Number
Average Value
LOANS ORIGINATED
422
$283,671
321
$232,470
64
$91,680
2
$265,625
50
$232,786
0
$0
APPLICATIONS APPROVED, NOT ACCEPTED
38
$232,990
60
$182,804
19
$54,921
0
$0
6
$167,748
0
$0
APPLICATIONS DENIED
73
$308,641
143
$248,774
31
$108,532
0
$0
10
$235,815
2
$51,160
APPLICATIONS WITHDRAWN
64
$307,712
204
$226,393
17
$143,522
0
$0
13
$282,233
0
$0
FILES CLOSED FOR INCOMPLETENESS
17
$237,489
57
$319,584
6
$56,732
0
$0
2
$216,010
0
$0
Aggregated Statistics For Year 2004 (Based on 2 full and 4 partial tracts)
A) FHA, FSA/RHS & VA Home Purchase Loans
B) Conventional Home Purchase Loans
C) Refinancings
D) Home Improvement Loans
F) Non-occupant Loans on < 5 Family Dwellings (A B C & D)
G) Loans On Manufactured Home Dwelling (A B C & D)
Number
Average Value
Number
Average Value
Number
Average Value
Number
Average Value
Number
Average Value
Number
Average Value
LOANS ORIGINATED
2
$210,535
480
$255,965
362
$223,394
74
$92,094
29
$213,732
4
$44,270
APPLICATIONS APPROVED, NOT ACCEPTED
0
$0
55
$254,833
73
$201,481
12
$60,068
5
$149,446
4
$14,758
APPLICATIONS DENIED
0
$0
93
$273,591
148
$216,294
53
$117,622
14
$183,619
12
$52,961
APPLICATIONS WITHDRAWN
0
$0
46
$306,510
201
$187,518
18
$126,587
1
$208,880
2
$152,490
FILES CLOSED FOR INCOMPLETENESS
0
$0
3
$246,703
38
$210,734
9
$59,904
0
$0
0
$0
Aggregated Statistics For Year 2003 (Based on 2 full and 4 partial tracts)
B) Conventional Home Purchase Loans
C) Refinancings
D) Home Improvement Loans
F) Non-occupant Loans on < 5 Family Dwellings (A B C & D)
Number
Average Value
Number
Average Value
Number
Average Value
Number
Average Value
LOANS ORIGINATED
355
$257,345
817
$176,507
42
$50,602
23
$157,049
APPLICATIONS APPROVED, NOT ACCEPTED
37
$260,714
149
$187,862
14
$57,897
1
$155,560
APPLICATIONS DENIED
59
$263,024
203
$189,852
32
$48,756
9
$148,031
APPLICATIONS WITHDRAWN
32
$224,719
171
$189,590
12
$59,408
2
$125,535
FILES CLOSED FOR INCOMPLETENESS
15
$216,919
52
$190,968
2
$9,840
4
$205,122
Aggregated Statistics For Year 2002 (Based on 2 full and 2 partial tracts)
A) FHA, FSA/RHS & VA Home Purchase Loans
B) Conventional Home Purchase Loans
C) Refinancings
D) Home Improvement Loans
F) Non-occupant Loans on < 5 Family Dwellings (A B C & D)
Number
Average Value
Number
Average Value
Number
Average Value
Number
Average Value
Number
Average Value
LOANS ORIGINATED
6
$152,488
325
$218,327
512
$162,260
57
$41,776
10
$133,728
APPLICATIONS APPROVED, NOT ACCEPTED
4
$156,915
49
$236,759
82
$163,837
7
$48,636
2
$364,005
APPLICATIONS DENIED
2
$153,475
34
$200,116
139
$158,095
36
$33,534
9
$118,577
APPLICATIONS WITHDRAWN
0
$0
28
$191,911
115
$144,045
21
$33,704
4
$166,485
FILES CLOSED FOR INCOMPLETENESS
0
$0
10
$211,199
49
$162,508
1
$30,860
0
$0
Aggregated Statistics For Year 2001 (Based on 2 full and 2 partial tracts)
A) FHA, FSA/RHS & VA Home Purchase Loans
B) Conventional Home Purchase Loans
C) Refinancings
D) Home Improvement Loans
F) Non-occupant Loans on < 5 Family Dwellings (A B C & D)
Number
Average Value
Number
Average Value
Number
Average Value
Number
Average Value
Number
Average Value
LOANS ORIGINATED
8
$158,620
368
$158,707
317
$147,060
48
$32,612
11
$104,252
APPLICATIONS APPROVED, NOT ACCEPTED
0
$0
30
$126,906
55
$117,741
7
$75,413
4
$83,130
APPLICATIONS DENIED
6
$155,493
43
$140,470
102
$133,135
30
$29,225
2
$19,765
APPLICATIONS WITHDRAWN
0
$0
35
$157,857
88
$142,625
17
$22,084
0
$0
FILES CLOSED FOR INCOMPLETENESS
2
$125,925
6
$104,167
16
$168,618
6
$29,513
0
$0
Aggregated Statistics For Year 2000 (Based on 2 full and 2 partial tracts)
A) FHA, FSA/RHS & VA Home Purchase Loans
B) Conventional Home Purchase Loans
C) Refinancings
D) Home Improvement Loans
E) Loans on Dwellings For 5+ Families
F) Non-occupant Loans on < 5 Family Dwellings (A B C & D)
Number
Average Value
Number
Average Value
Number
Average Value
Number
Average Value
Number
Average Value
Number
Average Value
LOANS ORIGINATED
13
$142,687
273
$148,814
61
$112,770
46
$29,072
0
$0
3
$88,500
APPLICATIONS APPROVED, NOT ACCEPTED
2
$119,040
40
$141,126
20
$86,471
16
$26,124
0
$0
0
$0
APPLICATIONS DENIED
0
$0
81
$127,142
62
$105,884
18
$21,828
0
$0
4
$87,795
APPLICATIONS WITHDRAWN
0
$0
34
$168,816
58
$130,837
4
$43,572
2
$117,070
3
$356,730
FILES CLOSED FOR INCOMPLETENESS
0
$0
4
$121,705
20
$111,868
0
$0
0
$0
0
$0
Aggregated Statistics For Year 1999 (Based on 1 full and 1 partial tracts)
A) FHA, FSA/RHS & VA Home Purchase Loans
B) Conventional Home Purchase Loans
C) Refinancings
D) Home Improvement Loans
F) Non-occupant Loans on < 5 Family Dwellings (A B C & D)
2003 - 2018 National Fire Incident Reporting System (NFIRS) incidents
According to the data from the years 2003 - 2018 the average number of fire incidents per year is 24. The highest number of reported fire incidents - 41 took place in 2005, and the least - 7 in 2014. The data has a dropping trend.
When looking into fire subcategories, the most incidents belonged to: Structure Fires (45.8%), and Outside Fires (23.7%).
Fire incident types reported to NFIRS in Zip Code 10930


 Nearest zip codes: 10917, 10953, 10926, 12577, 10992, 10910.


 According to the data from the years 2003 - 2018 the average number of fire incidents per year is 24. The highest number of reported fire incidents - 41 took place in 2005, and the least - 7 in 2014. The data has a dropping trend.
 When looking into fire subcategories, the most incidents belonged to: Structure Fires (45.8%), and Outside Fires (23.7%).