Estimated zip code population in 2022: 983 Zip code population in 2010: 1,267 Zip code population in 2000: 1,084
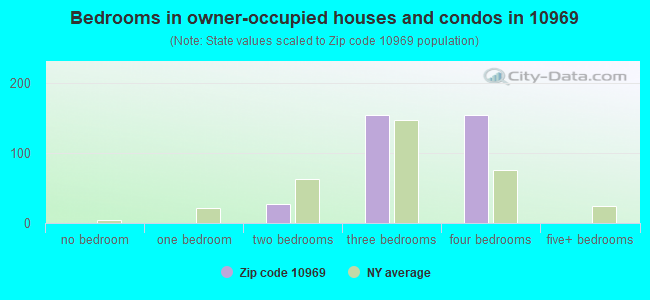
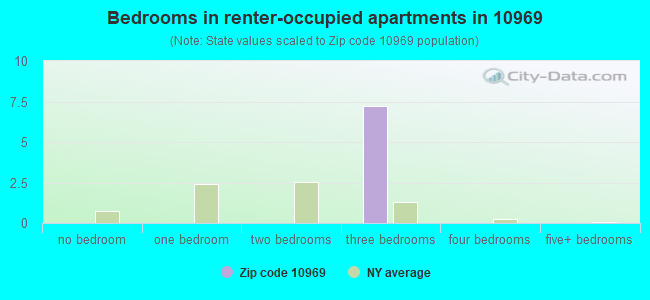
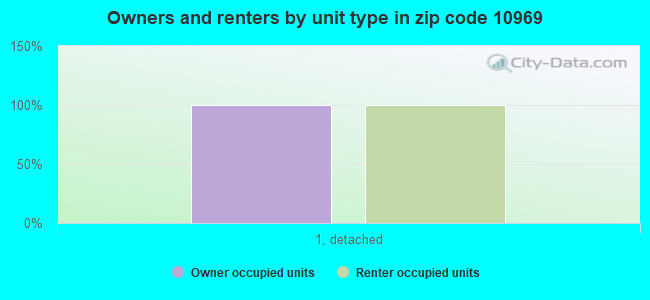
Houses and condos: 341 Renter-occupied apartments: 7
% of renters here:
2%
State:
46%
March 2022 cost of living index in zip code 10969: 111.0 (more than average, U.S. average is 100)
Land area: 11.2 sq. mi. Water area: 0.0 sq. mi.
Population density: 88 people per square mile
(very low).
OSM Map
General Map
Google Map
MSN Map
OSM Map
General Map
Google Map
MSN Map
OSM Map
General Map
Google Map
MSN Map
OSM Map
General Map
Google Map
MSN Map
Please wait while loading the map...
Real estate property taxes paid for housing units in 2022:
This zip code:
2.5% ($9,585)
New York:
1.5% ($6,180)
Median real estate property taxes paid for housing units with mortgages in 2022: $9,695 (2.4%) Median real estate property taxes paid for housing units with no mortgage in 2022: $9,089 (2.7%)
Business Search- 14 Million verified businesses
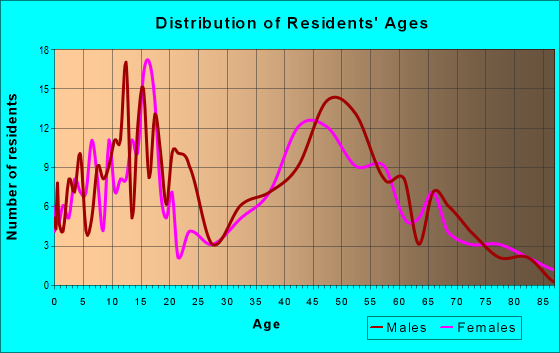
Males: 516
(52.6%)
Females: 466
(47.4%)
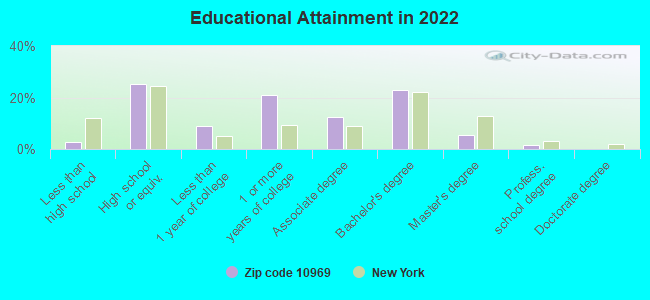
For population 25 years and over in 10969:
High school or higher: 96.2%
Bachelor's degree or higher: 29.7%
Graduate or professional degree: 7.3%
Mean travel time to work (commute): 39.7 minutes
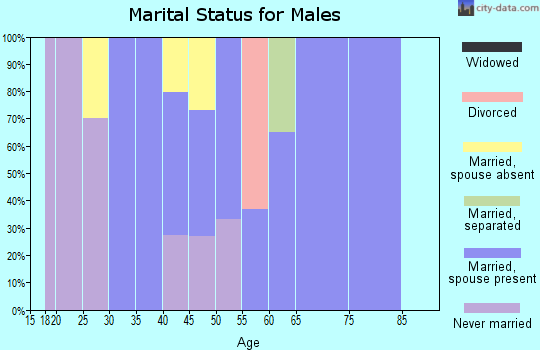
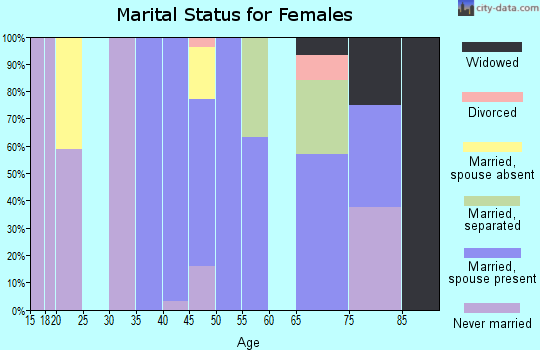
For population 15 years and over in 10969:
Never married: 27.0%
Now married: 63.7%
Separated: 0.0%
Widowed: 3.2%
Divorced: 6.1%
Zip code 10969 compared to state average:
Median household income above state average.
Unemployed percentage significantly below state average.
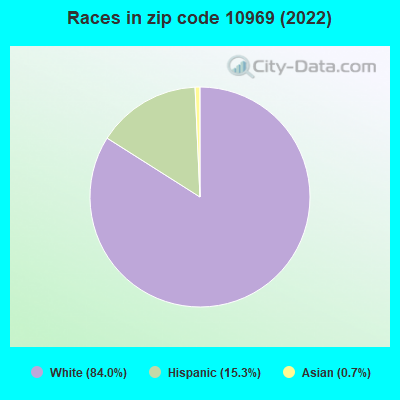
Black race population percentage significantly below state average.
Median age below state average.
Foreign-born population percentage significantly below state average.
Renting percentage significantly below state average.
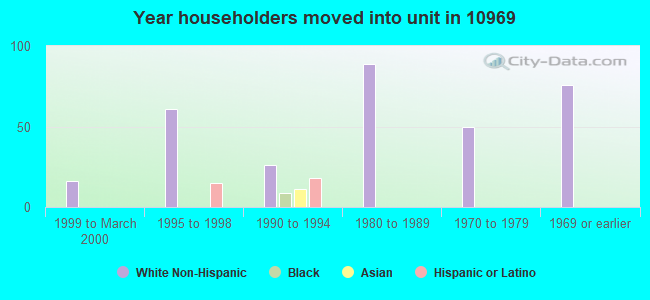
Length of stay since moving in significantly below state average.
Number of rooms per house significantly above state average.
House age below state average.
Number of college students significantly below state average.
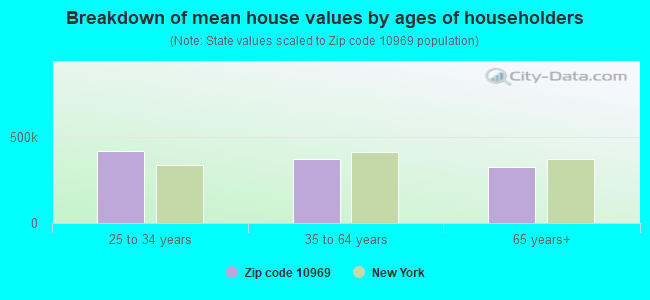
Estimated median house/condo value in 2022: $389,976
10969:
$389,976
New York:
$400,400
Median resident age:
This zip code:
35.5 years
New York median age:
40.0 years
Average household size:
This zip code:
2.8 people
New York:
2.5 people
Averages for the 2020 tax year for zip code 10969, filed in 2021:
Average Adjusted Gross Income (AGI) in 2020: $81,478 (Individual Income Tax Returns)
Here:
$81,478
State:
$90,930
Salary/wage: $66,004 (reported on 81.5% of returns)
Here:
$66,004
State:
$72,104
(% of AGI for various income ranges: 1280.9% for AGIs below $25k, 4044.4% for AGIs $25k-50k, 6135.0% for AGIs $50k-75k, 9952.0% for AGIs $75k-100k, 16975.0% for AGIs $100k-200k)
Taxable interest for individuals: $769 (reported on 40.0% of returns)
This zip code:
$769
New York:
$3,075
(% of AGI for various income ranges: 15.5% for AGIs below $25k, 6.7% for AGIs $25k-50k, 18.3% for AGIs $50k-75k, 98.0% for AGIs $75k-100k, 46.2% for AGIs $100k-200k)
Ordinary dividends: $3,262 (reported on 24.6% of returns)
Here:
$3,262
State:
$11,095
(% of AGI for various income ranges: 20.0% for AGIs below $25k, 22.2% for AGIs $25k-50k, 164.0% for AGIs $75k-100k, 177.5% for AGIs $100k-200k)
Net capital gain/loss in AGI: +$11,067 (reported on 18.5% of returns)
Here:
+$11,067
State:
+$44,925
(% of AGI for various income ranges: 132.0% for AGIs $75k-100k, 1592.5% for AGIs $100k-200k)
Profit/loss from business: +$13,838 (reported on 12.3% of returns)
Here:
+$13,838
State:
+$14,940
(% of AGI for various income ranges: 244.5% for AGIs below $25k, 211.7% for AGIs $50k-75k, 888.7% for AGIs $100k-200k)
Taxable individual retirement arrangement distribution: $9,225 (reported on 6.2% of returns)
10969:
$9,225
New York:
$19,609
(% of AGI for various income ranges: 121.8% for AGIs below $25k, 470.0% for AGIs $75k-100k)
Total itemized deductions: $25,600 (reported on 10.8% of returns)
Here:
$25,600
State:
$39,326
(% of AGI for various income ranges: 1275.0% for AGIs $50k-75k, 1283.8% for AGIs $100k-200k)
Charity contributions: $3,920 (reported on 7.7% of returns)
Here:
$3,920
State:
$15,420
(% of AGI for various income ranges: 30.9% for AGIs below $25k, 202.5% for AGIs $100k-200k)
Taxes paid: $9,043 (reported on 10.8% of returns)
10969:
$9,043
State:
$9,183
(% of AGI for various income ranges: 528.3% for AGIs $50k-75k, 395.0% for AGIs $100k-200k)
Earned income credit: $2,400 (reported on 9.2% of returns)
Here:
$2,400
State:
$2,138
(% of AGI for various income ranges: 91.8% for AGIs below $25k, 47.8% for AGIs $25k-50k)
Percentage of individuals using paid preparers for their 2020 taxes: 95.4%
Here:
95%
State:
95%
(% for various income ranges: 94.4% for AGIs below $25k, 92.9% for AGIs $25k-50k, 100.0% for AGIs $50k-75k, 100.0% for AGIs $75k-100k, 92.3% for AGIs $100k-200k, 100.0% for AGIs over 200k)
Averages for the 2012 tax year for zip code 10969, filed in 2013:
Average Adjusted Gross Income (AGI) in 2012: $60,655 (Individual Income Tax Returns)
Here:
$60,655
State:
$77,088
Salary/wage: $55,482 (reported on 83.3% of returns)
Here:
$55,482
State:
$60,593
(% of AGI for various income ranges: 68.9% for AGIs below $25k, 73.1% for AGIs $25k-50k, 76.0% for AGIs $50k-75k, 74.7% for AGIs $75k-100k, 78.5% for AGIs $100k-200k)
Taxable interest for individuals: $623 (reported on 43.3% of returns)
This zip code:
$623
New York:
$3,125
(% of AGI for various income ranges: 1.2% for AGIs below $25k, 0.3% for AGIs $25k-50k, 0.5% for AGIs $50k-75k, 0.3% for AGIs $75k-100k, 0.4% for AGIs $100k-200k)
Ordinary dividends: $2,146 (reported on 21.7% of returns)
Here:
$2,146
State:
$10,299
(% of AGI for various income ranges: 0.4% for AGIs below $25k, 0.2% for AGIs $25k-50k, 0.3% for AGIs $50k-75k, 1.9% for AGIs $75k-100k, 0.8% for AGIs $100k-200k)
Profit/loss from business: +$5,670 (reported on 16.7% of returns)
Here:
+$5,670
State:
+$16,168
(% of AGI for various income ranges: 12.4% for AGIs below $25k, 2.3% for AGIs $50k-75k, 0.8% for AGIs $100k-200k)
Taxable individual retirement arrangement distribution: $9,550 (reported on 6.7% of returns)
10969:
$9,550
New York:
$17,621
Total itemized deductions: $23,800 (25% of AGI, reported on 46.7% of returns)
Here:
$23,800
State:
$34,985
Here:
25.5% of AGI
State:
21.3% of AGI
(% of AGI for various income ranges: 14.9% for AGIs below $25k, 16.2% for AGIs $25k-50k, 18.0% for AGIs $50k-75k, 19.5% for AGIs $75k-100k, 19.0% for AGIs $100k-200k)
Charity contributions: $1,917 (reported on 38.3% of returns)
Here:
$1,917
State:
$5,572
(% of AGI for various income ranges: 1.3% for AGIs $25k-50k, 0.9% for AGIs $50k-75k, 1.6% for AGIs $75k-100k, 1.3% for AGIs $100k-200k)
Taxes paid: $12,364 (reported on 46.7% of returns)
10969:
$12,364
State:
$18,656
(% of AGI for various income ranges: 6.3% for AGIs below $25k, 7.8% for AGIs $25k-50k, 7.9% for AGIs $50k-75k, 9.4% for AGIs $75k-100k, 10.9% for AGIs $100k-200k)
Earned income credit: $1,933 (reported on 10.0% of returns)
Here:
$1,933
State:
$2,230
(% of AGI for various income ranges: 4.9% for AGIs below $25k)
Percentage of individuals using paid preparers for their 2012 taxes: 70.0%
Here:
70%
State:
66%
(% for various income ranges: 65.0% for AGIs below $25k, 66.7% for AGIs $25k-50k, 77.8% for AGIs $50k-75k, 71.4% for AGIs $75k-100k, 75.0% for AGIs $100k-200k)
Averages for the 2004 tax year for zip code 10969, filed in 2005:
Average Adjusted Gross Income (AGI) in 2004: $46,794 (Individual Income Tax Returns)
Here:
$46,794
State:
$59,519
Salary/wage: $43,490 (reported on 84.9% of returns)
Here:
$43,490
State:
$50,673
(% of AGI for various income ranges: 70.1% for AGIs below $10k, 77.0% for AGIs $10k-25k, 80.9% for AGIs $25k-50k, 78.1% for AGIs $50k-75k, 88.0% for AGIs $75k-100k, 74.9% for AGIs over 100k)
Taxable interest for individuals: $691 (reported on 56.5% of returns)
This zip code:
$691
New York:
$2,377
(% of AGI for various income ranges: 3.5% for AGIs below $10k, 1.5% for AGIs $10k-25k, 1.1% for AGIs $25k-50k, 0.7% for AGIs $50k-75k, 0.6% for AGIs $75k-100k, 0.5% for AGIs over 100k)
Taxable dividends: $929 (reported on 26.8% of returns)
Here:
$929
State:
$5,394
(% of AGI for various income ranges: 2.6% for AGIs below $10k, 1.5% for AGIs $10k-25k, 0.6% for AGIs $25k-50k, 0.6% for AGIs $50k-75k, 0.1% for AGIs $75k-100k, 0.3% for AGIs over 100k)
Net capital gain/loss: +$1,441 (reported on 17.6% of returns)
Here:
+$1,441
State:
+$23,581
(% of AGI for various income ranges: -2.4% for AGIs below $10k, -0.8% for AGIs $10k-25k, 0.5% for AGIs $25k-50k, -0.1% for AGIs $50k-75k, 1.8% for AGIs $75k-100k, 0.8% for AGIs over 100k)
Profit/loss from business: +$11,434 (reported on 15.7% of returns)
Here:
+$11,434
State:
+$13,809
(% of AGI for various income ranges: 10.6% for AGIs below $10k, 6.3% for AGIs $10k-25k, 4.4% for AGIs $25k-50k, 3.2% for AGIs $50k-75k, 4.7% for AGIs over 100k)
Profit/loss from farming: +$7,600 (reported on 1.6% of returns)
Here:
+$7,600
State:
-$2,666
IRA payment deduction: $2,909 (reported on 3.5% of returns)
10969:
$2,909
New York:
$3,115
Total itemized deductions: $20,079 (26% of AGI, reported on 42.2% of returns)
Here:
$20,079
State:
$25,864
Here:
25.9% of AGI
State:
21.9% of AGI
(% of AGI for various income ranges: 15.2% for AGIs $10k-25k, 13.3% for AGIs $25k-50k, 20.6% for AGIs $50k-75k, 22.4% for AGIs $75k-100k, 19.3% for AGIs over 100k)
Charity contributions deductions: $1,864 (2% of AGI, reported on 39.7% of returns)
Here:
$1,864
State:
$4,439
Here:
2.3% of AGI
State:
3.6% of AGI
(% of AGI for various income ranges: 1.4% for AGIs $10k-25k, 1.1% for AGIs $25k-50k, 1.8% for AGIs $50k-75k, 1.9% for AGIs $75k-100k, 1.8% for AGIs over 100k)
Total tax: $6,404 (reported on 77.5% of returns)
10969:
$6,404
State:
$11,730
(% of AGI for various income ranges: 2.8% for AGIs below $10k, 5.8% for AGIs $10k-25k, 7.5% for AGIs $25k-50k, 9.0% for AGIs $50k-75k, 8.9% for AGIs $75k-100k, 15.8% for AGIs over 100k)
Earned income credit: $1,370 (reported on 11.6% of returns)
Here:
$1,370
State:
$1,757
Percentage of individuals using paid preparers for their 2004 taxes: 65.7%
Here:
66%
State:
67%
(% for various income ranges: 56.8% for AGIs below $10k, 66.9% for AGIs $10k-25k, 63.2% for AGIs $25k-50k, 69.1% for AGIs $50k-75k, 72.7% for AGIs $75k-100k, 75.0% for AGIs over 100k)
Household received Food Stamps/SNAP in the past 12 months: 10 Household did not receive Food Stamps/SNAP in the past 12 months: 329
Women who had a birth in the past 12 months: 23 (23 now married, 0 unmarried) Women who did not have a birth in the past 12 months: 152 (79 now married, 70 unmarried)
Housing units in zip code 10969 with a mortgage: 271 (44 second mortgage, 35 both second mortgage and home equity loan) Houses without a mortgage: 14
Median monthly owner costs for units with a mortgage: $2,694 Median monthly owner costs for units without a mortgage: $1,261
Median number of rooms in houses and condos:
Here:
7.2
State:
6.3
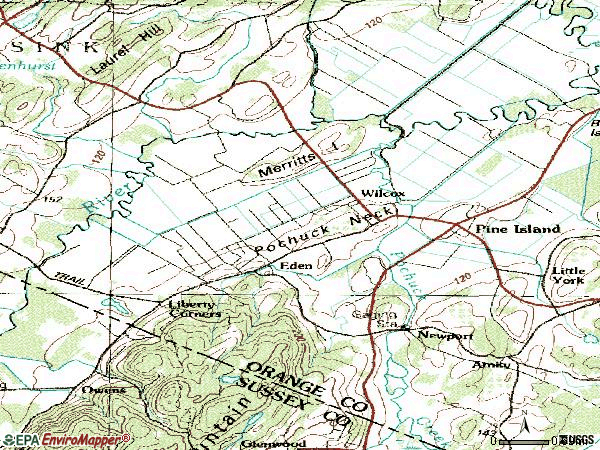
Notable locations in this zip code not listed on our city pages
Notable locations in zip code 10969: Pine Island Turf Nursery (A), Scenic Farms Golf Course (B), Liberty Corners (C), Pine Island Fire Department (D). Display/hide their locations on the map
Size of family households: 64 2-persons, 40 3-persons, 16 4-persons, 69 5-persons, 26 6-persons
Size of nonfamily households: 125 1-person
292 married couples with children.
0 single-parent households ().
91.1% of residents of 10969 zip code speak English at home.
6.3% of residents speak Spanish at home (89% very well, 11% well).
1.6% of residents speak other Indo-European language at home (100% very well).
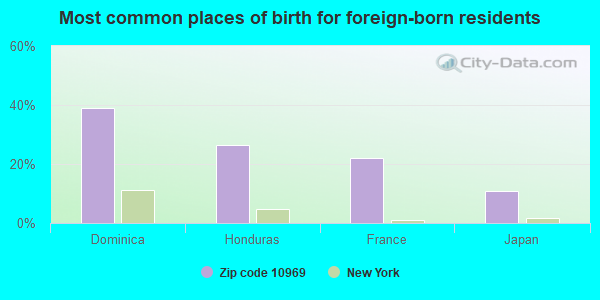
Foreign born population: 63 (6.5%) (36.6% of them are naturalized citizens)
This zip code:
6.5%
Whole state:
22.7%
39%Dominica
27%Honduras
22%France
11%Japan
28%American
20%Irish
16%Italian
8%Polish
8%German
7%European
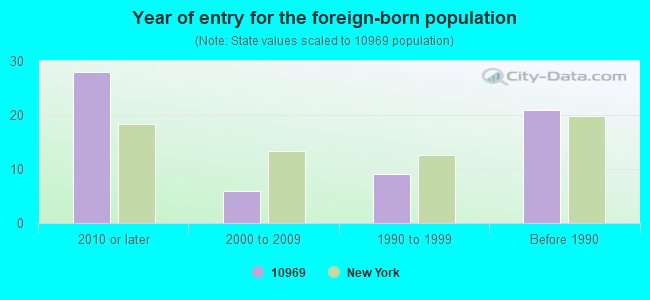
Year of entry for the foreign-born population
282010 or later
62000 to 2009
91990 to 1999
21Before 1990
Facilities with environmental interests located in this zip code:
EXON CO USA 38053 (PULASKI HWY & PINE ISLAND TNPK in PINE ISLAND, NY)
Conditionally Exempt Small Quantity Generators, less than 100 kg/month of hazardous waste (Resource Conservation and Recovery Act (tracking hazardous waste)) - notification Organizations: RAYMON F SHUBACK (CONTACT/OWNER)
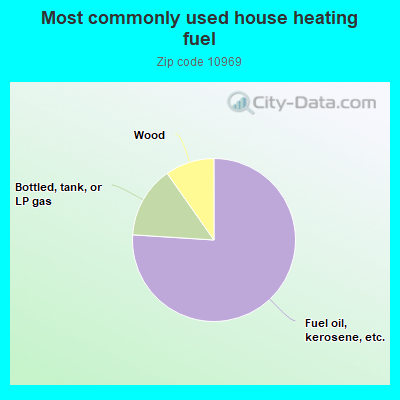
76.4%Fuel oil, kerosene, etc.
14.3%Bottled, tank, or LP gas
9.8%Wood
Population in 1990: 589. Population change in the 1990s: +495 (+84.0%).
Place of birth for U.S.-born residents:
This state: 640
Northeast: 256
West: 21
80% of the 10969 zip code residents lived in the same house 5 years ago. Out of people who lived in different houses, 28% lived in this county. Out of people who lived in different counties, 50% lived in New York.
87% of the 10969 zip code residents lived in the same house 1 year ago. Out of people who lived in different houses, 79% moved from this county. Out of people who lived in different houses, 18% moved from different county within same state.
Private vs. public school enrollment:
Students in private schools in grades 1 to 8 (elementary and middle school):
Here:
0.0%
New York:
15.6%
Students in private schools in grades 9 to 12 (high school):
Here:
0.0%
New York:
15.0%
Students in private undergraduate colleges:
Here:
0.0%
New York:
39.2%
Occupation by median earnings in the past 12 months ($)
116,202Management occupations
101,080Education, training, and library occupations
87,802Health diagnosing and treating practitioners and other technical occupations
86,821Installation, maintenance, and repair occupations
40,829Office and administrative support occupations
10,905Food preparation and serving related occupations
Companies with federal contracts located in this zip code:
ROPEWAY CONSTRUCTION AND SERVI (360 NEWPORT BRIDGE RD in PINE ISLAND, NY; small business) : $116,400 in 9 contractsfrom 2001 to 2005
Contracts for Maintenance, Repair and Rebuilding of Equipment -- Rope, Cable, Chain, and Fittings, Maintenance, Repair or Alteration of Real Property -- Other Non-Building Facilities by Army Signed by year:2000: $0; 2001: $25,000; 2002: $0; 2003: $30,800; 2004: $28,650; 2005: $31,950; 2006: $0.
Biggest contracts:
$25,000 with Army for Maintenance, Repair and Rebuilding of Equipment -- Rope, Cable, Chain, and Fittings. Signed on 2001-05-17. Completion date: 2004-09-30.
$23,350, same as above.Signed on 2005-12-06. Completion date: 2005-09-30.
$21,250, same as above.Signed on 2004-12-15. Completion date: 2005-09-30.
$18,400, same as above.Signed on 2003-11-03. Completion date: 2004-09-30.
BUNDESDRUCKEREI GMBH (ORANIENSTR 91 in BERLIN, In)
$10,000 with Patent and Trademark Office/Under Secretary for Intellectual Property for Translation and Interpreting Services(Including Sign Language). Taking place in VA. Signed on 2000-11-15. Completion date: 2000-12-15.
Top industries in this zip code by the number of employees in 2005:
Wholesale Trade: Fresh Fruit and Vegetable Merchant Wholesalers (20-49 employees: 1 establishment, 10-19 employees: 1 establishment, 1-4 employees: 1 establishment)
Construction: Other Building Finishing Contractors (20-49: 1)
Accommodation and Food Services: Full-Service Restaurants (20-49: 1)
Wholesale Trade: Medical, Dental, and Hospital Equipment and Supplies Merchant Wholesalers (10-19: 1)
Other Services (except Public Administration): Civic and Social Organizations (10-19: 1)
Construction: Plumbing, Heating, and Air-Conditioning Contractors (5-9: 1, 1-4: 1)
Construction: Residential Remodelers (1-4: 4)
People in group quarters in 2000:
10 people in agriculture workers' dormitories on farms
Fatal accident statistics in 2012:
Fatal accident count: 1
Vehicles involved in fatal accidents: 1
Fatal accidents caused by drunken drivers: 0
Fatalities: 1
Persons involved in fatal accidents: 1
Pedestrians involved in fatal accidents: 0
Home Mortgage Disclosure Act Aggregated Statistics For Year 2009 (Based on 2 partial tracts)
A) FHA, FSA/RHS & VA Home Purchase Loans
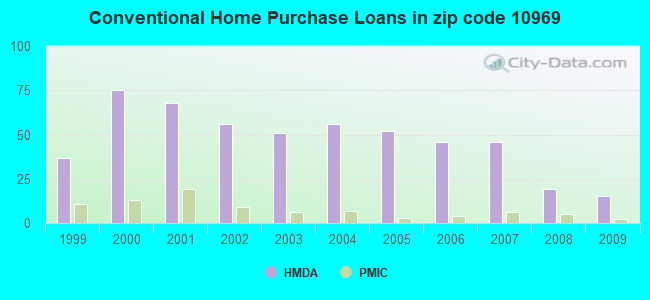
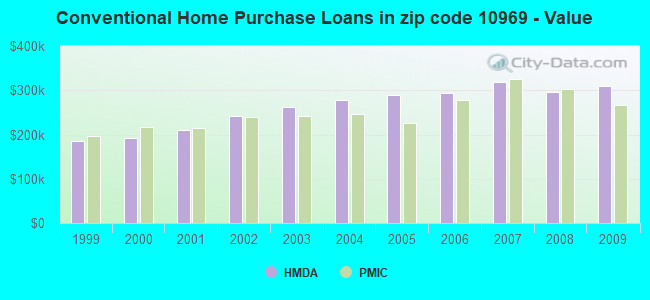
B) Conventional Home Purchase Loans
C) Refinancings
D) Home Improvement Loans
F) Non-occupant Loans on < 5 Family Dwellings (A B C & D)
Number
Average Value
Number
Average Value
Number
Average Value
Number
Average Value
Number
Average Value
LOANS ORIGINATED
7
$297,010
15
$310,387
54
$264,740
5
$125,740
2
$450,855
APPLICATIONS APPROVED, NOT ACCEPTED
0
$0
1
$349,280
8
$261,819
1
$150,660
0
$0
APPLICATIONS DENIED
2
$224,860
3
$191,190
29
$323,968
2
$227,125
0
$0
APPLICATIONS WITHDRAWN
1
$265,450
2
$312,465
18
$310,849
0
$0
1
$379,110
FILES CLOSED FOR INCOMPLETENESS
0
$0
1
$308,880
6
$314,855
0
$0
1
$132,540
Aggregated Statistics For Year 2008 (Based on 2 partial tracts)
A) FHA, FSA/RHS & VA Home Purchase Loans
B) Conventional Home Purchase Loans
C) Refinancings
D) Home Improvement Loans
F) Non-occupant Loans on < 5 Family Dwellings (A B C & D)
Number
Average Value
Number
Average Value
Number
Average Value
Number
Average Value
Number
Average Value
LOANS ORIGINATED
4
$285,938
19
$295,144
28
$254,098
8
$95,769
3
$191,443
APPLICATIONS APPROVED, NOT ACCEPTED
0
$0
4
$245,345
10
$280,255
3
$162,243
0
$0
APPLICATIONS DENIED
2
$172,565
8
$245,724
24
$250,302
6
$196,603
1
$140,470
APPLICATIONS WITHDRAWN
0
$0
3
$283,957
12
$336,096
1
$45,310
1
$176,340
FILES CLOSED FOR INCOMPLETENESS
0
$0
1
$105,730
3
$258,403
0
$0
0
$0
Aggregated Statistics For Year 2007 (Based on 2 partial tracts)
B) Conventional Home Purchase Loans
C) Refinancings
D) Home Improvement Loans
F) Non-occupant Loans on < 5 Family Dwellings (A B C & D)
Number
Average Value
Number
Average Value
Number
Average Value
Number
Average Value
LOANS ORIGINATED
46
$318,136
51
$258,671
14
$85,203
3
$376,970
APPLICATIONS APPROVED, NOT ACCEPTED
6
$345,378
17
$252,725
3
$109,503
1
$400,260
APPLICATIONS DENIED
10
$286,712
34
$267,474
5
$173,922
3
$262,053
APPLICATIONS WITHDRAWN
4
$358,060
22
$245,148
2
$196,920
0
$0
FILES CLOSED FOR INCOMPLETENESS
2
$294,905
10
$287,127
1
$243,550
0
$0
Aggregated Statistics For Year 2006 (Based on 2 partial tracts)
B) Conventional Home Purchase Loans
C) Refinancings
D) Home Improvement Loans
F) Non-occupant Loans on < 5 Family Dwellings (A B C & D)
Number
Average Value
Number
Average Value
Number
Average Value
Number
Average Value
LOANS ORIGINATED
46
$292,689
67
$244,471
15
$76,301
5
$164,710
APPLICATIONS APPROVED, NOT ACCEPTED
11
$311,143
16
$227,788
3
$57,647
2
$184,460
APPLICATIONS DENIED
10
$345,655
45
$290,718
8
$86,565
1
$216,360
APPLICATIONS WITHDRAWN
5
$312,804
24
$262,511
0
$0
1
$288,490
FILES CLOSED FOR INCOMPLETENESS
4
$297,170
11
$332,014
1
$94,400
0
$0
Aggregated Statistics For Year 2005 (Based on 2 partial tracts)
B) Conventional Home Purchase Loans
C) Refinancings
D) Home Improvement Loans
F) Non-occupant Loans on < 5 Family Dwellings (A B C & D)
Number
Average Value
Number
Average Value
Number
Average Value
Number
Average Value
LOANS ORIGINATED
52
$288,922
83
$266,768
17
$104,040
1
$246,570
APPLICATIONS APPROVED, NOT ACCEPTED
6
$269,732
12
$262,652
3
$108,497
1
$369,670
APPLICATIONS DENIED
7
$254,124
39
$251,588
13
$82,230
3
$155,823
APPLICATIONS WITHDRAWN
12
$265,327
47
$266,947
4
$110,260
2
$368,350
FILES CLOSED FOR INCOMPLETENESS
3
$254,880
6
$349,153
0
$0
2
$247,705
Aggregated Statistics For Year 2004 (Based on 2 partial tracts)
B) Conventional Home Purchase Loans
C) Refinancings
D) Home Improvement Loans
F) Non-occupant Loans on < 5 Family Dwellings (A B C & D)
Number
Average Value
Number
Average Value
Number
Average Value
Number
Average Value
LOANS ORIGINATED
56
$277,259
93
$225,322
12
$82,033
4
$177,660
APPLICATIONS APPROVED, NOT ACCEPTED
9
$287,689
19
$226,441
5
$79,824
1
$323,980
APPLICATIONS DENIED
9
$226,350
34
$226,571
13
$82,114
1
$214,850
APPLICATIONS WITHDRAWN
9
$275,983
46
$218,450
5
$93,268
2
$199,560
FILES CLOSED FOR INCOMPLETENESS
2
$167,090
6
$208,813
2
$44,370
0
$0
Aggregated Statistics For Year 2003 (Based on 2 partial tracts)
A) FHA, FSA/RHS & VA Home Purchase Loans
B) Conventional Home Purchase Loans
C) Refinancings
D) Home Improvement Loans
F) Non-occupant Loans on < 5 Family Dwellings (A B C & D)
Number
Average Value
Number
Average Value
Number
Average Value
Number
Average Value
Number
Average Value
LOANS ORIGINATED
1
$200,130
51
$261,729
241
$200,734
14
$57,099
6
$245,818
APPLICATIONS APPROVED, NOT ACCEPTED
0
$0
11
$239,947
43
$198,802
3
$104,847
1
$177,850
APPLICATIONS DENIED
0
$0
7
$215,340
58
$200,441
7
$64,947
2
$120,830
APPLICATIONS WITHDRAWN
0
$0
5
$291,054
37
$205,057
3
$58,403
2
$212,400
FILES CLOSED FOR INCOMPLETENESS
0
$0
2
$300,190
13
$205,269
1
$230,340
0
$0
Aggregated Statistics For Year 2002 (Based on 2 partial tracts)
A) FHA, FSA/RHS & VA Home Purchase Loans
B) Conventional Home Purchase Loans
C) Refinancings
D) Home Improvement Loans
F) Non-occupant Loans on < 5 Family Dwellings (A B C & D)
Number
Average Value
Number
Average Value
Number
Average Value
Number
Average Value
Number
Average Value
LOANS ORIGINATED
1
$126,500
56
$241,664
139
$188,371
15
$45,085
3
$166,017
APPLICATIONS APPROVED, NOT ACCEPTED
0
$0
10
$247,743
21
$178,030
5
$47,804
0
$0
APPLICATIONS DENIED
0
$0
5
$223,916
26
$165,563
12
$43,077
0
$0
APPLICATIONS WITHDRAWN
0
$0
5
$216,592
33
$167,780
7
$53,997
0
$0
FILES CLOSED FOR INCOMPLETENESS
0
$0
3
$225,680
10
$186,950
0
$0
0
$0
Aggregated Statistics For Year 2001 (Based on 2 partial tracts)
A) FHA, FSA/RHS & VA Home Purchase Loans
B) Conventional Home Purchase Loans
C) Refinancings
D) Home Improvement Loans
F) Non-occupant Loans on < 5 Family Dwellings (A B C & D)
Number
Average Value
Number
Average Value
Number
Average Value
Number
Average Value
Number
Average Value
LOANS ORIGINATED
1
$147,640
68
$209,301
90
$168,468
19
$32,971
2
$173,695
APPLICATIONS APPROVED, NOT ACCEPTED
0
$0
5
$272,174
12
$168,788
5
$55,960
0
$0
APPLICATIONS DENIED
0
$0
8
$203,810
31
$128,201
8
$41,630
0
$0
APPLICATIONS WITHDRAWN
0
$0
6
$156,515
30
$125,741
6
$33,418
0
$0
FILES CLOSED FOR INCOMPLETENESS
0
$0
0
$0
5
$95,760
0
$0
0
$0
Aggregated Statistics For Year 2000 (Based on 2 partial tracts)
A) FHA, FSA/RHS & VA Home Purchase Loans
B) Conventional Home Purchase Loans
C) Refinancings
D) Home Improvement Loans
F) Non-occupant Loans on < 5 Family Dwellings (A B C & D)
Number
Average Value
Number
Average Value
Number
Average Value
Number
Average Value
Number
Average Value
LOANS ORIGINATED
3
$141,853
75
$192,863
29
$124,816
26
$31,588
5
$127,554
APPLICATIONS APPROVED, NOT ACCEPTED
1
$118,190
8
$225,096
9
$102,330
5
$39,648
1
$126,120
APPLICATIONS DENIED
0
$0
18
$193,478
19
$123,694
9
$30,292
1
$76,650
APPLICATIONS WITHDRAWN
1
$86,090
10
$186,610
24
$96,697
3
$31,843
0
$0
FILES CLOSED FOR INCOMPLETENESS
0
$0
3
$139,460
6
$130,208
1
$23,790
0
$0
Aggregated Statistics For Year 1999 (Based on 1 partial tract)
A) FHA, FSA/RHS & VA Home Purchase Loans
B) Conventional Home Purchase Loans
C) Refinancings
D) Home Improvement Loans
F) Non-occupant Loans on < 5 Family Dwellings (A B C & D)
Detailed PMIC statistics for the following Tracts:0145.00
2004 - 2018 National Fire Incident Reporting System (NFIRS) incidents
Based on the data from the years 2004 - 2018 the average number of fires per year is 9. The highest number of fire incidents - 29 took place in 2015, and the least - 0 in 2005. The data has a rising trend.
When looking into fire subcategories, the most reports belonged to: Outside Fires (38.5%), and Structure Fires (37.8%).
Fire incident types reported to NFIRS in Zip Code 10969


+$7,600
-$2,666
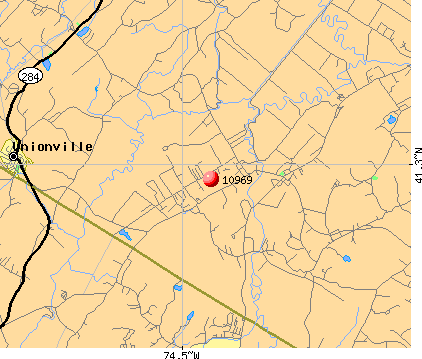 Nearest zip codes: 07418, 10998, 10988, 10933, 10973, 10958.
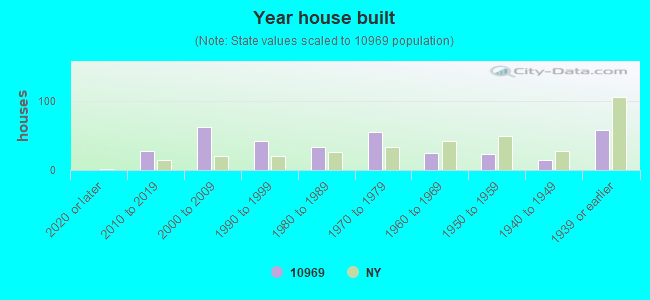


 Based on the data from the years 2004 - 2018 the average number of fires per year is 9. The highest number of fire incidents - 29 took place in 2015, and the least - 0 in 2005. The data has a rising trend.
 When looking into fire subcategories, the most reports belonged to: Outside Fires (38.5%), and Structure Fires (37.8%).