Estimated zip code population in 2022: 2,476 Zip code population in 2010: 2,249 Zip code population in 2000: 2,751
Houses and condos: 915 Renter-occupied apartments: 13
% of renters here:
1%
State:
35%
March 2022 cost of living index in zip code 07418: 106.2 (more than average, U.S. average is 100)
Land area: 4.7 sq. mi. Water area: 0.1 sq. mi.
Population density: 529 people per square mile
(low).
OSM Map
Google Map
MSN Map
OSM Map
General Map
Google Map
MSN Map
OSM Map
Google Map
MSN Map
OSM Map
Google Map
MSN Map
Please wait while loading the map...
Real estate property taxes paid for housing units in 2022:
This zip code:
2.4% ($7,975)
New Jersey:
2.1% ($8,897)
Median real estate property taxes paid for housing units with mortgages in 2022: $7,942 (2.4%) Median real estate property taxes paid for housing units with no mortgage in 2022: $8,038 (2.3%)
Business Search- 14 Million verified businesses
Males: 1,324
(53.5%)
Females: 1,152
(46.5%)
For population 25 years and over in 07418:
High school or higher: 96.9%
Bachelor's degree or higher: 43.9%
Graduate or professional degree: 28.2%
Unemployed: 0.4%
Mean travel time to work (commute): 38.3 minutes
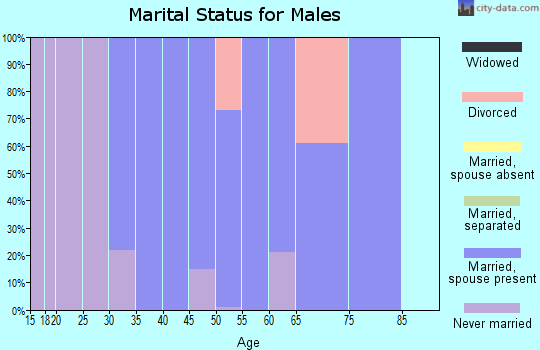
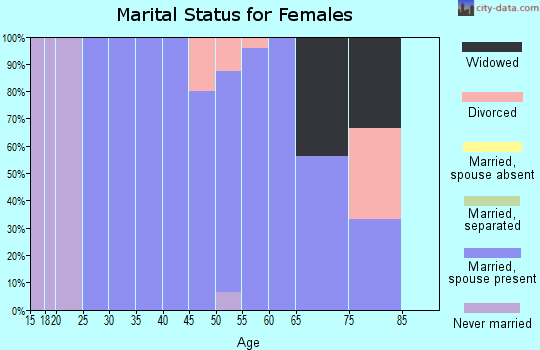
For population 15 years and over in 07418:
Never married: 23.6%
Now married: 54.6%
Separated: 0.9%
Widowed: 4.5%
Divorced: 16.3%
Zip code 07418 compared to state average:
Median household income above state average.
Unemployed percentage significantly below state average.
Black race population percentage below state average.
Foreign-born population percentage significantly below state average.
Renting percentage significantly below state average.
Length of stay since moving in significantly above state average.
Estimated median house/condo value in 2022: $330,811
07418:
$330,811
New Jersey:
$428,900
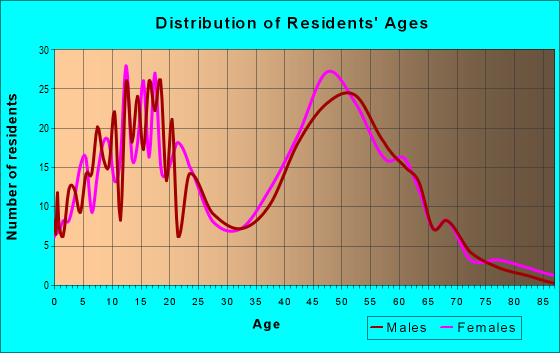
Median resident age:
This zip code:
40.8 years
New Jersey median age:
40.4 years
Average household size:
This zip code:
2.7 people
New Jersey:
2.6 people
Averages for the 2020 tax year for zip code 07418, filed in 2021:
Average Adjusted Gross Income (AGI) in 2020: $86,437 (Individual Income Tax Returns)
Here:
$86,437
State:
$95,247
Salary/wage: $75,644 (reported on 82.7% of returns)
Here:
$75,644
State:
$80,635
(% of AGI for various income ranges: 1174.4% for AGIs below $25k, 3508.7% for AGIs $25k-50k, 6868.9% for AGIs $50k-75k, 8193.0% for AGIs $75k-100k, 17582.4% for AGIs $100k-200k, 58096.7% for AGIs over 200k)
Taxable interest for individuals: $846 (reported on 33.6% of returns)
This zip code:
$846
New Jersey:
$2,414
(% of AGI for various income ranges: 15.6% for AGIs below $25k, 22.0% for AGIs $25k-50k, 46.7% for AGIs $50k-75k, 24.0% for AGIs $75k-100k, 62.4% for AGIs $100k-200k, 276.7% for AGIs over 200k)
Ordinary dividends: $2,768 (reported on 25.5% of returns)
Here:
$2,768
State:
$8,057
(% of AGI for various income ranges: 31.2% for AGIs below $25k, 66.7% for AGIs $25k-50k, 44.4% for AGIs $50k-75k, 122.0% for AGIs $75k-100k, 102.9% for AGIs $100k-200k, 960.0% for AGIs over 200k)
Net capital gain/loss in AGI: +$6,768 (reported on 20.0% of returns)
Here:
+$6,768
State:
+$25,022
(% of AGI for various income ranges: 8.1% for AGIs below $25k, 40.0% for AGIs $25k-50k, 53.3% for AGIs $50k-75k, 12.0% for AGIs $75k-100k, 154.1% for AGIs $100k-200k, 3646.7% for AGIs over 200k)
Profit/loss from business: +$13,687 (reported on 13.6% of returns)
Here:
+$13,687
State:
+$18,035
(% of AGI for various income ranges: 42.5% for AGIs below $25k, 393.3% for AGIs $25k-50k, 28.0% for AGIs $75k-100k, 804.1% for AGIs $100k-200k)
Taxable individual retirement arrangement distribution: $16,591 (reported on 10.0% of returns)
07418:
$16,591
New Jersey:
$21,558
(% of AGI for various income ranges: 165.3% for AGIs $25k-50k, 538.9% for AGIs $50k-75k, 642.4% for AGIs $100k-200k)
Total itemized deductions: $28,653 (reported on 13.6% of returns)
Here:
$28,653
State:
$32,863
(% of AGI for various income ranges: 457.5% for AGIs below $25k, 696.7% for AGIs $50k-75k, 535.0% for AGIs $75k-100k, 898.8% for AGIs $100k-200k, 2920.0% for AGIs over 200k)
Charity contributions: $5,000 (reported on 10.9% of returns)
Here:
$5,000
State:
$7,880
(% of AGI for various income ranges: 46.0% for AGIs $25k-50k, 60.0% for AGIs $75k-100k, 112.4% for AGIs $100k-200k, 933.3% for AGIs over 200k)
Taxes paid: $9,360 (reported on 13.6% of returns)
07418:
$9,360
State:
$9,183
(% of AGI for various income ranges: 166.2% for AGIs below $25k, 250.0% for AGIs $50k-75k, 228.0% for AGIs $75k-100k, 276.5% for AGIs $100k-200k, 716.7% for AGIs over 200k)
Earned income credit: $1,533 (reported on 5.5% of returns)
Here:
$1,533
State:
$2,148
(% of AGI for various income ranges: 32.5% for AGIs below $25k, 26.7% for AGIs $25k-50k)
Percentage of individuals using paid preparers for their 2020 taxes: 93.6%
Here:
94%
State:
92%
(% for various income ranges: 92.3% for AGIs below $25k, 95.0% for AGIs $25k-50k, 92.9% for AGIs $50k-75k, 92.3% for AGIs $75k-100k, 93.1% for AGIs $100k-200k, 100.0% for AGIs over 200k)
Averages for the 2012 tax year for zip code 07418, filed in 2013:
Average Adjusted Gross Income (AGI) in 2012: $73,257 (Individual Income Tax Returns)
Here:
$73,257
State:
$79,688
Salary/wage: $66,713 (reported on 89.3% of returns)
Here:
$66,713
State:
$68,122
(% of AGI for various income ranges: 79.5% for AGIs below $25k, 74.4% for AGIs $25k-50k, 78.2% for AGIs $50k-75k, 80.5% for AGIs $75k-100k, 82.7% for AGIs $100k-200k, 84.4% for AGIs over 200k)
Taxable interest for individuals: $553 (reported on 38.4% of returns)
This zip code:
$553
New Jersey:
$2,193
(% of AGI for various income ranges: 1.6% for AGIs below $25k, 0.2% for AGIs $25k-50k, 0.2% for AGIs $50k-75k, 0.4% for AGIs $75k-100k, 0.2% for AGIs $100k-200k, 0.2% for AGIs over 200k)
Ordinary dividends: $1,816 (reported on 27.7% of returns)
Here:
$1,816
State:
$6,828
(% of AGI for various income ranges: 1.9% for AGIs below $25k, 0.5% for AGIs $25k-50k, 0.6% for AGIs $50k-75k, 0.4% for AGIs $75k-100k, 0.5% for AGIs $100k-200k, 1.3% for AGIs over 200k)
Profit/loss from business: +$12,122 (reported on 16.1% of returns)
Here:
+$12,122
State:
+$19,577
(% of AGI for various income ranges: 7.7% for AGIs below $25k, 6.1% for AGIs $25k-50k, 2.3% for AGIs $50k-75k, 1.5% for AGIs $75k-100k, 3.1% for AGIs $100k-200k)
Taxable individual retirement arrangement distribution: $12,382 (reported on 9.8% of returns)
07418:
$12,382
New Jersey:
$18,214
(% of AGI for various income ranges: 6.3% for AGIs below $25k, 2.6% for AGIs $50k-75k, 1.7% for AGIs $75k-100k, 1.8% for AGIs $100k-200k)
Total itemized deductions: $24,803 (23% of AGI, reported on 54.5% of returns)
Here:
$24,803
State:
$30,827
Here:
22.8% of AGI
State:
21.2% of AGI
(% of AGI for various income ranges: 16.2% for AGIs below $25k, 20.0% for AGIs $25k-50k, 18.4% for AGIs $50k-75k, 20.0% for AGIs $75k-100k, 19.4% for AGIs $100k-200k, 14.4% for AGIs over 200k)
Charity contributions: $1,976 (reported on 49.1% of returns)
Here:
$1,976
State:
$3,451
(% of AGI for various income ranges: 0.6% for AGIs below $25k, 1.1% for AGIs $25k-50k, 1.6% for AGIs $50k-75k, 1.1% for AGIs $75k-100k, 1.4% for AGIs $100k-200k, 1.4% for AGIs over 200k)
Taxes paid: $11,952 (reported on 54.5% of returns)
07418:
$11,952
State:
$15,801
(% of AGI for various income ranges: 6.2% for AGIs below $25k, 7.8% for AGIs $25k-50k, 8.4% for AGIs $50k-75k, 9.0% for AGIs $75k-100k, 9.4% for AGIs $100k-200k, 9.2% for AGIs over 200k)
Earned income credit: $1,871 (reported on 6.2% of returns)
Here:
$1,871
State:
$2,182
(% of AGI for various income ranges: 2.3% for AGIs below $25k, 0.6% for AGIs $25k-50k)
Percentage of individuals using paid preparers for their 2012 taxes: 64.3%
Here:
64%
State:
65%
(% for various income ranges: 54.3% for AGIs below $25k, 62.5% for AGIs $25k-50k, 62.5% for AGIs $50k-75k, 73.3% for AGIs $75k-100k, 73.1% for AGIs $100k-200k, 75.0% for AGIs over 200k)
Averages for the 2004 tax year for zip code 07418, filed in 2005:
Average Adjusted Gross Income (AGI) in 2004: $59,253 (Individual Income Tax Returns)
Here:
$59,253
State:
$64,921
Salary/wage: $56,205 (reported on 91.0% of returns)
Here:
$56,205
State:
$57,755
(% of AGI for various income ranges: 116.5% for AGIs below $10k, 74.2% for AGIs $10k-25k, 83.2% for AGIs $25k-50k, 84.5% for AGIs $50k-75k, 87.0% for AGIs $75k-100k, 87.6% for AGIs over 100k)
Taxable interest for individuals: $579 (reported on 57.4% of returns)
This zip code:
$579
New Jersey:
$2,068
(% of AGI for various income ranges: 6.3% for AGIs below $10k, 2.6% for AGIs $10k-25k, 0.5% for AGIs $25k-50k, 0.5% for AGIs $50k-75k, 0.4% for AGIs $75k-100k, 0.4% for AGIs over 100k)
Taxable dividends: $833 (reported on 32.3% of returns)
Here:
$833
State:
$3,959
(% of AGI for various income ranges: 1.9% for AGIs below $10k, 1.1% for AGIs $10k-25k, 0.4% for AGIs $25k-50k, 0.4% for AGIs $50k-75k, 0.5% for AGIs $75k-100k, 0.4% for AGIs over 100k)
Net capital gain/loss: +$1,547 (reported on 23.3% of returns)
Here:
+$1,547
State:
+$13,591
(% of AGI for various income ranges: -5.9% for AGIs below $10k, 0.3% for AGIs $10k-25k, 0.5% for AGIs $25k-50k, 0.3% for AGIs $50k-75k, -0.0% for AGIs $75k-100k, 1.3% for AGIs over 100k)
Profit/loss from business: +$14,041 (reported on 14.5% of returns)
Here:
+$14,041
State:
+$17,520
(% of AGI for various income ranges: 3.5% for AGIs $10k-25k, 8.0% for AGIs $25k-50k, 3.4% for AGIs $50k-75k, 3.8% for AGIs $75k-100k, 2.5% for AGIs over 100k)
IRA payment deduction: $3,500 (reported on 3.0% of returns)
07418:
$3,500
New Jersey:
$3,270
Total itemized deductions: $20,962 (23% of AGI, reported on 55.2% of returns)
Here:
$20,962
State:
$23,924
Here:
23.1% of AGI
State:
21.1% of AGI
(% of AGI for various income ranges: 18.5% for AGIs below $10k, 16.9% for AGIs $10k-25k, 22.4% for AGIs $25k-50k, 21.8% for AGIs $50k-75k, 21.5% for AGIs $75k-100k, 17.5% for AGIs over 100k)
Charity contributions deductions: $2,132 (2% of AGI, reported on 50.5% of returns)
Here:
$2,132
State:
$3,242
Here:
2.3% of AGI
State:
2.7% of AGI
(% of AGI for various income ranges: 1.3% for AGIs $10k-25k, 1.6% for AGIs $25k-50k, 1.9% for AGIs $50k-75k, 1.8% for AGIs $75k-100k, 1.9% for AGIs over 100k)
Total tax: $8,523 (reported on 80.0% of returns)
07418:
$8,523
State:
$12,321
(% of AGI for various income ranges: 3.2% for AGIs below $10k, 5.6% for AGIs $10k-25k, 7.7% for AGIs $25k-50k, 7.9% for AGIs $50k-75k, 9.3% for AGIs $75k-100k, 15.4% for AGIs over 100k)
Earned income credit: $1,282 (reported on 6.0% of returns)
Here:
$1,282
State:
$1,711
Percentage of individuals using paid preparers for their 2004 taxes: 64.6%
Here:
65%
State:
65%
(% for various income ranges: 55.8% for AGIs below $10k, 57.7% for AGIs $10k-25k, 60.8% for AGIs $25k-50k, 72.4% for AGIs $50k-75k, 71.6% for AGIs $75k-100k, 70.3% for AGIs over 100k)
Household received Food Stamps/SNAP in the past 12 months: 19 Household did not receive Food Stamps/SNAP in the past 12 months: 892
Women who did not have a birth in the past 12 months: 525 (234 now married, 289 unmarried)
Housing units in zip code 07418 with a mortgage: 699 (202 second mortgage, 28 home equity loan, 175 both second mortgage and home equity loan) Median monthly owner costs for units with a mortgage: $2,068 Median monthly owner costs for units without a mortgage: $1,056
Residents with income below the poverty level in 2022:
This zip code:
1.0%
Whole state:
9.7%
Residents with income below 50% of the poverty level in 2022:
This zip code:
1.0%
Whole state:
5.2%
Median number of rooms in houses and condos:
Here:
8.0
State:
6.8
Notable locations in this zip code not listed on our city pages
Size of family households: 305 2-persons, 61 3-persons, 232 4-persons, 44 5-persons, 39 6-persons
Size of nonfamily households: 61 1-person, 185 2-persons
523 married couples with children.
55 single-parent households (45 men, 10 women).
87.8% of residents of 07418 zip code speak English at home.
7.7% of residents speak Spanish at home (57% very well, 43% well).
3.7% of residents speak other Indo-European language at home (100% very well).
Foreign born population: 232 (9.4%) (53.5% of them are naturalized citizens)
This zip code:
9.4%
Whole state:
23.5%
28%Bolivia
23%Barbados
13%India
9%Greece
9%Chile
7%Mexico
7%Guatemala
42%German
9%Italian
7%American
6%Scottish
3%English
3%French Canadian
2%Polish
Year of entry for the foreign-born population
682010 or later
302000 to 2009
161990 to 1999
112Before 1990
Facilities with environmental interests located in this zip code:
HOBSON DONNA L (5 PILZ CT in GLENWOOD, NJ)
(Resource Conservation and Recovery Act (tracking hazardous waste))
72.8%Fuel oil, kerosene, etc.
15.3%Electricity
7.4%Bottled, tank, or LP gas
3.0%Other fuel
1.9%Utility gas
Population in 1990: 2,446. Population change in the 1990s: +305 (+12.5%).
Place of birth for U.S.-born residents:
This state: 1,556
Northeast: 587
Midwest: 12
South: 85
76% of the 07418 zip code residents lived in the same house 5 years ago. Out of people who lived in different houses, 69% lived in this county. Out of people who lived in different counties, 50% lived in New Jersey.
93% of the 07418 zip code residents lived in the same house 1 year ago. Out of people who lived in different houses, 43% moved from this county. Out of people who lived in different houses, 45% moved from different county within same state. Out of people who lived in different houses, 9% moved from abroad.
Private vs. public school enrollment:
Students in private schools in grades 1 to 8 (elementary and middle school):
Here:
0.0%
New Jersey:
12.3%
Students in private schools in grades 9 to 12 (high school):
Here:
0.0%
New Jersey:
13.1%
Students in private undergraduate colleges:
Here:
0.0%
New Jersey:
33.2%
Occupation by median earnings in the past 12 months ($)
106,426Production occupations
82,866Management occupations
78,901Construction and extraction occupations
75,891Health diagnosing and treating practitioners and other technical occupations
74,071Education, training, and library occupations
58,643Building and grounds cleaning and maintenance occupations
Top industries in this zip code by the number of employees in 2005:
Accommodation and Food Services: Limited-Service Restaurants (20-49 employees: 1 establishment)
Arts, Entertainment, and Recreation: Other Spectator Sports (10-19: 1)
Professional, Scientific, and Technical Services: Environmental Consulting Services (10-19: 1)
Other Services (except Public Administration): Other Personal and Household Goods Repair and Maintenance (10-19: 1)
Construction: Masonry Contractors (10-19: 1)
Administrative and Support and Waste Management and Remediation Services: Landscaping Services (5-9: 1, 1-4: 3)
Construction: Electrical Contractors (1-4: 2)
Construction: Plumbing, Heating, and Air-Conditioning Contractors (1-4: 2)
Arts, Entertainment, and Recreation: Fitness and Recreational Sports Centers (1-4: 2)
Construction: Residential Remodelers (1-4: 2)
People in group quarters in 2010:
3 people in workers' group living quarters and job corps centers
Fatal accident statistics in 2012:
Fatal accident count: 1
Vehicles involved in fatal accidents: 1
Fatal accidents caused by drunken drivers: 1
Fatalities: 1
Persons involved in fatal accidents: 4
Pedestrians involved in fatal accidents: 0
Home Mortgage Disclosure Act Aggregated Statistics For Year 2009 (Based on 4 partial tracts)
A) FHA, FSA/RHS & VA Home Purchase Loans
B) Conventional Home Purchase Loans
C) Refinancings
D) Home Improvement Loans
F) Non-occupant Loans on < 5 Family Dwellings (A B C & D)
Number
Average Value
Number
Average Value
Number
Average Value
Number
Average Value
Number
Average Value
LOANS ORIGINATED
10
$234,190
12
$180,793
96
$209,536
6
$104,693
1
$174,530
APPLICATIONS APPROVED, NOT ACCEPTED
0
$0
1
$124,700
10
$221,022
1
$6,130
0
$0
APPLICATIONS DENIED
2
$207,765
2
$204,740
46
$235,185
4
$39,015
0
$0
APPLICATIONS WITHDRAWN
0
$0
2
$273,920
28
$245,599
2
$144,875
0
$0
FILES CLOSED FOR INCOMPLETENESS
1
$176,430
0
$0
4
$228,482
1
$214,530
0
$0
Aggregated Statistics For Year 2008 (Based on 4 partial tracts)
A) FHA, FSA/RHS & VA Home Purchase Loans
B) Conventional Home Purchase Loans
C) Refinancings
D) Home Improvement Loans
F) Non-occupant Loans on < 5 Family Dwellings (A B C & D)
Number
Average Value
Number
Average Value
Number
Average Value
Number
Average Value
Number
Average Value
LOANS ORIGINATED
8
$248,855
20
$224,492
69
$214,047
9
$84,048
3
$210,247
APPLICATIONS APPROVED, NOT ACCEPTED
1
$163,730
2
$245,905
9
$207,502
3
$46,427
0
$0
APPLICATIONS DENIED
0
$0
2
$235,300
51
$246,357
8
$59,955
2
$297,685
APPLICATIONS WITHDRAWN
3
$228,787
2
$250,535
24
$251,718
3
$149,970
1
$68,800
FILES CLOSED FOR INCOMPLETENESS
0
$0
1
$294,920
5
$327,390
1
$180,640
2
$253,725
Aggregated Statistics For Year 2007 (Based on 4 partial tracts)
A) FHA, FSA/RHS & VA Home Purchase Loans
B) Conventional Home Purchase Loans
C) Refinancings
D) Home Improvement Loans
F) Non-occupant Loans on < 5 Family Dwellings (A B C & D)
G) Loans On Manufactured Home Dwelling (A B C & D)
Number
Average Value
Number
Average Value
Number
Average Value
Number
Average Value
Number
Average Value
Number
Average Value
LOANS ORIGINATED
3
$337,257
41
$233,876
93
$192,890
29
$53,325
3
$142,180
0
$0
APPLICATIONS APPROVED, NOT ACCEPTED
0
$0
9
$203,531
22
$179,288
5
$54,536
0
$0
0
$0
APPLICATIONS DENIED
2
$245,915
7
$195,470
72
$230,506
13
$39,930
1
$245,230
1
$36,060
APPLICATIONS WITHDRAWN
0
$0
3
$270,683
36
$193,816
3
$116,833
0
$0
0
$0
FILES CLOSED FOR INCOMPLETENESS
0
$0
1
$303,280
13
$268,081
0
$0
0
$0
0
$0
Aggregated Statistics For Year 2006 (Based on 4 partial tracts)
A) FHA, FSA/RHS & VA Home Purchase Loans
B) Conventional Home Purchase Loans
C) Refinancings
D) Home Improvement Loans
F) Non-occupant Loans on < 5 Family Dwellings (A B C & D)
Number
Average Value
Number
Average Value
Number
Average Value
Number
Average Value
Number
Average Value
LOANS ORIGINATED
2
$239,760
40
$212,258
136
$184,929
29
$81,498
8
$191,635
APPLICATIONS APPROVED, NOT ACCEPTED
1
$203,000
4
$251,475
28
$169,542
5
$67,186
2
$250,340
APPLICATIONS DENIED
0
$0
5
$245,844
63
$218,151
21
$69,771
2
$194,730
APPLICATIONS WITHDRAWN
1
$183,240
2
$345,365
54
$198,314
8
$130,430
0
$0
FILES CLOSED FOR INCOMPLETENESS
0
$0
4
$189,890
22
$219,059
0
$0
0
$0
Aggregated Statistics For Year 2005 (Based on 4 partial tracts)
A) FHA, FSA/RHS & VA Home Purchase Loans
B) Conventional Home Purchase Loans
C) Refinancings
D) Home Improvement Loans
F) Non-occupant Loans on < 5 Family Dwellings (A B C & D)
Number
Average Value
Number
Average Value
Number
Average Value
Number
Average Value
Number
Average Value
LOANS ORIGINATED
2
$302,600
59
$214,103
147
$204,088
31
$70,591
7
$199,581
APPLICATIONS APPROVED, NOT ACCEPTED
0
$0
7
$214,484
24
$191,072
5
$141,646
1
$458,710
APPLICATIONS DENIED
1
$183,240
10
$198,405
54
$207,098
8
$91,865
2
$177,830
APPLICATIONS WITHDRAWN
1
$305,180
9
$213,428
55
$188,725
6
$153,080
2
$202,995
FILES CLOSED FOR INCOMPLETENESS
0
$0
6
$209,512
30
$215,607
0
$0
0
$0
Aggregated Statistics For Year 2004 (Based on 4 partial tracts)
A) FHA, FSA/RHS & VA Home Purchase Loans
B) Conventional Home Purchase Loans
C) Refinancings
D) Home Improvement Loans
F) Non-occupant Loans on < 5 Family Dwellings (A B C & D)
Number
Average Value
Number
Average Value
Number
Average Value
Number
Average Value
Number
Average Value
LOANS ORIGINATED
1
$141,010
64
$192,660
155
$169,866
17
$78,492
4
$268,205
APPLICATIONS APPROVED, NOT ACCEPTED
0
$0
7
$190,711
20
$157,517
3
$24,443
1
$268,390
APPLICATIONS DENIED
1
$299,730
7
$175,401
52
$180,922
14
$90,866
2
$257,210
APPLICATIONS WITHDRAWN
1
$175,060
9
$140,604
38
$170,236
6
$90,232
2
$167,235
FILES CLOSED FOR INCOMPLETENESS
0
$0
1
$183,550
14
$201,909
1
$34,060
0
$0
Aggregated Statistics For Year 2003 (Based on 4 partial tracts)
A) FHA, FSA/RHS & VA Home Purchase Loans
B) Conventional Home Purchase Loans
C) Refinancings
D) Home Improvement Loans
F) Non-occupant Loans on < 5 Family Dwellings (A B C & D)
Number
Average Value
Number
Average Value
Number
Average Value
Number
Average Value
Number
Average Value
LOANS ORIGINATED
5
$165,668
34
$179,068
317
$154,339
17
$45,657
5
$163,474
APPLICATIONS APPROVED, NOT ACCEPTED
0
$0
6
$195,400
52
$145,788
8
$39,689
0
$0
APPLICATIONS DENIED
0
$0
5
$177,962
104
$165,069
15
$30,530
3
$197,420
APPLICATIONS WITHDRAWN
1
$201,640
3
$212,857
52
$158,688
2
$56,755
1
$145,680
FILES CLOSED FOR INCOMPLETENESS
0
$0
2
$208,685
11
$168,685
1
$37,780
1
$69,120
Aggregated Statistics For Year 2002 (Based on 4 partial tracts)
A) FHA, FSA/RHS & VA Home Purchase Loans
B) Conventional Home Purchase Loans
C) Refinancings
D) Home Improvement Loans
F) Non-occupant Loans on < 5 Family Dwellings (A B C & D)
Number
Average Value
Number
Average Value
Number
Average Value
Number
Average Value
Number
Average Value
LOANS ORIGINATED
3
$198,180
38
$169,471
191
$147,061
16
$44,842
8
$152,451
APPLICATIONS APPROVED, NOT ACCEPTED
0
$0
6
$176,063
29
$127,862
5
$22,430
0
$0
APPLICATIONS DENIED
0
$0
5
$137,694
59
$119,179
14
$31,720
1
$137,840
APPLICATIONS WITHDRAWN
0
$0
3
$140,773
33
$130,968
5
$54,166
1
$27,650
FILES CLOSED FOR INCOMPLETENESS
1
$106,270
2
$104,375
21
$144,037
0
$0
0
$0
Aggregated Statistics For Year 2001 (Based on 4 partial tracts)
A) FHA, FSA/RHS & VA Home Purchase Loans
B) Conventional Home Purchase Loans
C) Refinancings
D) Home Improvement Loans
Number
Average Value
Number
Average Value
Number
Average Value
Number
Average Value
LOANS ORIGINATED
12
$162,245
41
$173,279
113
$142,541
15
$46,167
APPLICATIONS APPROVED, NOT ACCEPTED
1
$198,300
3
$83,903
26
$93,087
6
$20,335
APPLICATIONS DENIED
1
$198,300
4
$94,638
57
$118,880
13
$22,765
APPLICATIONS WITHDRAWN
2
$117,140
3
$191,797
33
$141,483
7
$37,236
FILES CLOSED FOR INCOMPLETENESS
0
$0
1
$76,770
11
$126,253
1
$34,060
Aggregated Statistics For Year 2000 (Based on 4 partial tracts)
A) FHA, FSA/RHS & VA Home Purchase Loans
B) Conventional Home Purchase Loans
C) Refinancings
D) Home Improvement Loans
F) Non-occupant Loans on < 5 Family Dwellings (A B C & D)
Number
Average Value
Number
Average Value
Number
Average Value
Number
Average Value
Number
Average Value
LOANS ORIGINATED
7
$127,300
37
$140,724
35
$93,575
26
$30,712
2
$104,655
APPLICATIONS APPROVED, NOT ACCEPTED
1
$65,630
6
$163,083
14
$57,966
5
$28,072
0
$0
APPLICATIONS DENIED
2
$89,150
3
$107,943
33
$78,195
8
$37,049
1
$153,270
APPLICATIONS WITHDRAWN
1
$163,600
1
$131,380
14
$82,311
3
$28,007
0
$0
FILES CLOSED FOR INCOMPLETENESS
0
$0
0
$0
11
$144,161
0
$0
0
$0
Aggregated Statistics For Year 1999 (Based on 2 partial tracts)
A) FHA, FSA/RHS & VA Home Purchase Loans
B) Conventional Home Purchase Loans
C) Refinancings
D) Home Improvement Loans
F) Non-occupant Loans on < 5 Family Dwellings (A B C & D)


 Nearest zip codes: 07462, 10969, 07422, 10988, 10998, 07419.