Estimated zip code population in 2022: 9,415 Zip code population in 2010: 8,344 Zip code population in 2000: 7,975
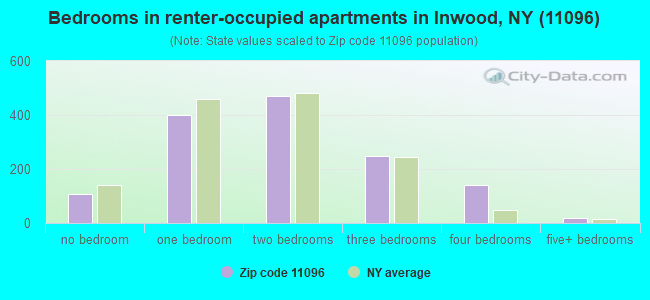
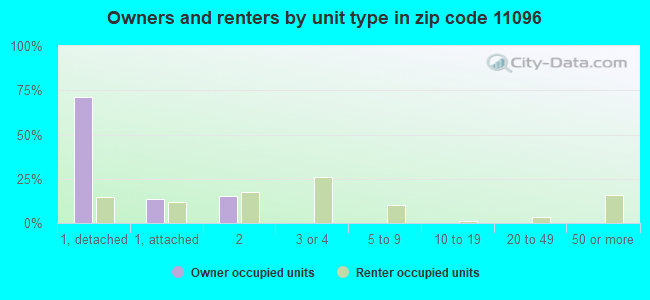
Houses and condos: 2,752 Renter-occupied apartments: 1,392
% of renters here:
53%
State:
46%
March 2022 cost of living index in zip code 11096: 153.8 (very high, U.S. average is 100)
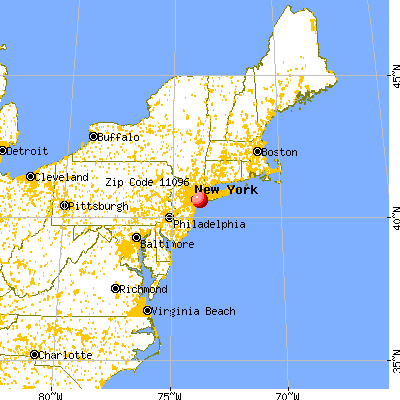
Land area: 1.2 sq. mi. Water area: 0.5 sq. mi.
Population density: 7,704 people per square mile
(high).
OSM Map
General Map
Google Map
MSN Map
OSM Map
General Map
Google Map
MSN Map
OSM Map
General Map
Google Map
MSN Map
OSM Map
General Map
Google Map
MSN Map
Please wait while loading the map...
Real estate property taxes paid for housing units in 2022:
This zip code:
1.5% ($8,680)
New York:
1.5% ($6,180)
Median real estate property taxes paid for housing units with mortgages in 2022: $9,858 (1.8%) Median real estate property taxes paid for housing units with no mortgage in 2022: $7,800 (1.3%)
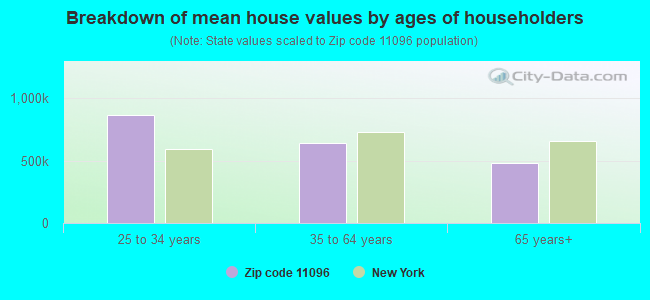
Estimated median house/condo value in 2022: $585,850
11096:
$585,850
New York:
$400,400
According to our research of New York and other state lists, there were 2 registered sex offenders living in 11096 zip code as of May 08, 2024. The ratio of all residents to sex offenders in zip code 11096 is 3,906 to 1. The ratio of registered sex offenders to all residents in this zip code is much lower than the state average.
Median resident age:
This zip code:
32.9 years
New York median age:
40.0 years
Average household size:
This zip code:
3.6 people
New York:
2.5 people
Averages for the 2020 tax year for zip code 11096, filed in 2021:
Average Adjusted Gross Income (AGI) in 2020: $44,310 (Individual Income Tax Returns)
Here:
$44,310
State:
$90,930
Salary/wage: $43,608 (reported on 76.5% of returns)
Here:
$43,608
State:
$72,104
(% of AGI for various income ranges: 1147.0% for AGIs below $25k, 3452.4% for AGIs $25k-50k, 6795.7% for AGIs $50k-75k, 10449.0% for AGIs $75k-100k, 17467.3% for AGIs $100k-200k)
Taxable interest for individuals: $1,344 (reported on 19.7% of returns)
This zip code:
$1,344
New York:
$3,075
(% of AGI for various income ranges: 8.2% for AGIs below $25k, 6.5% for AGIs $25k-50k, 9.5% for AGIs $50k-75k, 21.5% for AGIs $75k-100k, 31.4% for AGIs $100k-200k)
Ordinary dividends: $1,409 (reported on 7.2% of returns)
Here:
$1,409
State:
$11,095
(% of AGI for various income ranges: 7.5% for AGIs below $25k, 5.5% for AGIs $25k-50k, 18.1% for AGIs $50k-75k, 57.0% for AGIs $75k-100k, 26.8% for AGIs $100k-200k)
Net capital gain/loss in AGI: +$4,062 (reported on 7.2% of returns)
Here:
+$4,062
State:
+$44,925
(% of AGI for various income ranges: 0.8% for AGIs below $25k, 10.8% for AGIs $25k-50k, 9.0% for AGIs $50k-75k, 80.0% for AGIs $75k-100k, 234.5% for AGIs $100k-200k)
Profit/loss from business: +$10,105 (reported on 25.6% of returns)
Here:
+$10,105
State:
+$14,940
(% of AGI for various income ranges: 459.9% for AGIs below $25k, 284.1% for AGIs $25k-50k, 88.3% for AGIs $50k-75k, 212.5% for AGIs $75k-100k, 1236.4% for AGIs $100k-200k)
Taxable individual retirement arrangement distribution: $10,418 (reported on 2.5% of returns)
11096:
$10,418
New York:
$19,609
(% of AGI for various income ranges: 11.4% for AGIs below $25k, 15.5% for AGIs $25k-50k, 135.0% for AGIs $75k-100k, 273.6% for AGIs $100k-200k)
Total itemized deductions: $35,417 (reported on 7.9% of returns)
Here:
$35,417
State:
$39,326
(% of AGI for various income ranges: 45.7% for AGIs below $25k, 121.5% for AGIs $25k-50k, 341.7% for AGIs $50k-75k, 679.5% for AGIs $75k-100k, 1918.6% for AGIs $100k-200k)
Charity contributions: $14,576 (reported on 6.6% of returns)
Here:
$14,576
State:
$15,420
(% of AGI for various income ranges: 22.9% for AGIs $25k-50k, 54.0% for AGIs $50k-75k, 111.5% for AGIs $75k-100k, 432.3% for AGIs $100k-200k)
Taxes paid: $9,503 (reported on 7.9% of returns)
11096:
$9,503
State:
$9,183
(% of AGI for various income ranges: 11.3% for AGIs below $25k, 43.9% for AGIs $25k-50k, 122.4% for AGIs $50k-75k, 240.0% for AGIs $75k-100k, 600.9% for AGIs $100k-200k)
Earned income credit: $2,417 (reported on 22.6% of returns)
Here:
$2,417
State:
$2,138
(% of AGI for various income ranges: 136.4% for AGIs below $25k, 92.2% for AGIs $25k-50k)
Percentage of individuals using paid preparers for their 2020 taxes: 91.6%
Here:
92%
State:
95%
(% for various income ranges: 84.9% for AGIs below $25k, 96.6% for AGIs $25k-50k, 96.3% for AGIs $50k-75k, 100.0% for AGIs $75k-100k, 97.2% for AGIs $100k-200k, 100.0% for AGIs over 200k)
Averages for the 2012 tax year for zip code 11096, filed in 2013:
Average Adjusted Gross Income (AGI) in 2012: $36,143 (Individual Income Tax Returns)
Here:
$36,143
State:
$77,088
Salary/wage: $36,378 (reported on 79.5% of returns)
Here:
$36,378
State:
$60,593
(% of AGI for various income ranges: 67.0% for AGIs below $25k, 84.5% for AGIs $25k-50k, 85.9% for AGIs $50k-75k, 79.9% for AGIs $75k-100k, 80.1% for AGIs $100k-200k)
Taxable interest for individuals: $545 (reported on 23.4% of returns)
This zip code:
$545
New York:
$3,125
(% of AGI for various income ranges: 0.5% for AGIs below $25k, 0.3% for AGIs $25k-50k, 0.6% for AGIs $50k-75k, 0.3% for AGIs $75k-100k, 0.2% for AGIs $100k-200k)
Ordinary dividends: $1,493 (reported on 8.0% of returns)
Here:
$1,493
State:
$10,299
(% of AGI for various income ranges: 0.2% for AGIs below $25k, 0.2% for AGIs $25k-50k, 0.4% for AGIs $50k-75k, 0.4% for AGIs $75k-100k, 0.4% for AGIs $100k-200k)
Profit/loss from business: +$9,636 (reported on 21.3% of returns)
Here:
+$9,636
State:
+$16,168
(% of AGI for various income ranges: 22.3% for AGIs below $25k, 3.9% for AGIs $25k-50k, 2.4% for AGIs $50k-75k, 0.9% for AGIs $75k-100k, 1.2% for AGIs $100k-200k)
Taxable individual retirement arrangement distribution: $8,493 (reported on 4.0% of returns)
11096:
$8,493
New York:
$17,621
(% of AGI for various income ranges: 1.0% for AGIs below $25k, 0.8% for AGIs $25k-50k, 1.4% for AGIs $50k-75k, 2.0% for AGIs $75k-100k)
Total itemized deductions: $23,438 (33% of AGI, reported on 27.7% of returns)
Here:
$23,438
State:
$34,985
Here:
32.7% of AGI
State:
21.3% of AGI
(% of AGI for various income ranges: 9.0% for AGIs below $25k, 13.3% for AGIs $25k-50k, 20.2% for AGIs $50k-75k, 24.7% for AGIs $75k-100k, 23.1% for AGIs $100k-200k)
Charity contributions: $2,845 (reported on 23.1% of returns)
Here:
$2,845
State:
$5,572
(% of AGI for various income ranges: 0.5% for AGIs below $25k, 1.3% for AGIs $25k-50k, 2.1% for AGIs $50k-75k, 2.8% for AGIs $75k-100k, 2.5% for AGIs $100k-200k)
Taxes paid: $7,708 (reported on 27.7% of returns)
11096:
$7,708
State:
$18,656
(% of AGI for various income ranges: 2.4% for AGIs below $25k, 3.6% for AGIs $25k-50k, 6.6% for AGIs $50k-75k, 8.1% for AGIs $75k-100k, 8.9% for AGIs $100k-200k)
Earned income credit: $2,517 (reported on 29.5% of returns)
Here:
$2,517
State:
$2,230
(% of AGI for various income ranges: 9.8% for AGIs below $25k, 1.5% for AGIs $25k-50k)
Percentage of individuals using paid preparers for their 2012 taxes: 77.1%
Here:
77%
State:
66%
(% for various income ranges: 75.5% for AGIs below $25k, 77.9% for AGIs $25k-50k, 76.2% for AGIs $50k-75k, 83.3% for AGIs $75k-100k, 82.6% for AGIs $100k-200k)
Averages for the 2004 tax year for zip code 11096, filed in 2005:
Average Adjusted Gross Income (AGI) in 2004: $34,415 (Individual Income Tax Returns)
Here:
$34,415
State:
$59,519
Salary/wage: $33,904 (reported on 85.2% of returns)
Here:
$33,904
State:
$50,673
(% of AGI for various income ranges: 79.9% for AGIs below $10k, 76.9% for AGIs $10k-25k, 89.4% for AGIs $25k-50k, 88.6% for AGIs $50k-75k, 88.5% for AGIs $75k-100k, 71.3% for AGIs over 100k)
Taxable interest for individuals: $690 (reported on 35.9% of returns)
This zip code:
$690
New York:
$2,377
(% of AGI for various income ranges: 2.6% for AGIs below $10k, 1.2% for AGIs $10k-25k, 0.7% for AGIs $25k-50k, 0.5% for AGIs $50k-75k, 0.4% for AGIs $75k-100k, 0.5% for AGIs over 100k)
Taxable dividends: $1,105 (reported on 12.4% of returns)
Here:
$1,105
State:
$5,394
(% of AGI for various income ranges: 0.9% for AGIs below $10k, 0.5% for AGIs $10k-25k, 0.4% for AGIs $25k-50k, 0.3% for AGIs $50k-75k, 0.3% for AGIs $75k-100k, 0.4% for AGIs over 100k)
Net capital gain/loss: +$2,879 (reported on 7.4% of returns)
Here:
+$2,879
State:
+$23,581
(% of AGI for various income ranges: -1.6% for AGIs below $10k, -0.1% for AGIs $10k-25k, -0.1% for AGIs $25k-50k, 0.1% for AGIs $50k-75k, -0.0% for AGIs $75k-100k, 3.8% for AGIs over 100k)
Profit/loss from business: +$6,761 (reported on 13.6% of returns)
Here:
+$6,761
State:
+$13,809
(% of AGI for various income ranges: 12.0% for AGIs below $10k, 10.7% for AGIs $10k-25k, 2.8% for AGIs $25k-50k, 0.3% for AGIs $50k-75k, 0.4% for AGIs $75k-100k, -0.3% for AGIs over 100k)
IRA payment deduction: $2,721 (reported on 2.0% of returns)
11096:
$2,721
New York:
$3,115
(% of AGI for various income ranges: 0.1% for AGIs $10k-25k, 0.2% for AGIs $25k-50k, 0.1% for AGIs $50k-75k, 0.3% for AGIs $75k-100k)
Total itemized deductions: $18,648 (30% of AGI, reported on 32.5% of returns)
Here:
$18,648
State:
$25,864
Here:
30.2% of AGI
State:
21.9% of AGI
(% of AGI for various income ranges: 9.0% for AGIs below $10k, 9.7% for AGIs $10k-25k, 16.2% for AGIs $25k-50k, 20.7% for AGIs $50k-75k, 22.0% for AGIs $75k-100k, 20.1% for AGIs over 100k)
Charity contributions deductions: $3,010 (5% of AGI, reported on 29.4% of returns)
Here:
$3,010
State:
$4,439
Here:
4.7% of AGI
State:
3.6% of AGI
(% of AGI for various income ranges: 0.3% for AGIs below $10k, 1.0% for AGIs $10k-25k, 2.4% for AGIs $25k-50k, 3.0% for AGIs $50k-75k, 3.4% for AGIs $75k-100k, 3.2% for AGIs over 100k)
Total tax: $4,159 (reported on 68.6% of returns)
11096:
$4,159
State:
$11,730
(% of AGI for various income ranges: 4.4% for AGIs below $10k, 4.0% for AGIs $10k-25k, 5.8% for AGIs $25k-50k, 8.1% for AGIs $50k-75k, 9.8% for AGIs $75k-100k, 15.4% for AGIs over 100k)
Earned income credit: $1,876 (reported on 25.3% of returns)
Here:
$1,876
State:
$1,757
Percentage of individuals using paid preparers for their 2004 taxes: 78.0%
Here:
78%
State:
67%
(% for various income ranges: 71.5% for AGIs below $10k, 79.5% for AGIs $10k-25k, 78.9% for AGIs $25k-50k, 80.1% for AGIs $50k-75k, 79.5% for AGIs $75k-100k, 87.9% for AGIs over 100k)
Household received Food Stamps/SNAP in the past 12 months: 633 Household did not receive Food Stamps/SNAP in the past 12 months: 2,005
Women who had a birth in the past 12 months: 231 (166 now married, 64 unmarried) Women who did not have a birth in the past 12 months: 1,853 (629 now married, 1,226 unmarried)
Housing units in zip code 11096 with a mortgage: 739 (126 second mortgage, 42 home equity loan, 88 both second mortgage and home equity loan) Median monthly owner costs for units with a mortgage: $3,627 Median monthly owner costs for units without a mortgage: $1,339
Residents with income below the poverty level in 2022:
This zip code:
18.0%
Whole state:
14.3%
Residents with income below 50% of the poverty level in 2022:
This zip code:
9.1%
Whole state:
6.8%
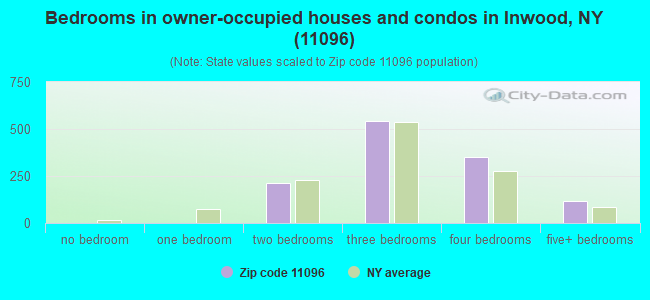
Median number of rooms in houses and condos:
Here:
6.7
State:
6.3
Median number of rooms in apartments:
Here:
4.3
State:
3.8
Notable locations in this zip code not listed on our city pages
Churches in zip code 11096 include: Kingdom Hall of Jehovah's Witnesses (A), Gethsemane Church of God (B), Fivetown Seventh Day Adventist Church (C), First Calvary Baptist Church (D), Jewish Community Center of Inwood (E), Community Bible Church (F), Saint Johns Baptist Church (G), Roman Catholic Church of Our Lady of Good Counsel (H). Display/hide their locations on the map
In group quarters: 10 (-1 institutionalized population)
Size of family households: 491 2-persons, 313 3-persons, 289 4-persons, 347 5-persons, 228 6-persons, 284 7-or-more-persons
Size of nonfamily households: 569 1-person, 54 2-persons, 7 4-persons
1,341 married couples with children.
391 single-parent households (119 men, 272 women).
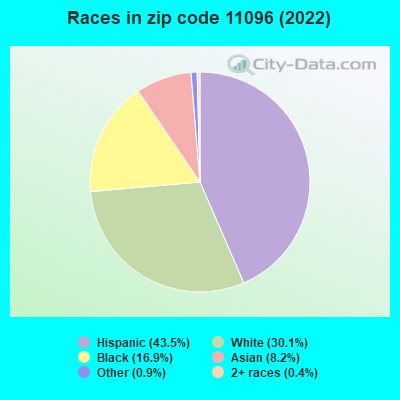
41.2% of residents of 11096 zip code speak English at home.
38.9% of residents speak Spanish at home (34% very well, 32% well, 27% not well, 7% not at all).
11.6% of residents speak other Indo-European language at home (70% very well, 21% well, 9% not at all).
2.8% of residents speak Asian or Pacific Island language at home (49% very well, 25% well, 27% not well).
5.5% of residents speak other language at home (48% very well, 21% well, 31% not well).
Foreign born population: 3,616 (38.4%) (50.2% of them are naturalized citizens)
This zip code:
38.4%
Whole state:
22.7%
25%Costa Rica
21%El Salvador
11%Guatemala
10%Nepal
6%Greece
5%Grenada
4%Haiti
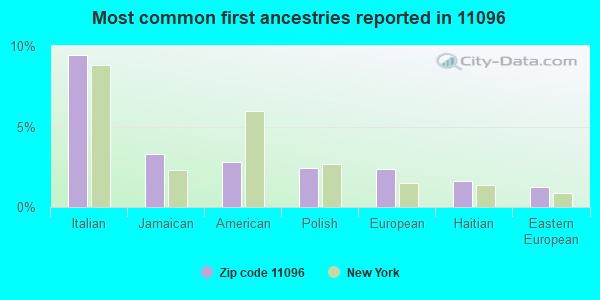
9%Italian
3%Jamaican
3%American
2%Polish
2%European
2%Haitian
1%Eastern European
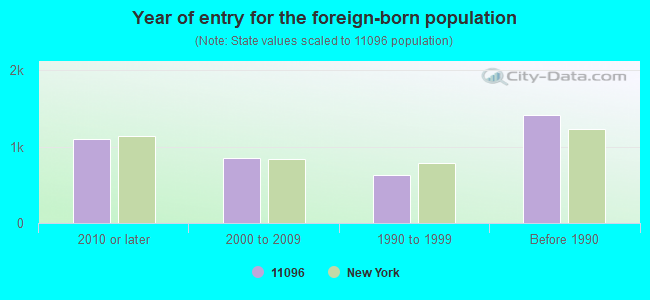
Year of entry for the foreign-born population
1,1052010 or later
8512000 to 2009
6271990 to 1999
1,414Before 1990
Facilities with environmental interests located in this zip code:
INWOOD TERMINAL (555 DOUGHTY BOULEVARD in INWOOD, NY)
AIR MINOR (AIRS/AFS) OIL CONTROL (Facility Response Plan for oil discharge) National Pollutant Discharge Elimination System NON-MAJOR (Tracking pollutant discharge elimination systems) - permit (Resource Conservation and Recovery Act (tracking hazardous waste)) Business SIC classification: PETROLEUM BULK STATIONS AND TERMINALS Organizations: CARBO CONCORD OIL (CONTACT/GENERAL)
, CARBO INDUSTRIES, INC (CONTACT/OWNER)
Alternative names: AMERican OIL inwood terminal, AMOCO OIL CO, CARBO INDUSTRIES, CARBO INDUSTSRIES, INC, VOLUMETRIC LABS
COLLISION SPECIALISTS OF INWOOD, INC (425 DOUGHTY BLVD in INWOOD, NY)
STATE MASTER (New York facility tracking) - AIR PROGRAM Conditionally Exempt Small Quantity Generators, less than 100 kg/month of hazardous waste (Resource Conservation and Recovery Act (tracking hazardous waste)) - notification Business SIC classification: TOP, BODY, AND UPHOLSTERY REPAIR SHOPS AND PAINT SHOPS Business NAICS classification: AUTOMOTIVE BODY, PAINT, AND INTERIOR REPAIR AND MAINTENANCE. Organizations: COLLISION SPECIALISTS OF INWOOD INC (AIR PERMITTING FACILITY OWNER CONTACT)
, SALVATORE CASANO (CONTACT/OWNER)
2 SCHOOL ( in INWOOD, NY)
(National Center for Education Statistics) - STATE ID-280215030002 Organizations: LAWRENCE UFSD (SCHOOL DISTRICT)
4 SCHOOL ( in INWOOD, NY)
(National Center for Education Statistics) - STATE ID-280215030004 Organizations: LAWRENCE UFSD (SCHOOL DISTRICT)
ALOHA FRENCH CLEANERS (454 SHERIDAN BLVD in INWOOD, NY)
AIR MINOR (AIRS/AFS) Small Quantity Generators, between 100 kg and 1000 kg of hazardous waste/month (Resource Conservation and Recovery Act (tracking hazardous waste)) - notification Business SIC classification: DRYCLEANING PLANTS, EXCEPT RUG CLEANING Organizations: BYUNG WHON KWON (CONTACT/OWNER)
GETTY PETROLEUM CORP (95 SHERIDAN BLVD in INWOOD, NY)
(Resource Conservation and Recovery Act (tracking hazardous waste))
HERCULES CORPORATION (120 NASSAU AVENUE in INWOOD, NY)
(Resource Conservation and Recovery Act (tracking hazardous waste))
INWOOD HOLDER STATION/LILCO (SHERIDAN BLVD in INWOOD, NY)
(Resource Conservation and Recovery Act (tracking hazardous waste))
J R TROPIA INC (167 DOUGHTY BLVD in INWOOD, NY)
(Resource Conservation and Recovery Act (tracking hazardous waste))
CONTROL INDUSTRIES INC (530 BURNSIDE AVE in INWOOD, NY)
(Resource Conservation and Recovery Act (tracking hazardous waste)) Business NAICS classification: PRECISION TURNED PRODUCT MANUFACTURING.
INWOOD COUNTRY CLUB (BAYWATER BLVD & SPRUCE RD in INWOOD, NY)
Conditionally Exempt Small Quantity Generators, less than 100 kg/month of hazardous waste (Resource Conservation and Recovery Act (tracking hazardous waste)) - notification
GRITSER'S SERVICE CENTER (5 MOTT AVENUE in INWOOD, NY)
ENFORCEMENT/COMPLIANCE ACTIVITY (Integrated Compliance Information System) Business SIC classification: GASOLINE SERVICE STATIONS
Housing units lacking complete plumbing facilities: 2.9% Housing units lacking complete kitchen facilities: 3.6%
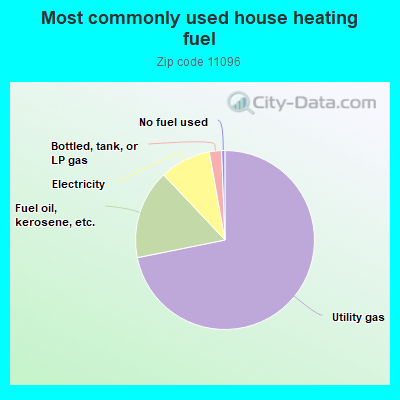
71.7%Utility gas
16.1%Fuel oil, kerosene, etc.
9.2%Electricity
2.2%Bottled, tank, or LP gas
0.6%No fuel used
Place of birth for U.S.-born residents:
This state: 4,995
Northeast: 101
Midwest: 8
South: 213
West: 98
68% of the 11096 zip code residents lived in the same house 5 years ago. Out of people who lived in different houses, 58% lived in this county. Out of people who lived in different counties, 50% lived in New York.
92% of the 11096 zip code residents lived in the same house 1 year ago. Out of people who lived in different houses, 41% moved from this county. Out of people who lived in different houses, 49% moved from different county within same state. Out of people who lived in different houses, 10% moved from different state.
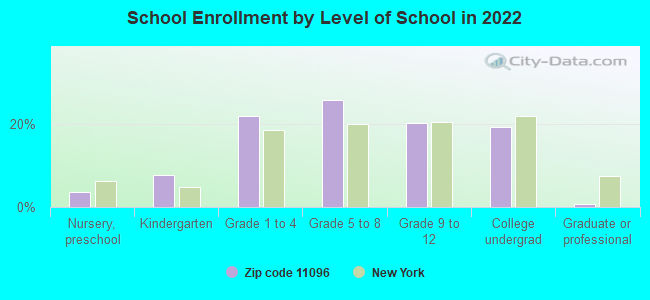
Private vs. public school enrollment:
Students in private schools in grades 1 to 8 (elementary and middle school): 324
Here:
29.9%
New York:
15.6%
Students in private schools in grades 9 to 12 (high school): 67
Here:
14.9%
New York:
15.0%
Students in private undergraduate colleges: 68
Here:
16.0%
New York:
39.2%
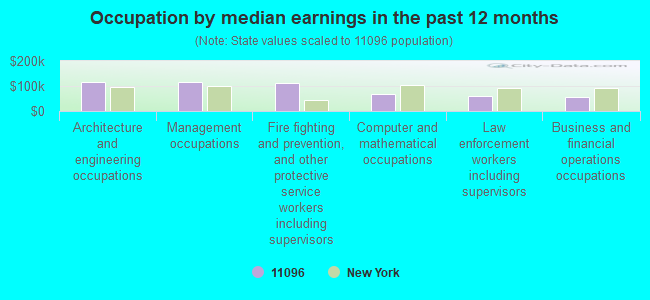
Occupation by median earnings in the past 12 months ($)
117,747Architecture and engineering occupations
114,622Management occupations
111,144Fire fighting and prevention, and other protective service workers including supervisors
69,699Computer and mathematical occupations
59,611Law enforcement workers including supervisors
57,647Business and financial operations occupations
Companies with federal contracts located in this zip code:
SIGNAL TRANSFORMER CO INC (500 BAYVIEW AVE in INWOOD, OH) : $9,625,724 in 18 contractsfrom 1999 to 2006
Contracts for Engine Cooling System Components, Nonaircraft by Army Signed by year:2000: $2,113,571; 2001: $2,071,875; 2002: $515,057; 2003: $1,380,447; 2004: $364,500; 2005: $1,799,017; 2006: $1,158,381.
Biggest contracts:
$1,954,302 with Army for Engine Cooling System Components, Nonaircraft. Taking place in WI. Signed on 2000-09-12. Completion date: 2001-12-31.
$1,348,748, same as above.Signed on 2003-03-26. Completion date: 2004-05-04.
$1,163,275, same as above.Signed on 2001-02-21. Completion date: 2002-04-30.
$1,158,381, same as above.Signed on 2006-02-08. Completion date: 2007-01-16.
M G R EQUIPMENT CORP (22 GATES AVE in INWOOD, NY; small business) : $865,390 in 27 contractsfrom 2001 to 2006
Contracts for Maintenance, Repair and Rebuilding of Equipment -- Refrigeration, Air Conditioning, and Air Circulating Equipment, Power and Hand Pumps, Motors, Electrical, Refrigeration and Air Conditioning Components, and moreby Air Force, Defense Logistics Agency, Navy Signed by year:2000: $0; 2001: $117,050; 2002: $121,475; 2003: $106,160; 2004: $264,838; 2005: $119,866; 2006: $136,001.
Biggest contracts:
$80,565 with Air Force for Maintenance, Repair and Rebuilding of Equipment -- Refrigeration, Air Conditioning, and Air Circulating Equipment. Signed on 2006-06-13. Completion date: 2006-09-25.
$80,250, same as above.Signed on 2001-09-26. Completion date: 2001-09-30.
$80,000, same as above.Signed on 2003-12-19. Completion date: 2004-03-19.
$80,000, same as above.Signed on 2004-06-30. Completion date: 2004-10-29.
MMC INTERNATIONAL CORP (60 INIP DR in INWOOD, NY) : $391,588 in 4 contractsfrom 2002 to 2006
$375,000 with Air Force for Defense Missile and Space Systems -- Basic Research (R&D). Taking place in MA. Signed on 2002-08-30. Completion date: 2004-11-30.
$7,808 with Defense Logistics Agency for Aircraft Ground Servicing Equipment. Signed on 2006-02-11. Completion date: 2006-03-18.
$5,720 with Navy for Non-nuclear Ship Repair (East) Ship repair (including overhauls and conversions) performed on non-nuclear propelled and nonpropelled ships east of the 108th meridian. Taking place in VA. Signed on 2005-09-15. Completion date: 2005-09-12.
$3,060 with Air Force for Maintenance, Repair and Rebuilding of Equipment -- Electrical and Electronic Equipment Components. Taking place in OK. Signed on 2005-04-25. Completion date: 2005-09-29.
BRUZZONE SHIPPING INC (530 BURNSIDE AVE in INWOOD FINANCE, NY; small business) : $62,264 in 6 contractsfrom 2005 to 2006
Contracts for Trailers, Maintenance, Repair and Rebuilding of Equipment -- Automatic Data Processing Equipment (Including Firmware), Software, Supplies and Support Equipment by Army Signed by year:2000: $0; 2001: $0; 2002: $0; 2003: $0; 2004: $0; 2005: $52,734; 2006: $9,530.
Biggest contracts:
$17,021 with Army for Trailers. Signed on 2005-07-21. Completion date: 2005-08-05.
$14,700, same as above.Signed on 2005-06-28. Completion date: 2005-07-08.
$9,530, same as above.Signed on 2006-02-16. Completion date: 2006-02-28.
$9,210 with Army for Maintenance, Repair and Rebuilding of Equipment -- Automatic Data Processing Equipment (Including Firmware), Software, Supplies and Support Equipment. Signed on 2005-02-08. Completion date: 2005-02-25.
Top industries in this zip code by the number of employees in 2005:
Accommodation and Food Services: Food Service Contractors (250-499 employees: 1 establishment)
Health Care and Social Assistance: Ambulance Services (100-249: 2, 20-49: 1)
Wholesale Trade: Other Electronic Parts and Equipment Merchant Wholesalers (50-99: 1, 20-49: 1, 1-4: 1)
Wholesale Trade: Service Establishment Equipment and Supplies Merchant Wholesalers (50-99: 1, 1-4: 2)
People in group quarters in 2010:
7 people in other noninstitutional facilities
2 people in nursing facilities/skilled-nursing facilities
People in group quarters in 2000:
4 people in homes for the mentally ill
4 people in religious group quarters
Fatal accident statistics in 2014:
Fatal accident count: 2
Vehicles involved in fatal accidents: 2
Fatal accidents caused by drunken drivers: 0
Fatalities: 2
Persons involved in fatal accidents: 3
Pedestrians involved in fatal accidents: 1
Fatal accident statistics in 2012:
Fatal accident count: 1
Vehicles involved in fatal accidents: 1
Fatal accidents caused by drunken drivers: 0
Fatalities: 1
Persons involved in fatal accidents: 1
Pedestrians involved in fatal accidents: 1
Home Mortgage Disclosure Act Aggregated Statistics For Year 2009 (Based on 4 partial tracts)
A) FHA, FSA/RHS & VA Home Purchase Loans
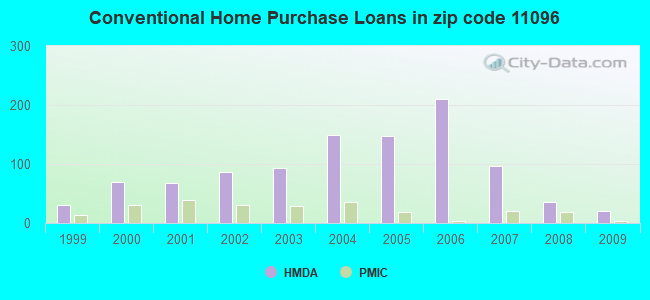
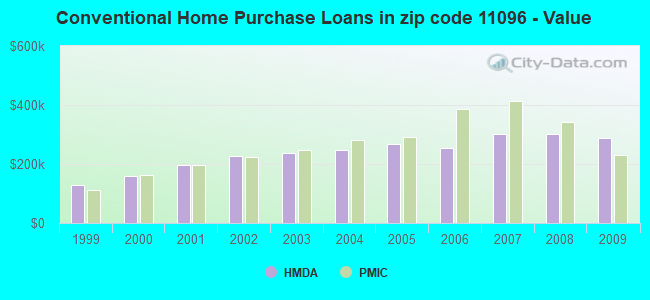
B) Conventional Home Purchase Loans
C) Refinancings
D) Home Improvement Loans
E) Loans on Dwellings For 5+ Families
F) Non-occupant Loans on < 5 Family Dwellings (A B C & D)
Number
Average Value
Number
Average Value
Number
Average Value
Number
Average Value
Number
Average Value
Number
Average Value
LOANS ORIGINATED
17
$311,442
21
$289,708
54
$257,144
9
$114,016
0
$0
6
$299,327
APPLICATIONS APPROVED, NOT ACCEPTED
2
$792,845
0
$0
11
$266,967
5
$56,168
0
$0
0
$0
APPLICATIONS DENIED
7
$366,090
7
$304,849
49
$276,578
9
$57,693
2
$13,663,710
9
$297,732
APPLICATIONS WITHDRAWN
1
$376,660
1
$383,040
24
$314,198
0
$0
0
$0
1
$383,040
FILES CLOSED FOR INCOMPLETENESS
0
$0
3
$363,250
6
$201,330
1
$624,360
0
$0
0
$0
Aggregated Statistics For Year 2008 (Based on 4 partial tracts)
A) FHA, FSA/RHS & VA Home Purchase Loans
B) Conventional Home Purchase Loans
C) Refinancings
D) Home Improvement Loans
F) Non-occupant Loans on < 5 Family Dwellings (A B C & D)
G) Loans On Manufactured Home Dwelling (A B C & D)
Number
Average Value
Number
Average Value
Number
Average Value
Number
Average Value
Number
Average Value
Number
Average Value
LOANS ORIGINATED
5
$305,410
36
$301,204
55
$279,956
19
$39,007
10
$272,788
0
$0
APPLICATIONS APPROVED, NOT ACCEPTED
1
$451,990
9
$331,581
25
$299,485
4
$33,835
2
$411,650
0
$0
APPLICATIONS DENIED
0
$0
31
$277,417
92
$336,771
16
$128,518
22
$293,277
0
$0
APPLICATIONS WITHDRAWN
3
$287,707
0
$0
11
$290,645
6
$263,902
3
$244,667
2
$73,975
FILES CLOSED FOR INCOMPLETENESS
0
$0
6
$359,818
15
$355,497
2
$21,760
3
$272,693
0
$0
Aggregated Statistics For Year 2007 (Based on 4 partial tracts)
A) FHA, FSA/RHS & VA Home Purchase Loans
B) Conventional Home Purchase Loans
C) Refinancings
D) Home Improvement Loans
E) Loans on Dwellings For 5+ Families
F) Non-occupant Loans on < 5 Family Dwellings (A B C & D)
Number
Average Value
Number
Average Value
Number
Average Value
Number
Average Value
Number
Average Value
Number
Average Value
LOANS ORIGINATED
1
$383,040
97
$300,135
141
$277,269
20
$156,334
2
$409,910
22
$277,990
APPLICATIONS APPROVED, NOT ACCEPTED
0
$0
16
$273,476
64
$286,108
15
$69,003
0
$0
8
$370,798
APPLICATIONS DENIED
0
$0
94
$333,427
186
$335,282
48
$132,936
0
$0
44
$277,383
APPLICATIONS WITHDRAWN
0
$0
9
$306,227
65
$361,789
3
$129,383
0
$0
6
$463,170
FILES CLOSED FOR INCOMPLETENESS
0
$0
12
$287,848
31
$299,002
1
$51,070
0
$0
10
$273,874
Aggregated Statistics For Year 2006 (Based on 4 partial tracts)
A) FHA, FSA/RHS & VA Home Purchase Loans
B) Conventional Home Purchase Loans
C) Refinancings
D) Home Improvement Loans
E) Loans on Dwellings For 5+ Families
F) Non-occupant Loans on < 5 Family Dwellings (A B C & D)
G) Loans On Manufactured Home Dwelling (A B C & D)
Number
Average Value
Number
Average Value
Number
Average Value
Number
Average Value
Number
Average Value
Number
Average Value
Number
Average Value
LOANS ORIGINATED
3
$250,170
210
$255,628
241
$285,814
21
$220,212
1
$670,320
42
$352,210
0
$0
APPLICATIONS APPROVED, NOT ACCEPTED
2
$231,500
43
$235,758
57
$262,620
13
$129,110
0
$0
2
$341,160
0
$0
APPLICATIONS DENIED
0
$0
106
$262,262
180
$301,640
33
$119,482
2
$12,401,775
13
$313,512
5
$171,624
APPLICATIONS WITHDRAWN
2
$384,675
34
$317,506
114
$286,438
12
$145,270
0
$0
8
$292,224
0
$0
FILES CLOSED FOR INCOMPLETENESS
0
$0
6
$371,262
36
$305,586
1
$331,970
0
$0
3
$356,243
0
$0
Aggregated Statistics For Year 2005 (Based on 4 partial tracts)
A) FHA, FSA/RHS & VA Home Purchase Loans
B) Conventional Home Purchase Loans
C) Refinancings
D) Home Improvement Loans
E) Loans on Dwellings For 5+ Families
F) Non-occupant Loans on < 5 Family Dwellings (A B C & D)
Number
Average Value
Number
Average Value
Number
Average Value
Number
Average Value
Number
Average Value
Number
Average Value
LOANS ORIGINATED
6
$309,557
148
$267,856
269
$247,201
29
$168,092
2
$435,150
35
$267,136
APPLICATIONS APPROVED, NOT ACCEPTED
0
$0
31
$256,881
57
$265,276
7
$234,596
0
$0
9
$260,874
APPLICATIONS DENIED
2
$343,770
65
$277,076
178
$279,471
39
$186,153
0
$0
15
$389,833
APPLICATIONS WITHDRAWN
1
$406,020
56
$270,786
154
$258,311
25
$287,685
0
$0
25
$226,396
FILES CLOSED FOR INCOMPLETENESS
0
$0
11
$253,753
86
$310,498
1
$31,920
0
$0
2
$217,575
Aggregated Statistics For Year 2004 (Based on 4 partial tracts)
A) FHA, FSA/RHS & VA Home Purchase Loans
B) Conventional Home Purchase Loans
C) Refinancings
D) Home Improvement Loans
E) Loans on Dwellings For 5+ Families
F) Non-occupant Loans on < 5 Family Dwellings (A B C & D)
Number
Average Value
Number
Average Value
Number
Average Value
Number
Average Value
Number
Average Value
Number
Average Value
LOANS ORIGINATED
5
$214,020
149
$247,386
246
$229,454
24
$103,789
1
$383,040
50
$252,625
APPLICATIONS APPROVED, NOT ACCEPTED
0
$0
45
$284,700
77
$240,746
12
$231,039
0
$0
13
$283,646
APPLICATIONS DENIED
0
$0
66
$268,466
176
$249,245
44
$71,441
0
$0
22
$251,365
APPLICATIONS WITHDRAWN
0
$0
36
$304,610
153
$214,614
13
$146,078
0
$0
11
$243,473
FILES CLOSED FOR INCOMPLETENESS
0
$0
9
$256,132
44
$263,570
9
$183,417
0
$0
4
$142,682
Aggregated Statistics For Year 2003 (Based on 4 partial tracts)
A) FHA, FSA/RHS & VA Home Purchase Loans
B) Conventional Home Purchase Loans
C) Refinancings
D) Home Improvement Loans
E) Loans on Dwellings For 5+ Families
F) Non-occupant Loans on < 5 Family Dwellings (A B C & D)
Number
Average Value
Number
Average Value
Number
Average Value
Number
Average Value
Number
Average Value
Number
Average Value
LOANS ORIGINATED
22
$229,936
93
$236,451
339
$185,318
17
$67,336
1
$383,040
43
$182,223
APPLICATIONS APPROVED, NOT ACCEPTED
1
$247,700
19
$261,249
70
$182,605
5
$39,458
0
$0
9
$225,089
APPLICATIONS DENIED
3
$191,987
36
$254,493
144
$175,522
32
$44,084
0
$0
21
$183,209
APPLICATIONS WITHDRAWN
3
$189,147
25
$228,762
133
$182,669
10
$31,219
0
$0
15
$198,475
FILES CLOSED FOR INCOMPLETENESS
1
$215,780
0
$0
13
$187,527
3
$51,057
0
$0
3
$168,257
Aggregated Statistics For Year 2002 (Based on 4 partial tracts)
A) FHA, FSA/RHS & VA Home Purchase Loans
B) Conventional Home Purchase Loans
C) Refinancings
D) Home Improvement Loans
E) Loans on Dwellings For 5+ Families
F) Non-occupant Loans on < 5 Family Dwellings (A B C & D)
Number
Average Value
Number
Average Value
Number
Average Value
Number
Average Value
Number
Average Value
Number
Average Value
LOANS ORIGINATED
15
$180,797
87
$227,249
239
$163,103
18
$37,527
0
$0
28
$210,403
APPLICATIONS APPROVED, NOT ACCEPTED
2
$218,445
29
$242,706
69
$176,337
18
$37,521
2
$191,465
6
$241,365
APPLICATIONS DENIED
0
$0
37
$243,958
160
$177,106
38
$43,445
0
$0
15
$164,116
APPLICATIONS WITHDRAWN
1
$201,730
16
$227,787
83
$175,157
21
$44,783
0
$0
3
$239,647
FILES CLOSED FOR INCOMPLETENESS
0
$0
0
$0
35
$146,863
0
$0
0
$0
0
$0
Aggregated Statistics For Year 2001 (Based on 4 partial tracts)
A) FHA, FSA/RHS & VA Home Purchase Loans
B) Conventional Home Purchase Loans
C) Refinancings
D) Home Improvement Loans
E) Loans on Dwellings For 5+ Families
F) Non-occupant Loans on < 5 Family Dwellings (A B C & D)
Number
Average Value
Number
Average Value
Number
Average Value
Number
Average Value
Number
Average Value
Number
Average Value
LOANS ORIGINATED
16
$175,930
67
$196,068
172
$146,952
20
$84,618
1
$397,080
14
$163,129
APPLICATIONS APPROVED, NOT ACCEPTED
0
$0
7
$184,799
52
$128,913
7
$44,439
0
$0
5
$138,908
APPLICATIONS DENIED
8
$184,822
22
$230,451
125
$131,049
31
$30,980
0
$0
11
$154,189
APPLICATIONS WITHDRAWN
10
$193,756
7
$177,310
67
$129,941
5
$27,850
0
$0
4
$237,075
FILES CLOSED FOR INCOMPLETENESS
0
$0
4
$169,915
20
$160,484
0
$0
0
$0
1
$265,570
Aggregated Statistics For Year 2000 (Based on 4 partial tracts)
A) FHA, FSA/RHS & VA Home Purchase Loans
B) Conventional Home Purchase Loans
C) Refinancings
D) Home Improvement Loans
F) Non-occupant Loans on < 5 Family Dwellings (A B C & D)
Number
Average Value
Number
Average Value
Number
Average Value
Number
Average Value
Number
Average Value
LOANS ORIGINATED
23
$189,522
69
$159,821
72
$122,130
18
$22,469
15
$132,668
APPLICATIONS APPROVED, NOT ACCEPTED
1
$162,150
15
$153,710
13
$108,236
17
$37,119
1
$201,730
APPLICATIONS DENIED
4
$164,388
48
$165,319
114
$105,472
47
$31,829
11
$96,818
APPLICATIONS WITHDRAWN
2
$149,690
14
$152,868
91
$106,594
6
$49,705
3
$62,563
FILES CLOSED FOR INCOMPLETENESS
3
$222,217
4
$127,360
26
$150,093
1
$31,920
3
$218,210
Aggregated Statistics For Year 1999 (Based on 2 partial tracts)
A) FHA, FSA/RHS & VA Home Purchase Loans
B) Conventional Home Purchase Loans
C) Refinancings
D) Home Improvement Loans
E) Loans on Dwellings For 5+ Families
F) Non-occupant Loans on < 5 Family Dwellings (A B C & D)
Detailed PMIC statistics for the following Tracts:4110.00
, 4111.00
2002 - 2018 National Fire Incident Reporting System (NFIRS) incidents
Based on the data from the years 2002 - 2018 the average number of fires per year is 35. The highest number of fires - 114 took place in 2016, and the least - 0 in 2005. The data has a growing trend.
When looking into fire subcategories, the most incidents belonged to: Structure Fires (54.1%), and Other (25.1%).
Fire incident types reported to NFIRS in Zip Code 11096


 Nearest zip codes: 11691, 11516, 11430, 11559, 11509, 11422.


 Based on the data from the years 2002 - 2018 the average number of fires per year is 35. The highest number of fires - 114 took place in 2016, and the least - 0 in 2005. The data has a growing trend.
 When looking into fire subcategories, the most incidents belonged to: Structure Fires (54.1%), and Other (25.1%).