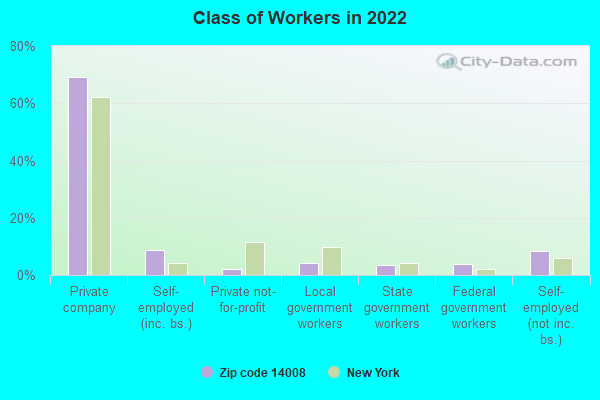
Estimated zip code population in 2022: 1,568 Zip code population in 2010: 1,467 Zip code population in 2000: 1,489
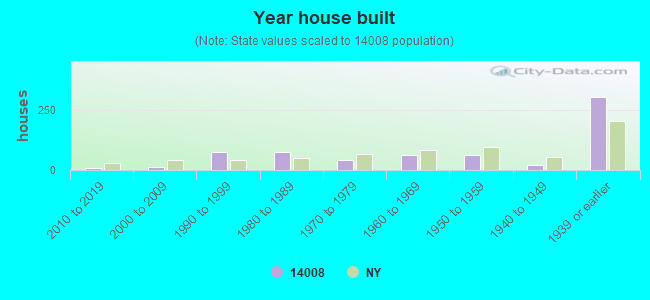
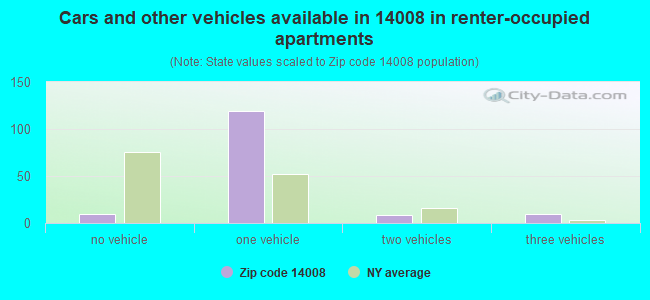
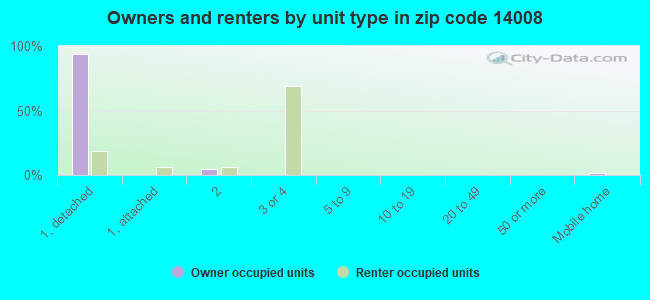
Houses and condos: 674 Renter-occupied apartments: 145
% of renters here:
23%
State:
46%
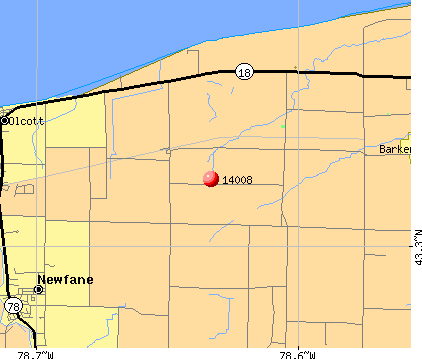
March 2022 cost of living index in zip code 14008: 94.0 (less than average, U.S. average is 100)
Land area: 24.5 sq. mi. Water area: 0.9 sq. mi.
Population density: 64 people per square mile
(very low).
OSM Map
General Map
Google Map
MSN Map
OSM Map
General Map
Google Map
MSN Map
OSM Map
General Map
Google Map
MSN Map
OSM Map
General Map
Google Map
MSN Map
Please wait while loading the map...
Real estate property taxes paid for housing units in 2022:
This zip code:
1.9% ($3,652)
New York:
1.5% ($6,180)
Median real estate property taxes paid for housing units with mortgages in 2022: $3,859 (1.7%) Median real estate property taxes paid for housing units with no mortgage in 2022: $3,285 (1.8%)
Business Search- 14 Million verified businesses
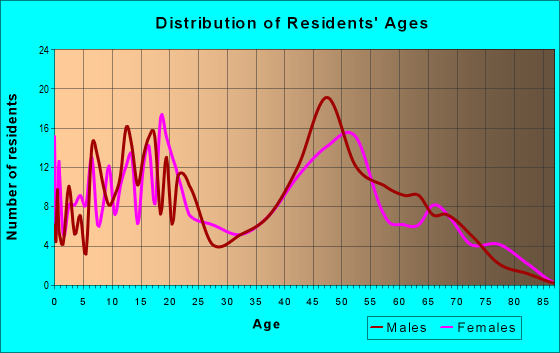
Males: 759
(48.4%)
Females: 808
(51.6%)
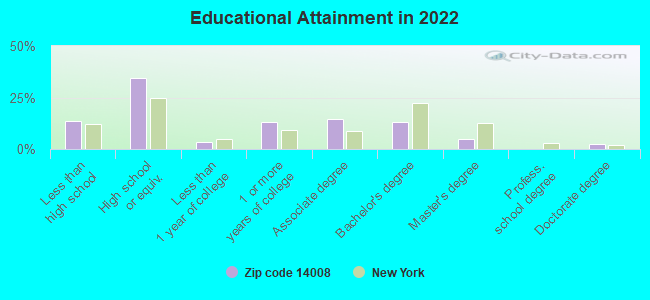
For population 25 years and over in 14008:
High school or higher: 85.3%
Bachelor's degree or higher: 20.4%
Graduate or professional degree: 7.3%
Unemployed: 0.6%
Mean travel time to work (commute): 28.4 minutes
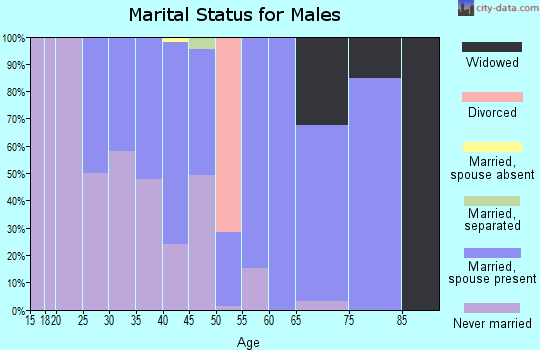
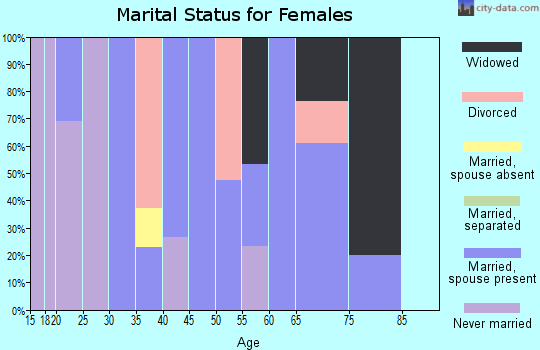
For population 15 years and over in 14008:
Never married: 34.4%
Now married: 56.3%
Separated: 1.1%
Widowed: 4.3%
Divorced: 3.8%
Zip code 14008 compared to state average:
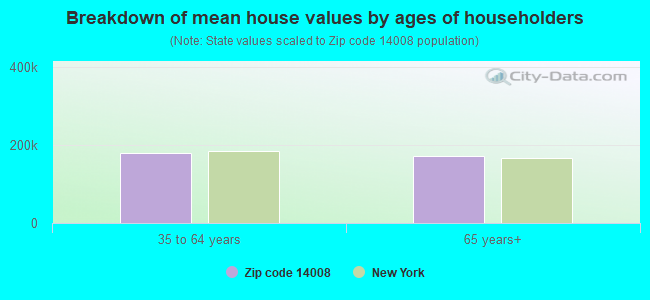
Median house value below state average.
Unemployed percentage significantly below state average.
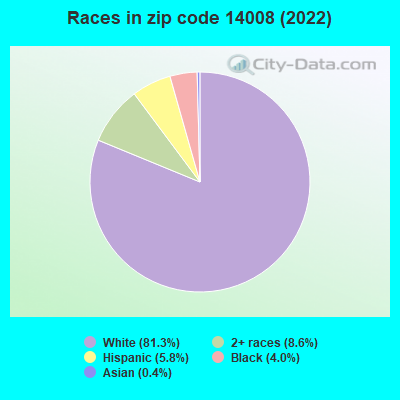
Black race population percentage significantly below state average.
Hispanic race population percentage significantly below state average.
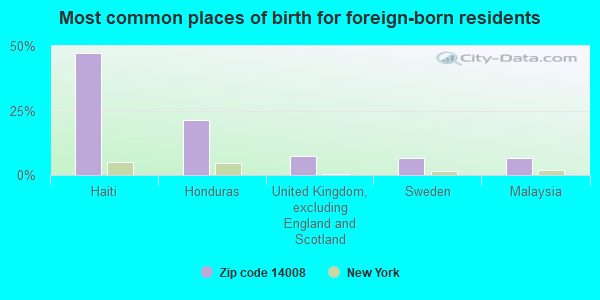
Foreign-born population percentage significantly below state average.
Renting percentage below state average.
Length of stay since moving in significantly above state average.
Number of rooms per house above state average.
Number of college students below state average.
Percentage of population with a bachelor's degree or higher below state average.
Estimated median house/condo value in 2022: $191,704
14008:
$191,704
New York:
$400,400
According to our research of New York and other state lists, there was 1 registered sex offender living in 14008 zip code as of May 22, 2024. The ratio of all residents to sex offenders in zip code 14008 is 1,470 to 1. The ratio of registered sex offenders to all residents in this zip code is lower than the state average.
Median resident age:
This zip code:
43.2 years
New York median age:
40.0 years
Average household size:
This zip code:
2.4 people
New York:
2.5 people
Averages for the 2020 tax year for zip code 14008, filed in 2021:
Average Adjusted Gross Income (AGI) in 2020: $53,514 (Individual Income Tax Returns)
Here:
$53,514
State:
$90,930
Salary/wage: $46,422 (reported on 82.1% of returns)
Here:
$46,422
State:
$72,104
(% of AGI for various income ranges: 1372.9% for AGIs below $25k, 3259.4% for AGIs $25k-50k, 6271.1% for AGIs $50k-75k, 8190.0% for AGIs $75k-100k, 18915.7% for AGIs $100k-200k)
Taxable interest for individuals: $336 (reported on 32.1% of returns)
This zip code:
$336
New York:
$3,075
(% of AGI for various income ranges: 2.9% for AGIs below $25k, 17.5% for AGIs $25k-50k, 15.6% for AGIs $50k-75k, 10.0% for AGIs $75k-100k, 47.1% for AGIs $100k-200k)
Ordinary dividends: $1,386 (reported on 17.9% of returns)
Here:
$1,386
State:
$11,095
(% of AGI for various income ranges: 14.7% for AGIs below $25k, 36.2% for AGIs $25k-50k, 38.9% for AGIs $50k-75k, 108.6% for AGIs $100k-200k)
Net capital gain/loss in AGI: +$7,133 (reported on 11.5% of returns)
Here:
+$7,133
State:
+$44,925
(% of AGI for various income ranges: 88.8% for AGIs $25k-50k, 61.1% for AGIs $50k-75k, 635.7% for AGIs $100k-200k)
Profit/loss from business: +$7,112 (reported on 10.3% of returns)
Here:
+$7,112
State:
+$14,940
(% of AGI for various income ranges: 256.2% for AGIs $25k-50k, 397.5% for AGIs $75k-100k)
Taxable individual retirement arrangement distribution: $8,500 (reported on 9.0% of returns)
14008:
$8,500
New York:
$19,609
(% of AGI for various income ranges: 101.9% for AGIs $25k-50k, 480.0% for AGIs $50k-75k)
Earned income credit: $1,450 (reported on 15.4% of returns)
Here:
$1,450
State:
$2,138
(% of AGI for various income ranges: 64.1% for AGIs below $25k, 40.6% for AGIs $25k-50k)
Percentage of individuals using paid preparers for their 2020 taxes: 96.2%
Here:
96%
State:
95%
(% for various income ranges: 96.6% for AGIs below $25k, 100.0% for AGIs $25k-50k, 100.0% for AGIs $50k-75k, 83.3% for AGIs $75k-100k, 91.7% for AGIs $100k-200k)
Averages for the 2012 tax year for zip code 14008, filed in 2013:
Average Adjusted Gross Income (AGI) in 2012: $45,381 (Individual Income Tax Returns)
Here:
$45,381
State:
$77,088
Salary/wage: $36,668 (reported on 87.5% of returns)
Here:
$36,668
State:
$60,593
(% of AGI for various income ranges: 64.7% for AGIs below $25k, 72.2% for AGIs $25k-50k, 74.4% for AGIs $50k-75k, 76.0% for AGIs $75k-100k, 66.3% for AGIs $100k-200k)
Taxable interest for individuals: $209 (reported on 48.6% of returns)
This zip code:
$209
New York:
$3,125
(% of AGI for various income ranges: 0.7% for AGIs below $25k, 0.3% for AGIs $25k-50k, 0.1% for AGIs $50k-75k, 0.2% for AGIs $75k-100k)
Ordinary dividends: $1,258 (reported on 16.7% of returns)
Here:
$1,258
State:
$10,299
(% of AGI for various income ranges: 0.9% for AGIs below $25k, 0.9% for AGIs $25k-50k, 0.6% for AGIs $50k-75k, 0.2% for AGIs $100k-200k)
Net capital gain/loss in AGI: +$17 (reported on 8.3% of returns)
Here:
+$17
State:
+$42,474
Profit/loss from business: +$8,125 (reported on 11.1% of returns)
Here:
+$8,125
State:
+$16,168
Taxable individual retirement arrangement distribution: $7,414 (reported on 9.7% of returns)
14008:
$7,414
New York:
$17,621
(% of AGI for various income ranges: 2.4% for AGIs below $25k, 2.3% for AGIs $25k-50k, 4.9% for AGIs $75k-100k)
Total itemized deductions: $17,471 (19% of AGI, reported on 23.6% of returns)
Here:
$17,471
State:
$34,985
Here:
18.7% of AGI
State:
21.3% of AGI
(% of AGI for various income ranges: 10.1% for AGIs $25k-50k, 8.3% for AGIs $50k-75k, 10.6% for AGIs $75k-100k, 11.6% for AGIs $100k-200k)
Charity contributions: $2,671 (reported on 19.4% of returns)
Here:
$2,671
State:
$5,572
(% of AGI for various income ranges: 2.1% for AGIs below $25k, 1.3% for AGIs $50k-75k, 1.1% for AGIs $75k-100k, 1.4% for AGIs $100k-200k)
Taxes paid: $8,024 (reported on 23.6% of returns)
14008:
$8,024
State:
$18,656
(% of AGI for various income ranges: 3.2% for AGIs $25k-50k, 3.4% for AGIs $50k-75k, 4.9% for AGIs $75k-100k, 6.5% for AGIs $100k-200k)
Earned income credit: $1,955 (reported on 15.3% of returns)
Here:
$1,955
State:
$2,230
(% of AGI for various income ranges: 3.8% for AGIs below $25k, 1.1% for AGIs $25k-50k)
Percentage of individuals using paid preparers for their 2012 taxes: 63.9%
Here:
64%
State:
66%
(% for various income ranges: 56.7% for AGIs below $25k, 70.6% for AGIs $25k-50k, 72.7% for AGIs $50k-75k, 71.4% for AGIs $75k-100k, 57.1% for AGIs $100k-200k)
Averages for the 2004 tax year for zip code 14008, filed in 2005:
Average Adjusted Gross Income (AGI) in 2004: $39,940 (Individual Income Tax Returns)
Here:
$39,940
State:
$59,519
Salary/wage: $34,406 (reported on 88.6% of returns)
Here:
$34,406
State:
$50,673
(% of AGI for various income ranges: 100.4% for AGIs below $10k, 66.0% for AGIs $10k-25k, 76.7% for AGIs $25k-50k, 84.6% for AGIs $50k-75k, 89.3% for AGIs $75k-100k, 55.5% for AGIs over 100k)
Taxable interest for individuals: $418 (reported on 60.4% of returns)
This zip code:
$418
New York:
$2,377
(% of AGI for various income ranges: 2.6% for AGIs below $10k, 1.6% for AGIs $10k-25k, 0.5% for AGIs $25k-50k, 0.6% for AGIs $50k-75k, 0.1% for AGIs $75k-100k, 0.5% for AGIs over 100k)
Taxable dividends: $771 (reported on 24.3% of returns)
Here:
$771
State:
$5,394
(% of AGI for various income ranges: 1.6% for AGIs below $10k, 1.7% for AGIs $10k-25k, 0.3% for AGIs $25k-50k, 0.2% for AGIs $50k-75k, 0.1% for AGIs $75k-100k, 0.5% for AGIs over 100k)
Net capital gain/loss: +$1,087 (reported on 14.7% of returns)
Here:
+$1,087
State:
+$23,581
(% of AGI for various income ranges: -0.7% for AGIs below $10k, -0.2% for AGIs $10k-25k, -0.2% for AGIs $25k-50k, 0.2% for AGIs $50k-75k, 0.7% for AGIs $75k-100k, 1.4% for AGIs over 100k)
Profit/loss from business: +$1,975 (reported on 11.3% of returns)
Here:
+$1,975
State:
+$13,809
(% of AGI for various income ranges: -0.7% for AGIs below $10k, 1.9% for AGIs $10k-25k, 1.1% for AGIs $25k-50k, 0.1% for AGIs $50k-75k, 0.7% for AGIs $75k-100k)
IRA payment deduction: $2,938 (reported on 2.3% of returns)
14008:
$2,938
New York:
$3,115
Total itemized deductions: $17,151 (23% of AGI, reported on 29.3% of returns)
Here:
$17,151
State:
$25,864
Here:
22.7% of AGI
State:
21.9% of AGI
(% of AGI for various income ranges: 10.3% for AGIs $10k-25k, 10.2% for AGIs $25k-50k, 10.6% for AGIs $50k-75k, 14.1% for AGIs $75k-100k, 18.9% for AGIs over 100k)
Charity contributions deductions: $3,144 (4% of AGI, reported on 26.9% of returns)
Here:
$3,144
State:
$4,439
Here:
4.0% of AGI
State:
3.6% of AGI
(% of AGI for various income ranges: 1.2% for AGIs $10k-25k, 1.4% for AGIs $25k-50k, 1.4% for AGIs $50k-75k, 1.4% for AGIs $75k-100k, 5.1% for AGIs over 100k)
Total tax: $5,045 (reported on 73.1% of returns)
14008:
$5,045
State:
$11,730
(% of AGI for various income ranges: 2.2% for AGIs below $10k, 3.2% for AGIs $10k-25k, 5.4% for AGIs $25k-50k, 7.9% for AGIs $50k-75k, 10.2% for AGIs $75k-100k, 18.0% for AGIs over 100k)
Earned income credit: $1,490 (reported on 14.9% of returns)
Here:
$1,490
State:
$1,757
Percentage of individuals using paid preparers for their 2004 taxes: 66.1%
Here:
66%
State:
67%
(% for various income ranges: 53.2% for AGIs below $10k, 74.0% for AGIs $10k-25k, 70.0% for AGIs $25k-50k, 65.8% for AGIs $50k-75k, 62.9% for AGIs $75k-100k, 75.8% for AGIs over 100k)
Household received Food Stamps/SNAP in the past 12 months: 53 Household did not receive Food Stamps/SNAP in the past 12 months: 575
Women who had a birth in the past 12 months: 7 (7 now married, 0 unmarried) Women who did not have a birth in the past 12 months: 369 (184 now married, 182 unmarried)
Housing units in zip code 14008 with a mortgage: 219 (23 second mortgage, 17 both second mortgage and home equity loan) Houses without a mortgage: 10
Median monthly owner costs for units with a mortgage: $1,664 Median monthly owner costs for units without a mortgage: $591
Residents with income below the poverty level in 2022:
This zip code:
6.1%
Whole state:
14.3%
Residents with income below 50% of the poverty level in 2022:
This zip code:
5.1%
Whole state:
6.8%
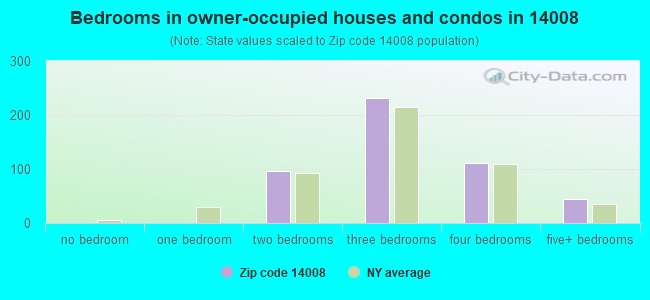
Median number of rooms in houses and condos:
Here:
7.1
State:
6.3
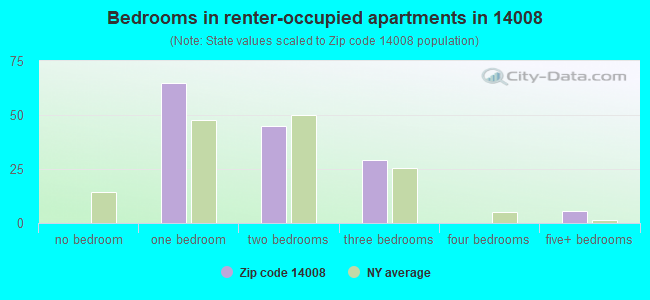
Median number of rooms in apartments:
Here:
4.6
State:
3.8
Notable locations in this zip code not listed on our city pages
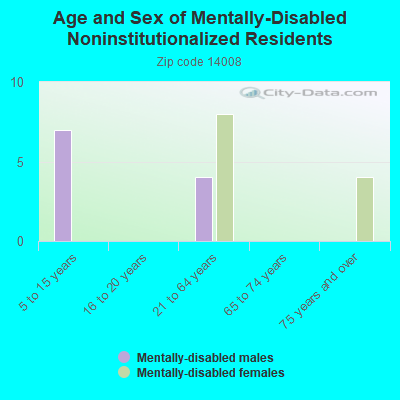
In group quarters: 15 (-1 institutionalized population)
Size of family households: 190 2-persons, 98 3-persons, 40 4-persons, 60 5-persons, 17 6-persons, 7 7-or-more-persons
Size of nonfamily households: 197 1-person, 20 2-persons
241 married couples with children.
51 single-parent households (19 men, 32 women).
90.4% of residents of 14008 zip code speak English at home.
6.7% of residents speak Spanish at home (48% very well, 44% well, 9% not well).
1.3% of residents speak Asian or Pacific Island language at home (70% very well, 30% well).
1.1% of residents speak other language at home (100% very well).
Foreign born population: 94 (6.0%) (63.3% of them are naturalized citizens)
This zip code:
6.0%
Whole state:
22.7%
47%Haiti
22%Honduras
8%United Kingdom, excluding England and Scotland
6%Sweden
6%Malaysia
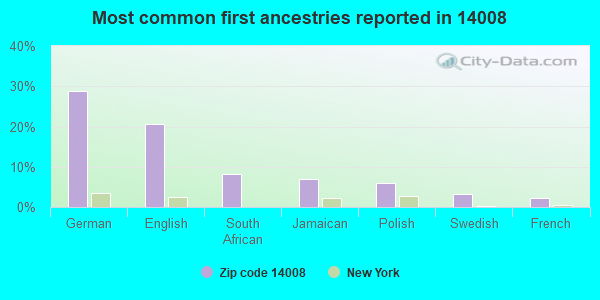
29%German
21%English
8%South African
7%Jamaican
6%Polish
3%Swedish
2%French
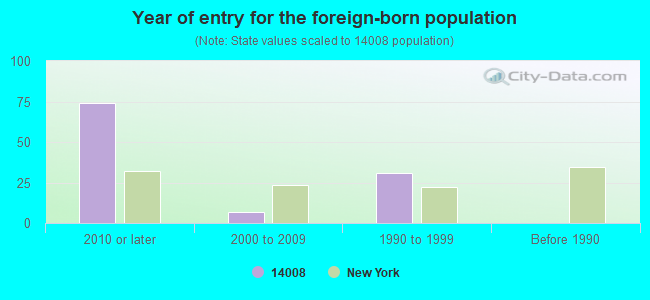
Year of entry for the foreign-born population
742010 or later
72000 to 2009
311990 to 1999
0Before 1990
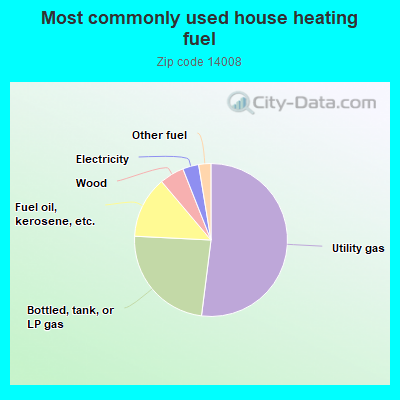
52.2%Utility gas
23.9%Bottled, tank, or LP gas
13.1%Fuel oil, kerosene, etc.
5.2%Wood
3.4%Electricity
2.6%Other fuel
Population in 1990: 940. Population change in the 1990s: +549 (+58.4%).
Place of birth for U.S.-born residents:
This state: 1,267
Northeast: 46
Midwest: 35
South: 39
West: 73
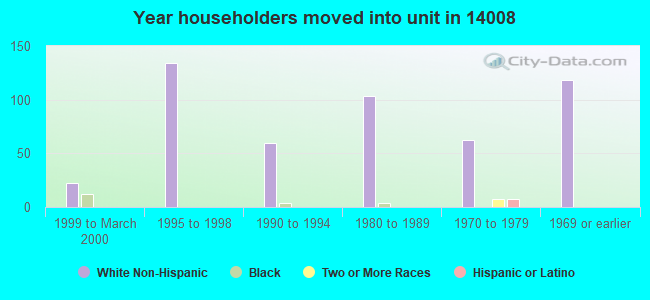
72% of the 14008 zip code residents lived in the same house 5 years ago. Out of people who lived in different houses, 92% lived in this county. Out of people who lived in different counties, 50% lived in New York.
90% of the 14008 zip code residents lived in the same house 1 year ago. Out of people who lived in different houses, 57% moved from this county. Out of people who lived in different houses, 16% moved from different county within same state. Out of people who lived in different houses, 25% moved from abroad.
Private vs. public school enrollment:
Students in private schools in grades 1 to 8 (elementary and middle school): 25
Here:
13.3%
New York:
15.6%
Students in private schools in grades 9 to 12 (high school): 16
Here:
10.4%
New York:
15.0%
Students in private undergraduate colleges: 7
Here:
16.0%
New York:
39.2%
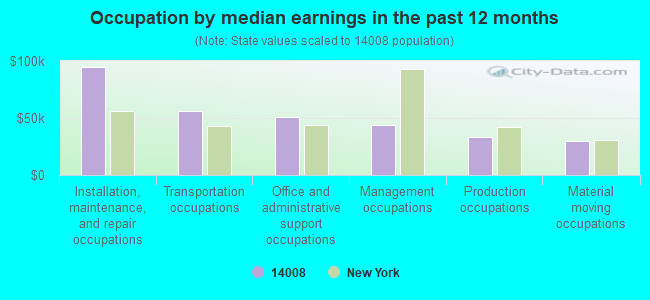
Occupation by median earnings in the past 12 months ($)
94,901Installation, maintenance, and repair occupations
55,807Transportation occupations
50,480Office and administrative support occupations
44,165Management occupations
33,405Production occupations
29,765Material moving occupations
Top industries in this zip code by the number of employees in 2005:
Health Care and Social Assistance: Residential Mental Health and Substance Abuse Facilities (10-19 employees: 1 establishment)
Other Services (except Public Administration): Religious Organizations (1-4: 2)
Construction: Electrical Contractors (1-4: 2)
Construction: Residential Remodelers (1-4: 1)
Construction: Masonry Contractors (1-4: 1)
People in group quarters in 2010:
15 people in residential treatment centers for adults
Fatal accident statistics in 2014:
Fatal accident count: 2
Vehicles involved in fatal accidents: 3
Fatal accidents caused by drunken drivers: 0
Fatalities: 3
Persons involved in fatal accidents: 3
Pedestrians involved in fatal accidents: 0
Home Mortgage Disclosure Act Aggregated Statistics For Year 2009 (Based on 8 partial tracts)
A) FHA, FSA/RHS & VA Home Purchase Loans
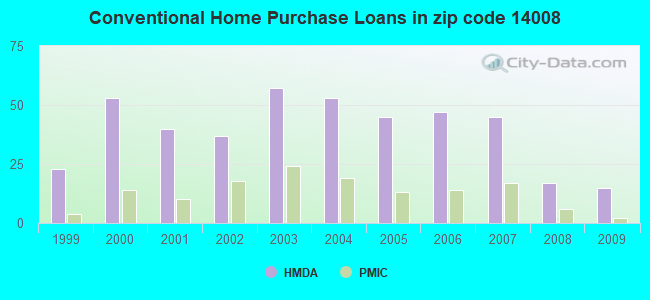
B) Conventional Home Purchase Loans
C) Refinancings
D) Home Improvement Loans
F) Non-occupant Loans on < 5 Family Dwellings (A B C & D)
G) Loans On Manufactured Home Dwelling (A B C & D)
Number
Average Value
Number
Average Value
Number
Average Value
Number
Average Value
Number
Average Value
Number
Average Value
LOANS ORIGINATED
20
$93,730
15
$91,971
45
$106,475
8
$36,832
4
$133,678
1
$35,580
APPLICATIONS APPROVED, NOT ACCEPTED
2
$75,330
3
$53,397
8
$121,006
1
$51,720
1
$132,570
2
$22,540
APPLICATIONS DENIED
3
$83,740
3
$82,233
33
$112,044
7
$17,716
1
$119,900
1
$25,690
APPLICATIONS WITHDRAWN
1
$123,600
0
$0
23
$106,529
1
$13,700
1
$121,870
0
$0
FILES CLOSED FOR INCOMPLETENESS
1
$99,440
1
$93,630
6
$93,320
0
$0
0
$0
0
$0
Aggregated Statistics For Year 2008 (Based on 8 partial tracts)
A) FHA, FSA/RHS & VA Home Purchase Loans
B) Conventional Home Purchase Loans
C) Refinancings
D) Home Improvement Loans
F) Non-occupant Loans on < 5 Family Dwellings (A B C & D)
G) Loans On Manufactured Home Dwelling (A B C & D)
Number
Average Value
Number
Average Value
Number
Average Value
Number
Average Value
Number
Average Value
Number
Average Value
LOANS ORIGINATED
19
$93,460
17
$104,566
33
$95,485
8
$34,984
4
$100,050
1
$29,650
APPLICATIONS APPROVED, NOT ACCEPTED
0
$0
5
$122,326
6
$77,905
2
$91,250
1
$110,290
1
$49,080
APPLICATIONS DENIED
2
$111,635
6
$78,295
40
$95,414
15
$37,686
2
$93,220
3
$54,567
APPLICATIONS WITHDRAWN
1
$164,130
1
$137,150
22
$110,445
3
$48,397
1
$100,260
0
$0
FILES CLOSED FOR INCOMPLETENESS
0
$0
1
$128,200
2
$75,390
0
$0
0
$0
0
$0
Aggregated Statistics For Year 2007 (Based on 8 partial tracts)
A) FHA, FSA/RHS & VA Home Purchase Loans
B) Conventional Home Purchase Loans
C) Refinancings
D) Home Improvement Loans
F) Non-occupant Loans on < 5 Family Dwellings (A B C & D)
G) Loans On Manufactured Home Dwelling (A B C & D)
Number
Average Value
Number
Average Value
Number
Average Value
Number
Average Value
Number
Average Value
Number
Average Value
LOANS ORIGINATED
15
$93,508
45
$87,850
49
$96,485
22
$33,427
6
$82,165
3
$31,790
APPLICATIONS APPROVED, NOT ACCEPTED
1
$93,470
9
$57,614
11
$80,878
5
$38,984
3
$68,657
1
$15,810
APPLICATIONS DENIED
4
$73,962
12
$77,578
54
$96,373
27
$37,639
2
$82,435
3
$33,060
APPLICATIONS WITHDRAWN
1
$36,830
5
$69,370
32
$103,244
4
$60,620
2
$53,645
0
$0
FILES CLOSED FOR INCOMPLETENESS
1
$40,810
3
$72,343
8
$96,428
1
$11,110
0
$0
0
$0
Aggregated Statistics For Year 2006 (Based on 8 partial tracts)
A) FHA, FSA/RHS & VA Home Purchase Loans
B) Conventional Home Purchase Loans
C) Refinancings
D) Home Improvement Loans
F) Non-occupant Loans on < 5 Family Dwellings (A B C & D)
G) Loans On Manufactured Home Dwelling (A B C & D)
Number
Average Value
Number
Average Value
Number
Average Value
Number
Average Value
Number
Average Value
Number
Average Value
LOANS ORIGINATED
16
$97,180
47
$90,319
60
$77,510
24
$31,572
10
$117,909
1
$24,700
APPLICATIONS APPROVED, NOT ACCEPTED
0
$0
5
$82,444
14
$94,050
3
$65,720
1
$58,180
2
$41,175
APPLICATIONS DENIED
2
$55,950
16
$75,585
84
$86,792
21
$44,413
6
$88,187
4
$47,792
APPLICATIONS WITHDRAWN
1
$64,710
3
$121,110
49
$98,635
6
$94,203
1
$90,260
1
$117,500
FILES CLOSED FOR INCOMPLETENESS
0
$0
2
$68,565
13
$127,800
0
$0
0
$0
0
$0
Aggregated Statistics For Year 2005 (Based on 8 partial tracts)
A) FHA, FSA/RHS & VA Home Purchase Loans
B) Conventional Home Purchase Loans
C) Refinancings
D) Home Improvement Loans
F) Non-occupant Loans on < 5 Family Dwellings (A B C & D)
G) Loans On Manufactured Home Dwelling (A B C & D)
Number
Average Value
Number
Average Value
Number
Average Value
Number
Average Value
Number
Average Value
Number
Average Value
LOANS ORIGINATED
13
$82,519
45
$91,026
71
$89,526
24
$30,436
6
$170,453
2
$35,185
APPLICATIONS APPROVED, NOT ACCEPTED
0
$0
8
$72,358
17
$86,518
4
$29,792
1
$47,100
4
$30,308
APPLICATIONS DENIED
2
$66,175
13
$74,192
104
$85,384
23
$41,473
7
$56,260
5
$49,290
APPLICATIONS WITHDRAWN
0
$0
5
$106,380
45
$107,623
8
$62,059
2
$72,210
0
$0
FILES CLOSED FOR INCOMPLETENESS
1
$59,290
6
$94,237
17
$116,132
1
$90,580
1
$100,340
0
$0
Aggregated Statistics For Year 2004 (Based on 8 partial tracts)
A) FHA, FSA/RHS & VA Home Purchase Loans
B) Conventional Home Purchase Loans
C) Refinancings
D) Home Improvement Loans
F) Non-occupant Loans on < 5 Family Dwellings (A B C & D)
G) Loans On Manufactured Home Dwelling (A B C & D)
Number
Average Value
Number
Average Value
Number
Average Value
Number
Average Value
Number
Average Value
Number
Average Value
LOANS ORIGINATED
9
$101,606
53
$84,701
92
$82,673
18
$26,944
4
$58,808
0
$0
APPLICATIONS APPROVED, NOT ACCEPTED
0
$0
7
$91,096
21
$85,733
4
$29,598
1
$46,770
1
$57,650
APPLICATIONS DENIED
1
$77,750
12
$69,209
70
$85,460
24
$32,715
2
$50,540
3
$44,633
APPLICATIONS WITHDRAWN
0
$0
2
$69,080
43
$92,570
9
$91,984
2
$77,905
0
$0
FILES CLOSED FOR INCOMPLETENESS
1
$48,750
5
$77,616
20
$92,046
4
$37,655
0
$0
0
$0
Aggregated Statistics For Year 2003 (Based on 8 partial tracts)
A) FHA, FSA/RHS & VA Home Purchase Loans
B) Conventional Home Purchase Loans
C) Refinancings
D) Home Improvement Loans
F) Non-occupant Loans on < 5 Family Dwellings (A B C & D)
Number
Average Value
Number
Average Value
Number
Average Value
Number
Average Value
Number
Average Value
LOANS ORIGINATED
17
$80,863
57
$92,022
151
$83,645
11
$22,795
7
$82,197
APPLICATIONS APPROVED, NOT ACCEPTED
1
$45,100
7
$111,341
23
$76,702
4
$34,095
1
$96,510
APPLICATIONS DENIED
1
$110,020
11
$79,835
75
$82,267
19
$17,047
1
$253,940
APPLICATIONS WITHDRAWN
1
$94,280
6
$123,900
44
$86,181
3
$36,330
1
$59,300
FILES CLOSED FOR INCOMPLETENESS
0
$0
2
$119,010
5
$80,718
1
$39,890
0
$0
Aggregated Statistics For Year 2002 (Based on 8 partial tracts)
A) FHA, FSA/RHS & VA Home Purchase Loans
B) Conventional Home Purchase Loans
C) Refinancings
D) Home Improvement Loans
F) Non-occupant Loans on < 5 Family Dwellings (A B C & D)
Number
Average Value
Number
Average Value
Number
Average Value
Number
Average Value
Number
Average Value
LOANS ORIGINATED
16
$84,092
37
$87,902
123
$73,485
11
$32,283
8
$67,498
APPLICATIONS APPROVED, NOT ACCEPTED
1
$35,280
9
$66,376
19
$82,002
1
$38,960
1
$64,350
APPLICATIONS DENIED
1
$47,390
15
$54,773
68
$75,861
11
$25,943
2
$65,360
APPLICATIONS WITHDRAWN
1
$55,520
4
$73,612
52
$81,799
4
$26,900
1
$63,890
FILES CLOSED FOR INCOMPLETENESS
0
$0
2
$67,045
11
$80,932
0
$0
0
$0
Aggregated Statistics For Year 2001 (Based on 8 partial tracts)
A) FHA, FSA/RHS & VA Home Purchase Loans
B) Conventional Home Purchase Loans
C) Refinancings
D) Home Improvement Loans
F) Non-occupant Loans on < 5 Family Dwellings (A B C & D)
Number
Average Value
Number
Average Value
Number
Average Value
Number
Average Value
Number
Average Value
LOANS ORIGINATED
9
$75,311
40
$72,028
102
$69,868
17
$17,566
4
$62,302
APPLICATIONS APPROVED, NOT ACCEPTED
0
$0
14
$55,179
18
$70,342
1
$19,580
0
$0
APPLICATIONS DENIED
0
$0
30
$49,270
80
$70,809
16
$17,561
2
$53,995
APPLICATIONS WITHDRAWN
1
$80,640
1
$59,380
54
$80,978
3
$40,983
1
$43,570
FILES CLOSED FOR INCOMPLETENESS
0
$0
1
$38,210
6
$67,987
1
$19,760
0
$0
Aggregated Statistics For Year 2000 (Based on 8 partial tracts)
A) FHA, FSA/RHS & VA Home Purchase Loans
B) Conventional Home Purchase Loans
C) Refinancings
D) Home Improvement Loans
F) Non-occupant Loans on < 5 Family Dwellings (A B C & D)
Number
Average Value
Number
Average Value
Number
Average Value
Number
Average Value
Number
Average Value
LOANS ORIGINATED
15
$77,023
53
$70,436
46
$57,169
20
$16,974
1
$44,140
APPLICATIONS APPROVED, NOT ACCEPTED
0
$0
12
$46,047
15
$57,991
4
$14,050
1
$59,150
APPLICATIONS DENIED
1
$38,620
49
$45,107
61
$57,333
17
$22,826
2
$53,825
APPLICATIONS WITHDRAWN
0
$0
5
$65,194
31
$67,280
2
$31,965
0
$0
FILES CLOSED FOR INCOMPLETENESS
0
$0
1
$35,230
6
$72,702
0
$0
0
$0
Aggregated Statistics For Year 1999 (Based on 4 partial tracts)
A) FHA, FSA/RHS & VA Home Purchase Loans
B) Conventional Home Purchase Loans
C) Refinancings
D) Home Improvement Loans
F) Non-occupant Loans on < 5 Family Dwellings (A B C & D)
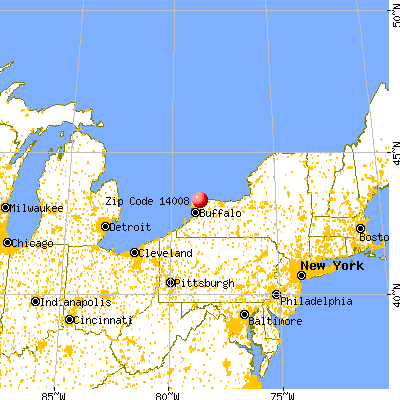


 Nearest zip codes: 14012, 14028, 14126, 14067, 14108, 14094.