Estimated zip code population in 2022: 3,964 Zip code population in 2010: 5,040 Zip code population in 2000: 5,128
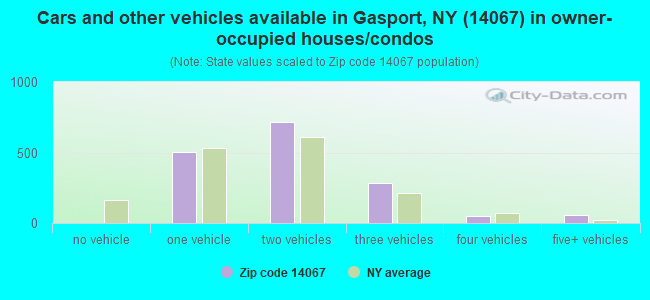
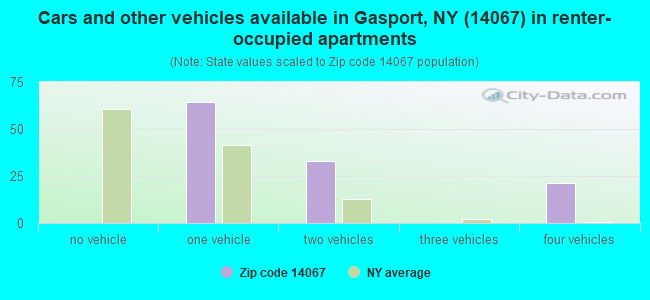
Houses and condos: 1,960 Renter-occupied apartments: 116
% of renters here:
7%
State:
46%
March 2022 cost of living index in zip code 14067: 94.1 (less than average, U.S. average is 100)
Land area: 49.5 sq. mi. Water area: 0.1 sq. mi.
Population density: 80 people per square mile
(very low).
OSM Map
General Map
Google Map
MSN Map
OSM Map
General Map
Google Map
MSN Map
OSM Map
General Map
Google Map
MSN Map
OSM Map
General Map
Google Map
MSN Map
Please wait while loading the map...
Real estate property taxes paid for housing units in 2022:
This zip code:
2.5% ($4,220)
New York:
1.5% ($6,180)
Median real estate property taxes paid for housing units with mortgages in 2022: $4,602 (2.3%) Median real estate property taxes paid for housing units with no mortgage in 2022: $3,753 (2.4%)
Business Search- 14 Million verified businesses
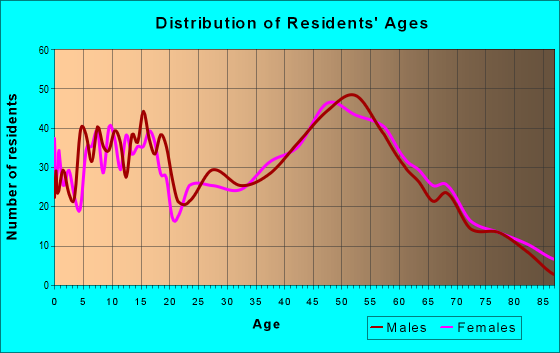
Males: 1,816
(45.8%)
Females: 2,147
(54.2%)
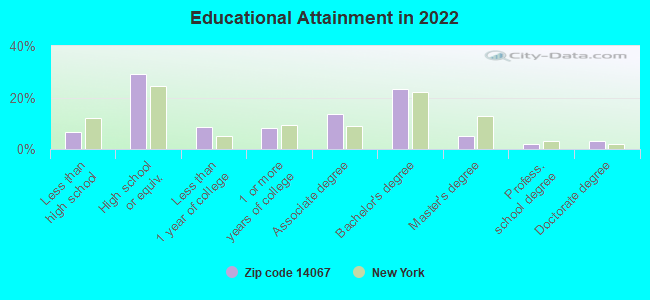
For population 25 years and over in 14067:
High school or higher: 93.4%
Bachelor's degree or higher: 33.7%
Graduate or professional degree: 10.4%
Unemployed: 3.0%
Mean travel time to work (commute): 34.1 minutes
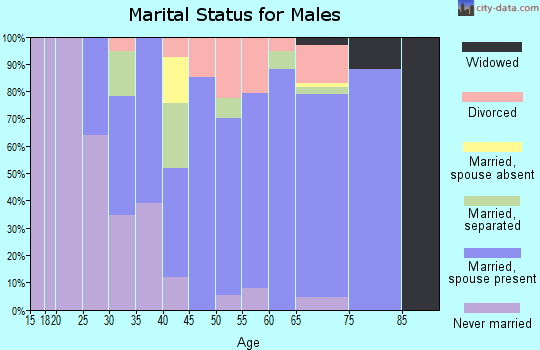
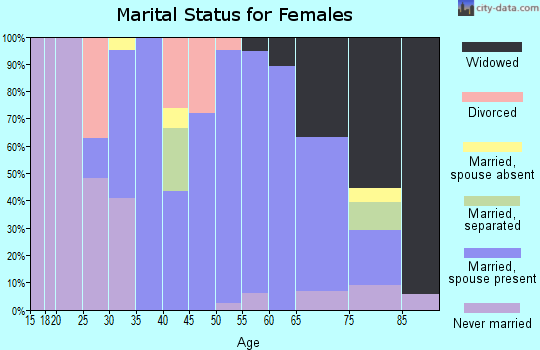
For population 15 years and over in 14067:
Never married: 29.9%
Now married: 51.1%
Separated: 0.7%
Widowed: 6.3%
Divorced: 12.0%
Zip code 14067 compared to state average:
Median house value significantly below state average.
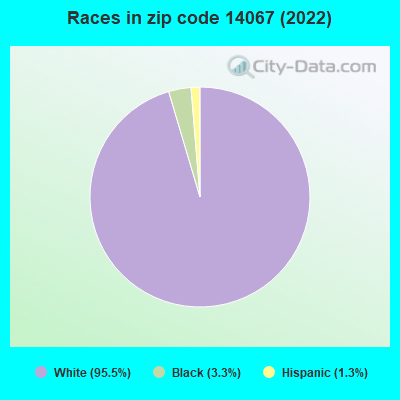
Black race population percentage significantly below state average.
Hispanic race population percentage significantly below state average.
Foreign-born population percentage significantly below state average.
Renting percentage significantly below state average.
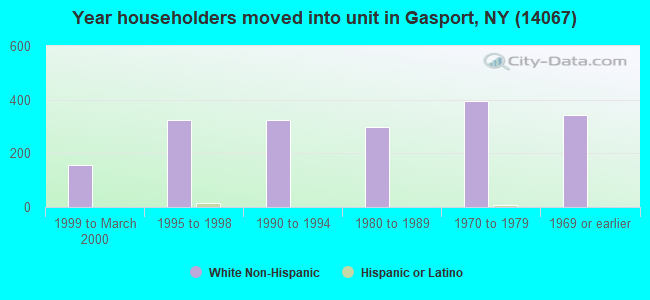
Length of stay since moving in significantly above state average.
Averages for the 2020 tax year for zip code 14067, filed in 2021:
Average Adjusted Gross Income (AGI) in 2020: $58,317 (Individual Income Tax Returns)
Here:
$58,317
State:
$90,930
Salary/wage: $51,991 (reported on 81.0% of returns)
Here:
$51,991
State:
$72,104
(% of AGI for various income ranges: 1101.7% for AGIs below $25k, 3265.4% for AGIs $25k-50k, 6424.5% for AGIs $50k-75k, 8362.3% for AGIs $75k-100k, 13842.4% for AGIs $100k-200k)
Taxable interest for individuals: $457 (reported on 36.9% of returns)
This zip code:
$457
New York:
$3,075
(% of AGI for various income ranges: 13.3% for AGIs below $25k, 18.7% for AGIs $25k-50k, 39.7% for AGIs $50k-75k, 11.8% for AGIs $75k-100k, 38.0% for AGIs $100k-200k)
Ordinary dividends: $1,824 (reported on 19.8% of returns)
Here:
$1,824
State:
$11,095
(% of AGI for various income ranges: 23.7% for AGIs below $25k, 30.0% for AGIs $25k-50k, 44.8% for AGIs $50k-75k, 25.0% for AGIs $75k-100k, 151.6% for AGIs $100k-200k)
Net capital gain/loss in AGI: +$4,745 (reported on 15.1% of returns)
Here:
+$4,745
State:
+$44,925
(% of AGI for various income ranges: 3.7% for AGIs below $25k, 40.8% for AGIs $25k-50k, 104.1% for AGIs $50k-75k, 111.4% for AGIs $75k-100k, 331.2% for AGIs $100k-200k)
Profit/loss from business: +$6,528 (reported on 11.5% of returns)
Here:
+$6,528
State:
+$14,940
(% of AGI for various income ranges: 63.8% for AGIs below $25k, 64.2% for AGIs $25k-50k, 126.6% for AGIs $50k-75k, 82.3% for AGIs $75k-100k, 271.6% for AGIs $100k-200k)
Taxable individual retirement arrangement distribution: $13,443 (reported on 11.1% of returns)
14067:
$13,443
New York:
$19,609
(% of AGI for various income ranges: 48.7% for AGIs below $25k, 109.2% for AGIs $25k-50k, 228.6% for AGIs $50k-75k, 342.3% for AGIs $75k-100k, 610.8% for AGIs $100k-200k)
Total itemized deductions: $26,250 (reported on 4.0% of returns)
Here:
$26,250
State:
$39,326
(% of AGI for various income ranges: 114.8% for AGIs $25k-50k, 192.3% for AGIs $75k-100k, 642.0% for AGIs $100k-200k)
Charity contributions: $8,214 (reported on 2.8% of returns)
Here:
$8,214
State:
$15,420
(% of AGI for various income ranges: 42.8% for AGIs $50k-75k, 180.4% for AGIs $100k-200k)
Taxes paid: $8,180 (reported on 4.0% of returns)
14067:
$8,180
State:
$9,183
(% of AGI for various income ranges: 31.9% for AGIs $25k-50k, 86.4% for AGIs $75k-100k, 184.8% for AGIs $100k-200k)
Earned income credit: $1,958 (reported on 10.3% of returns)
Here:
$1,958
State:
$2,138
(% of AGI for various income ranges: 53.1% for AGIs below $25k, 44.8% for AGIs $25k-50k)
Percentage of individuals using paid preparers for their 2020 taxes: 97.2%
Here:
97%
State:
95%
(% for various income ranges: 97.3% for AGIs below $25k, 97.0% for AGIs $25k-50k, 97.6% for AGIs $50k-75k, 96.6% for AGIs $75k-100k, 97.3% for AGIs $100k-200k, 100.0% for AGIs over 200k)
Averages for the 2012 tax year for zip code 14067, filed in 2013:
Average Adjusted Gross Income (AGI) in 2012: $46,538 (Individual Income Tax Returns)
Here:
$46,538
State:
$77,088
Salary/wage: $39,474 (reported on 87.2% of returns)
Here:
$39,474
State:
$60,593
(% of AGI for various income ranges: 66.2% for AGIs below $25k, 70.9% for AGIs $25k-50k, 75.3% for AGIs $50k-75k, 76.9% for AGIs $75k-100k, 75.6% for AGIs $100k-200k)
Taxable interest for individuals: $379 (reported on 55.0% of returns)
This zip code:
$379
New York:
$3,125
(% of AGI for various income ranges: 0.8% for AGIs below $25k, 0.4% for AGIs $25k-50k, 0.6% for AGIs $50k-75k, 0.3% for AGIs $75k-100k, 0.3% for AGIs $100k-200k)
Ordinary dividends: $1,414 (reported on 23.6% of returns)
Here:
$1,414
State:
$10,299
(% of AGI for various income ranges: 1.4% for AGIs below $25k, 0.5% for AGIs $25k-50k, 1.0% for AGIs $50k-75k, 0.4% for AGIs $75k-100k, 0.6% for AGIs $100k-200k)
Net capital gain/loss in AGI: +$3,856 (reported on 13.2% of returns)
Here:
+$3,856
State:
+$42,474
(% of AGI for various income ranges: 0.3% for AGIs $25k-50k, 1.6% for AGIs $75k-100k, 2.6% for AGIs $100k-200k)
Profit/loss from business: +$6,497 (reported on 12.0% of returns)
Here:
+$6,497
State:
+$16,168
(% of AGI for various income ranges: 5.2% for AGIs below $25k, 2.2% for AGIs $25k-50k, 1.1% for AGIs $50k-75k, 1.6% for AGIs $75k-100k, 0.6% for AGIs $100k-200k)
Taxable individual retirement arrangement distribution: $9,870 (reported on 9.5% of returns)
14067:
$9,870
New York:
$17,621
(% of AGI for various income ranges: 2.6% for AGIs below $25k, 3.1% for AGIs $25k-50k, 2.7% for AGIs $50k-75k, 1.3% for AGIs $75k-100k, 1.2% for AGIs $100k-200k)
Total itemized deductions: $17,204 (21% of AGI, reported on 28.5% of returns)
Here:
$17,204
State:
$34,985
Here:
21.3% of AGI
State:
21.3% of AGI
(% of AGI for various income ranges: 5.8% for AGIs below $25k, 8.1% for AGIs $25k-50k, 8.8% for AGIs $50k-75k, 11.5% for AGIs $75k-100k, 14.5% for AGIs $100k-200k)
Charity contributions: $2,377 (reported on 23.1% of returns)
Here:
$2,377
State:
$5,572
(% of AGI for various income ranges: 0.6% for AGIs below $25k, 0.9% for AGIs $25k-50k, 1.0% for AGIs $50k-75k, 1.8% for AGIs $75k-100k, 1.3% for AGIs $100k-200k)
Taxes paid: $8,828 (reported on 28.5% of returns)
14067:
$8,828
State:
$18,656
(% of AGI for various income ranges: 2.3% for AGIs below $25k, 3.2% for AGIs $25k-50k, 4.2% for AGIs $50k-75k, 5.9% for AGIs $75k-100k, 8.6% for AGIs $100k-200k)
Earned income credit: $1,909 (reported on 14.0% of returns)
Here:
$1,909
State:
$2,230
(% of AGI for various income ranges: 4.0% for AGIs below $25k, 0.9% for AGIs $25k-50k)
Percentage of individuals using paid preparers for their 2012 taxes: 66.9%
Here:
67%
State:
66%
(% for various income ranges: 62.0% for AGIs below $25k, 68.3% for AGIs $25k-50k, 68.4% for AGIs $50k-75k, 70.0% for AGIs $75k-100k, 77.3% for AGIs $100k-200k)
Averages for the 2004 tax year for zip code 14067, filed in 2005:
Average Adjusted Gross Income (AGI) in 2004: $40,671 (Individual Income Tax Returns)
Here:
$40,671
State:
$59,519
Salary/wage: $36,759 (reported on 89.2% of returns)
Here:
$36,759
State:
$50,673
(% of AGI for various income ranges: 131.8% for AGIs below $10k, 68.5% for AGIs $10k-25k, 76.2% for AGIs $25k-50k, 82.8% for AGIs $50k-75k, 87.4% for AGIs $75k-100k, 77.6% for AGIs over 100k)
Taxable interest for individuals: $602 (reported on 65.1% of returns)
This zip code:
$602
New York:
$2,377
(% of AGI for various income ranges: 4.7% for AGIs below $10k, 1.6% for AGIs $10k-25k, 0.9% for AGIs $25k-50k, 1.1% for AGIs $50k-75k, 0.4% for AGIs $75k-100k, 0.8% for AGIs over 100k)
Taxable dividends: $953 (reported on 28.8% of returns)
Here:
$953
State:
$5,394
(% of AGI for various income ranges: 1.9% for AGIs below $10k, 1.1% for AGIs $10k-25k, 0.9% for AGIs $25k-50k, 0.6% for AGIs $50k-75k, 0.4% for AGIs $75k-100k, 0.5% for AGIs over 100k)
Net capital gain/loss: +$1,131 (reported on 18.1% of returns)
Here:
+$1,131
State:
+$23,581
(% of AGI for various income ranges: -1.4% for AGIs below $10k, -0.3% for AGIs $10k-25k, 0.4% for AGIs $25k-50k, 0.4% for AGIs $50k-75k, 0.1% for AGIs $75k-100k, 1.7% for AGIs over 100k)
Profit/loss from business: +$3,774 (reported on 12.2% of returns)
Here:
+$3,774
State:
+$13,809
(% of AGI for various income ranges: 4.1% for AGIs below $10k, 2.8% for AGIs $10k-25k, 0.0% for AGIs $25k-50k, 2.1% for AGIs $50k-75k, -0.5% for AGIs $75k-100k, 1.5% for AGIs over 100k)
IRA payment deduction: $2,524 (reported on 2.7% of returns)
14067:
$2,524
New York:
$3,115
Total itemized deductions: $14,857 (21% of AGI, reported on 34.1% of returns)
Here:
$14,857
State:
$25,864
Here:
21.0% of AGI
State:
21.9% of AGI
(% of AGI for various income ranges: 6.6% for AGIs below $10k, 7.1% for AGIs $10k-25k, 10.1% for AGIs $25k-50k, 13.7% for AGIs $50k-75k, 14.6% for AGIs $75k-100k, 14.3% for AGIs over 100k)
Charity contributions deductions: $2,050 (3% of AGI, reported on 31.1% of returns)
Here:
$2,050
State:
$4,439
Here:
2.8% of AGI
State:
3.6% of AGI
(% of AGI for various income ranges: 0.6% for AGIs $10k-25k, 1.1% for AGIs $25k-50k, 1.6% for AGIs $50k-75k, 1.6% for AGIs $75k-100k, 2.6% for AGIs over 100k)
Total tax: $4,835 (reported on 77.6% of returns)
14067:
$4,835
State:
$11,730
(% of AGI for various income ranges: 3.2% for AGIs below $10k, 3.9% for AGIs $10k-25k, 6.3% for AGIs $25k-50k, 8.3% for AGIs $50k-75k, 10.4% for AGIs $75k-100k, 15.9% for AGIs over 100k)
Earned income credit: $1,564 (reported on 12.1% of returns)
Here:
$1,564
State:
$1,757
Percentage of individuals using paid preparers for their 2004 taxes: 68.7%
Here:
69%
State:
67%
(% for various income ranges: 57.6% for AGIs below $10k, 68.4% for AGIs $10k-25k, 69.9% for AGIs $25k-50k, 74.5% for AGIs $50k-75k, 71.6% for AGIs $75k-100k, 77.9% for AGIs over 100k)
Likely homosexual households (counted as self-reported same-sex unmarried-partner households)
Lesbian couples: 0.5% of all households
Gay men: 0.0% of all households
Household received Food Stamps/SNAP in the past 12 months: 103 Household did not receive Food Stamps/SNAP in the past 12 months: 1,623
Women who had a birth in the past 12 months: 79 (78 now married, 0 unmarried) Women who did not have a birth in the past 12 months: 893 (242 now married, 654 unmarried)
Housing units in zip code 14067 with a mortgage: 807 (104 second mortgage, 88 both second mortgage and home equity loan) Houses without a mortgage: 20
Median monthly owner costs for units with a mortgage: $1,552 Median monthly owner costs for units without a mortgage: $606
Residents with income below the poverty level in 2022:
This zip code:
7.1%
Whole state:
14.3%
Residents with income below 50% of the poverty level in 2022:
This zip code:
4.0%
Whole state:
6.8%
Median number of rooms in houses and condos:
Here:
6.8
State:
6.3
Median number of rooms in apartments:
Here:
5.0
State:
3.8
Notable locations in this zip code not listed on our city pages
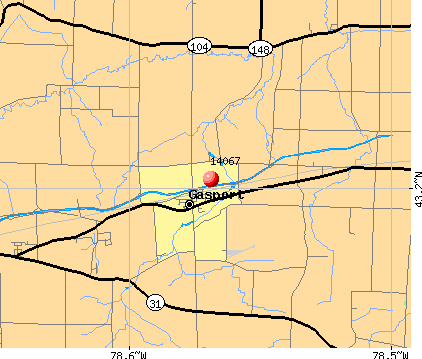
Notable locations in zip code 14067: Niagara Orleans Country Club (A), Harris Farms (B), Newroyal Farms (C), Chestnut Ridge Equestrian Center (D), Veri Farms (E), Gasport Sewer District 1 Wastewater Treatment Plant (F), Camp Castle (G), Becker Farms (H), Schwab Farm (I), Hartland Volunteer Fire Company (J), Gasport Fire Company (K), Terry's Corners Volunteer Fire Company (L), Hartland Town Hall (M), Absolut Care Center for Nursing and Rehabilitation at Gasport (N). Display/hide their locations on the map
Churches in zip code 14067 include: Hartland Church (A), Orangeport Church (B), Hartland United Methodist Church (C), Zion Lutheran Church (D), Quaker Road Church (E). Display/hide their locations on the map
Cemeteries: Royalton Mount Ridge Cemetery (1), Dysinger Cemetery (2), Morehouse Cemetery (3), Johnsons Creek Baptist Cemetery (4), Mabee Cemetery (5), Orangeport Cemetery (6), Hartland Central Cemetery (7). Display/hide their locations on the map
In group quarters: 71 (-1 institutionalized population)
Size of family households: 601 2-persons, 198 3-persons, 199 4-persons, 63 5-persons, 36 6-persons, 10 7-or-more-persons
Size of nonfamily households: 543 1-person, 99 2-persons
533 married couples with children.
183 single-parent households (37 men, 146 women).
98.5% of residents of 14067 zip code speak English at home.
0.5% of residents speak Spanish at home (65% very well, 20% not well, 15% not at all).
0.2% of residents speak other Indo-European language at home (100% very well).
0.2% of residents speak Asian or Pacific Island language at home (100% very well).
0.1% of residents speak other language at home (100% very well).
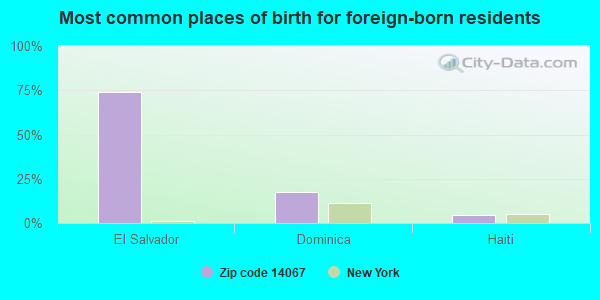
Foreign born population: 24 (0.6%) (84.0% of them are naturalized citizens)
This zip code:
0.6%
Whole state:
22.7%
74%El Salvador
17%Dominica
4%Haiti
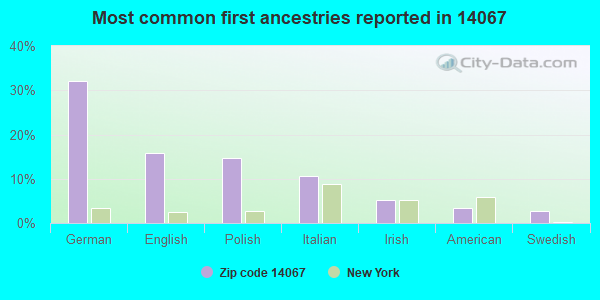
32%German
16%English
15%Polish
11%Italian
5%Irish
3%American
3%Swedish
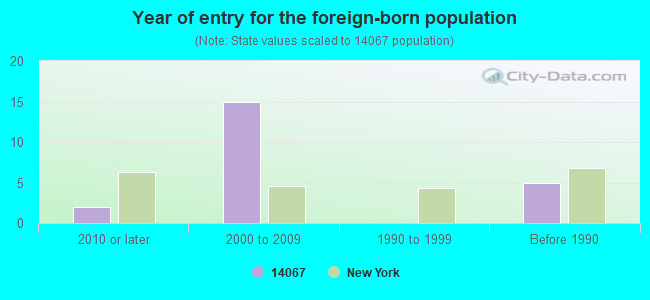
Year of entry for the foreign-born population
22010 or later
152000 to 2009
01990 to 1999
5Before 1990
Facilities with environmental interests located in this zip code:
HEITZENRATER JOSEPH RESIDENTIAL HOME (3347 QUAKER RD in GASPORT, NY)
Large Quantity Generators, more that 1000 kg of hazardous waste/month (Resource Conservation and Recovery Act (tracking hazardous waste)) Organizations: JOSEPH HEITZENRATER (CONTACT/OWNER)
CLEAN HARBORS ENVIRON SERVICES (3542 WRUCK RD in GASPORT, NY)
Large Quantity Generators, more that 1000 kg of hazardous waste/month (Resource Conservation and Recovery Act (tracking hazardous waste)) Organizations: TOWN OF HARTLAND (CONTACT/OWNER)
8514 EAST AVE ( in GASPORT, NY)
National Pollutant Discharge Elimination System NON-MAJOR (Tracking pollutant discharge elimination systems) - permit Organizations: THE CARPET DOCTOR (CONTACT/OWNER)
Alternative names: THE CARPET DOCTOR
(Resource Conservation and Recovery Act (tracking hazardous waste))
BILL'S AUTO REPAIR & PAINTING (7806 RIDGE RD in GASPORT, NY)
(Resource Conservation and Recovery Act (tracking hazardous waste))
Housing units lacking complete plumbing facilities: 3.3% Housing units lacking complete kitchen facilities: 5.5%
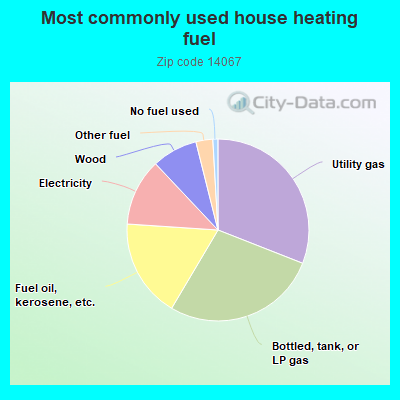
30.9%Utility gas
27.5%Bottled, tank, or LP gas
17.5%Fuel oil, kerosene, etc.
11.9%Electricity
8.1%Wood
3.0%Other fuel
0.9%No fuel used
Population in 1990: 6,010.
Place of birth for U.S.-born residents:
This state: 3,590
Northeast: 114
Midwest: 87
South: 64
West: 72
72% of the 14067 zip code residents lived in the same house 5 years ago. Out of people who lived in different houses, 83% lived in this county. Out of people who lived in different counties, 50% lived in New York.
92% of the 14067 zip code residents lived in the same house 1 year ago. Out of people who lived in different houses, 80% moved from this county. Out of people who lived in different houses, 15% moved from different county within same state. Out of people who lived in different houses, 1% moved from abroad.
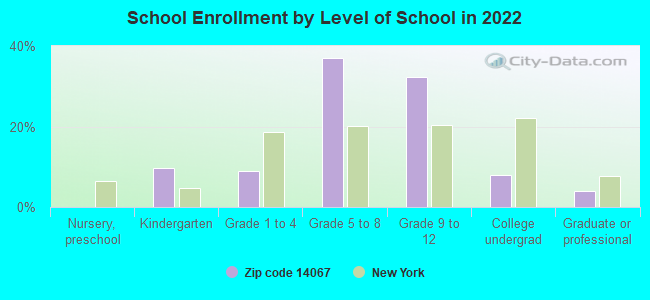
Private vs. public school enrollment:
Students in private schools in grades 1 to 8 (elementary and middle school): 46
Here:
14.3%
New York:
15.6%
Students in private schools in grades 9 to 12 (high school): 18
Here:
8.0%
New York:
15.0%
Students in private undergraduate colleges: 39
Here:
68.0%
New York:
39.2%
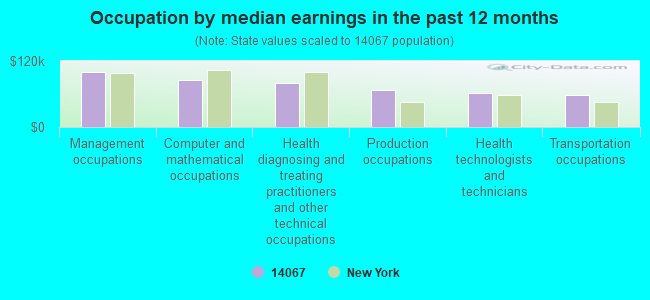
Occupation by median earnings in the past 12 months ($)
99,632Management occupations
84,587Computer and mathematical occupations
79,659Health diagnosing and treating practitioners and other technical occupations
66,736Production occupations
61,733Health technologists and technicians
57,804Transportation occupations
Top industries in this zip code by the number of employees in 2005:
Health Care and Social Assistance: Nursing Care Facilities (50-99 employees: 1 establishment)
Administrative and Support and Waste Management and Remediation Services: Janitorial Services (10-19: 1, 5-9: 1)
Accommodation and Food Services: Full-Service Restaurants (5-9: 2, 1-4: 1)
Construction: Oil and Gas Pipeline and Related Structures Construction (10-19: 1)
Construction: Masonry Contractors (10-19: 1)
Information: Software Publishers (10-19: 1)
People in group quarters in 2010:
73 people in nursing facilities/skilled-nursing facilities
People in group quarters in 2000:
94 people in nursing homes
Fatal accident statistics in 2014:
Fatal accident count: 1
Vehicles involved in fatal accidents: 1
Fatal accidents caused by drunken drivers: 0
Fatalities: 1
Persons involved in fatal accidents: 1
Pedestrians involved in fatal accidents: 0
Fatal accident statistics in 2013:
Fatal accident count: 1
Vehicles involved in fatal accidents: 2
Fatal accidents caused by drunken drivers: 0
Fatalities: 1
Persons involved in fatal accidents: 2
Pedestrians involved in fatal accidents: 0
Home Mortgage Disclosure Act Aggregated Statistics For Year 2009 (Based on 4 partial tracts)
A) FHA, FSA/RHS & VA Home Purchase Loans
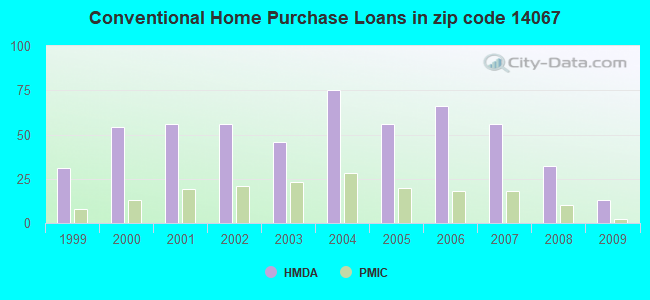
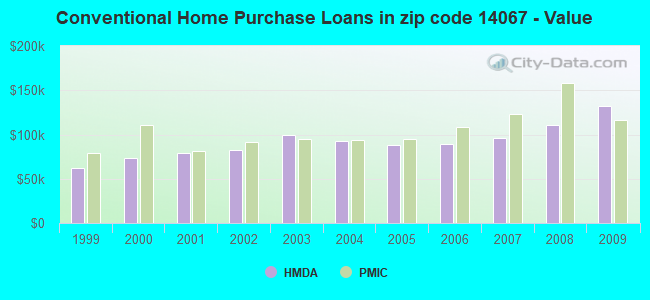
B) Conventional Home Purchase Loans
C) Refinancings
D) Home Improvement Loans
F) Non-occupant Loans on < 5 Family Dwellings (A B C & D)
Number
Average Value
Number
Average Value
Number
Average Value
Number
Average Value
Number
Average Value
LOANS ORIGINATED
20
$107,147
13
$132,067
74
$103,114
10
$27,931
3
$68,887
APPLICATIONS APPROVED, NOT ACCEPTED
2
$115,300
2
$79,145
15
$124,028
4
$47,648
1
$108,430
APPLICATIONS DENIED
7
$153,291
3
$88,750
46
$102,826
10
$14,770
3
$63,290
APPLICATIONS WITHDRAWN
3
$107,073
1
$78,910
28
$117,156
1
$67,590
0
$0
FILES CLOSED FOR INCOMPLETENESS
1
$63,850
1
$144,920
9
$101,538
1
$5,350
1
$109,270
Aggregated Statistics For Year 2008 (Based on 4 partial tracts)
A) FHA, FSA/RHS & VA Home Purchase Loans
B) Conventional Home Purchase Loans
C) Refinancings
D) Home Improvement Loans
E) Loans on Dwellings For 5+ Families
F) Non-occupant Loans on < 5 Family Dwellings (A B C & D)
G) Loans On Manufactured Home Dwelling (A B C & D)
Number
Average Value
Number
Average Value
Number
Average Value
Number
Average Value
Number
Average Value
Number
Average Value
Number
Average Value
LOANS ORIGINATED
25
$100,153
32
$110,618
52
$109,567
14
$29,191
1
$88,250
3
$61,760
2
$61,145
APPLICATIONS APPROVED, NOT ACCEPTED
1
$57,830
3
$109,027
10
$88,861
5
$34,236
0
$0
1
$84,680
0
$0
APPLICATIONS DENIED
3
$133,873
7
$89,300
61
$107,347
29
$46,730
0
$0
4
$71,210
1
$53,610
APPLICATIONS WITHDRAWN
2
$85,895
1
$45,180
28
$121,082
1
$103,010
0
$0
0
$0
0
$0
FILES CLOSED FOR INCOMPLETENESS
1
$36,750
2
$36,995
7
$88,349
0
$0
0
$0
1
$84,680
0
$0
Aggregated Statistics For Year 2007 (Based on 4 partial tracts)
A) FHA, FSA/RHS & VA Home Purchase Loans
B) Conventional Home Purchase Loans
C) Refinancings
D) Home Improvement Loans
F) Non-occupant Loans on < 5 Family Dwellings (A B C & D)
G) Loans On Manufactured Home Dwelling (A B C & D)
Number
Average Value
Number
Average Value
Number
Average Value
Number
Average Value
Number
Average Value
Number
Average Value
LOANS ORIGINATED
21
$94,919
56
$96,564
68
$89,956
30
$31,942
6
$62,512
4
$49,160
APPLICATIONS APPROVED, NOT ACCEPTED
1
$95,380
8
$72,432
20
$89,604
10
$45,764
0
$0
0
$0
APPLICATIONS DENIED
3
$45,460
13
$84,549
79
$95,965
28
$32,052
4
$107,050
2
$50,165
APPLICATIONS WITHDRAWN
2
$74,095
5
$67,110
32
$94,402
6
$73,708
1
$60,240
0
$0
FILES CLOSED FOR INCOMPLETENESS
1
$71,310
3
$109,637
8
$96,724
1
$8,910
1
$32,530
0
$0
Aggregated Statistics For Year 2006 (Based on 4 partial tracts)
A) FHA, FSA/RHS & VA Home Purchase Loans
B) Conventional Home Purchase Loans
C) Refinancings
D) Home Improvement Loans
F) Non-occupant Loans on < 5 Family Dwellings (A B C & D)
G) Loans On Manufactured Home Dwelling (A B C & D)
Number
Average Value
Number
Average Value
Number
Average Value
Number
Average Value
Number
Average Value
Number
Average Value
LOANS ORIGINATED
22
$99,298
66
$89,125
73
$82,985
34
$40,972
6
$113,300
1
$70,480
APPLICATIONS APPROVED, NOT ACCEPTED
0
$0
3
$110,900
16
$95,441
6
$28,890
2
$120,940
0
$0
APPLICATIONS DENIED
0
$0
12
$99,401
92
$91,864
36
$48,846
1
$156,620
1
$98,780
APPLICATIONS WITHDRAWN
1
$52,410
10
$77,147
60
$81,969
7
$82,303
1
$9,040
0
$0
FILES CLOSED FOR INCOMPLETENESS
0
$0
4
$60,052
15
$136,177
1
$30,120
1
$116,260
0
$0
Aggregated Statistics For Year 2005 (Based on 4 partial tracts)
A) FHA, FSA/RHS & VA Home Purchase Loans
B) Conventional Home Purchase Loans
C) Refinancings
D) Home Improvement Loans
F) Non-occupant Loans on < 5 Family Dwellings (A B C & D)
G) Loans On Manufactured Home Dwelling (A B C & D)
Number
Average Value
Number
Average Value
Number
Average Value
Number
Average Value
Number
Average Value
Number
Average Value
LOANS ORIGINATED
10
$97,905
56
$87,782
99
$78,687
33
$27,504
7
$64,161
1
$69,580
APPLICATIONS APPROVED, NOT ACCEPTED
0
$0
7
$66,921
24
$88,848
6
$52,667
1
$43,980
1
$95,660
APPLICATIONS DENIED
0
$0
13
$62,189
132
$91,118
27
$38,880
5
$42,704
4
$45,700
APPLICATIONS WITHDRAWN
0
$0
4
$76,780
63
$102,989
10
$73,022
2
$84,685
1
$124,590
FILES CLOSED FOR INCOMPLETENESS
0
$0
4
$107,942
23
$117,647
2
$16,565
1
$43,370
0
$0
Aggregated Statistics For Year 2004 (Based on 4 partial tracts)
A) FHA, FSA/RHS & VA Home Purchase Loans
B) Conventional Home Purchase Loans
C) Refinancings
D) Home Improvement Loans
F) Non-occupant Loans on < 5 Family Dwellings (A B C & D)
G) Loans On Manufactured Home Dwelling (A B C & D)
Number
Average Value
Number
Average Value
Number
Average Value
Number
Average Value
Number
Average Value
Number
Average Value
LOANS ORIGINATED
14
$99,079
75
$93,009
124
$89,189
17
$27,475
4
$40,325
2
$57,830
APPLICATIONS APPROVED, NOT ACCEPTED
0
$0
6
$121,292
22
$84,270
3
$45,327
0
$0
0
$0
APPLICATIONS DENIED
1
$53,610
10
$89,696
94
$92,162
24
$42,323
6
$81,942
2
$66,610
APPLICATIONS WITHDRAWN
1
$56,630
1
$186,740
65
$88,953
10
$63,077
1
$76,960
0
$0
FILES CLOSED FOR INCOMPLETENESS
0
$0
3
$103,743
22
$97,957
4
$22,130
0
$0
0
$0
Aggregated Statistics For Year 2003 (Based on 4 partial tracts)
A) FHA, FSA/RHS & VA Home Purchase Loans
B) Conventional Home Purchase Loans
C) Refinancings
D) Home Improvement Loans
F) Non-occupant Loans on < 5 Family Dwellings (A B C & D)
Number
Average Value
Number
Average Value
Number
Average Value
Number
Average Value
Number
Average Value
LOANS ORIGINATED
16
$81,348
46
$99,335
195
$82,985
16
$18,355
6
$58,633
APPLICATIONS APPROVED, NOT ACCEPTED
1
$74,880
5
$78,892
27
$83,479
4
$29,695
0
$0
APPLICATIONS DENIED
2
$87,110
5
$59,914
94
$92,273
18
$21,007
0
$0
APPLICATIONS WITHDRAWN
2
$94,415
5
$97,364
64
$80,134
4
$50,720
0
$0
FILES CLOSED FOR INCOMPLETENESS
0
$0
1
$207,830
6
$86,575
2
$74,195
0
$0
Aggregated Statistics For Year 2002 (Based on 4 partial tracts)
A) FHA, FSA/RHS & VA Home Purchase Loans
B) Conventional Home Purchase Loans
C) Refinancings
D) Home Improvement Loans
F) Non-occupant Loans on < 5 Family Dwellings (A B C & D)
Number
Average Value
Number
Average Value
Number
Average Value
Number
Average Value
Number
Average Value
LOANS ORIGINATED
15
$80,339
56
$82,952
140
$80,123
10
$38,415
3
$71,100
APPLICATIONS APPROVED, NOT ACCEPTED
1
$70,420
4
$47,282
21
$63,842
6
$14,947
1
$33,130
APPLICATIONS DENIED
1
$125,900
6
$68,167
74
$73,925
13
$16,967
0
$0
APPLICATIONS WITHDRAWN
1
$123,460
3
$77,100
62
$78,205
2
$10,695
0
$0
FILES CLOSED FOR INCOMPLETENESS
1
$52,590
1
$84,680
13
$73,826
0
$0
0
$0
Aggregated Statistics For Year 2001 (Based on 4 partial tracts)
A) FHA, FSA/RHS & VA Home Purchase Loans
B) Conventional Home Purchase Loans
C) Refinancings
D) Home Improvement Loans
F) Non-occupant Loans on < 5 Family Dwellings (A B C & D)
Number
Average Value
Number
Average Value
Number
Average Value
Number
Average Value
Number
Average Value
LOANS ORIGINATED
11
$68,747
56
$78,595
121
$81,693
22
$20,141
1
$81,930
APPLICATIONS APPROVED, NOT ACCEPTED
1
$53,010
2
$87,960
27
$78,687
4
$25,198
0
$0
APPLICATIONS DENIED
1
$68,670
12
$69,650
100
$70,877
19
$17,199
0
$0
APPLICATIONS WITHDRAWN
1
$38,550
3
$56,550
63
$76,282
3
$49,877
1
$38,330
FILES CLOSED FOR INCOMPLETENESS
1
$43,370
0
$0
9
$87,270
0
$0
0
$0
Aggregated Statistics For Year 2000 (Based on 4 partial tracts)
A) FHA, FSA/RHS & VA Home Purchase Loans
B) Conventional Home Purchase Loans
C) Refinancings
D) Home Improvement Loans
F) Non-occupant Loans on < 5 Family Dwellings (A B C & D)
Number
Average Value
Number
Average Value
Number
Average Value
Number
Average Value
Number
Average Value
LOANS ORIGINATED
20
$85,782
54
$73,366
63
$60,477
36
$19,607
2
$57,830
APPLICATIONS APPROVED, NOT ACCEPTED
0
$0
5
$48,476
22
$58,405
7
$13,933
1
$70,420
APPLICATIONS DENIED
1
$31,320
6
$67,638
74
$54,272
20
$25,268
1
$112,990
APPLICATIONS WITHDRAWN
1
$71,690
2
$57,230
28
$52,922
1
$17,830
1
$48,140
FILES CLOSED FOR INCOMPLETENESS
0
$0
1
$121,530
7
$71,221
1
$37,350
0
$0
Aggregated Statistics For Year 1999 (Based on 2 partial tracts)
A) FHA, FSA/RHS & VA Home Purchase Loans
B) Conventional Home Purchase Loans
C) Refinancings
D) Home Improvement Loans
F) Non-occupant Loans on < 5 Family Dwellings (A B C & D)
Detailed PMIC statistics for the following Tracts:0240.01
, 0241.01
2002 - 2018 National Fire Incident Reporting System (NFIRS) incidents
Based on the data from the years 2002 - 2018 the average number of fire incidents per year is 25. The highest number of reported fires - 43 took place in 2012, and the least - 9 in 2002. The data has a rising trend.
When looking into fire subcategories, the most incidents belonged to: Structure Fires (45.6%), and Outside Fires (32.0%).
Fire incident types reported to NFIRS in Zip Code 14067
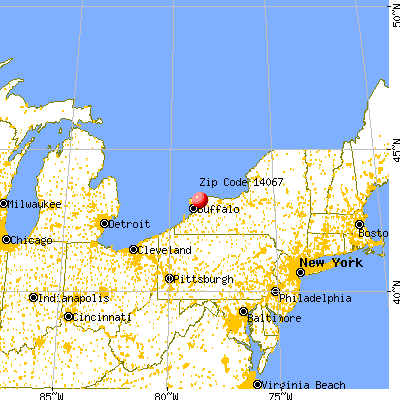


 Nearest zip codes: 14105, 14008, 14012, 14094, 14108, 14032.


 Based on the data from the years 2002 - 2018 the average number of fire incidents per year is 25. The highest number of reported fires - 43 took place in 2012, and the least - 9 in 2002. The data has a rising trend.
 When looking into fire subcategories, the most incidents belonged to: Structure Fires (45.6%), and Outside Fires (32.0%).