Estimated zip code population in 2022: 3,280 Zip code population in 2010: 3,314 Zip code population in 2000: 3,503
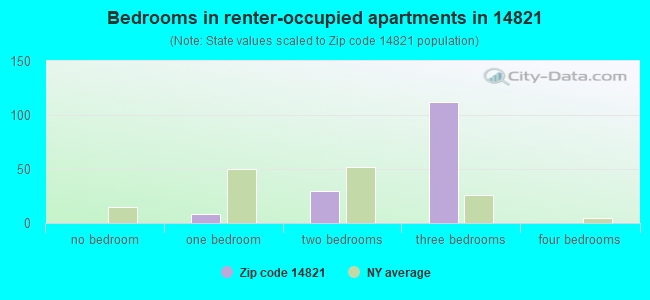
Houses and condos: 1,450 Renter-occupied apartments: 149
% of renters here:
12%
State:
46%
March 2022 cost of living index in zip code 14821: 94.0 (less than average, U.S. average is 100)
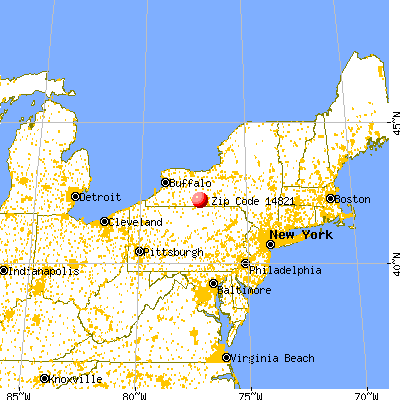
Land area: 54.3 sq. mi. Water area: 0.1 sq. mi.
Population density: 60 people per square mile
(very low).
OSM Map
General Map
Google Map
MSN Map
OSM Map
General Map
Google Map
MSN Map
OSM Map
General Map
Google Map
MSN Map
OSM Map
General Map
Google Map
MSN Map
Please wait while loading the map...
Real estate property taxes paid for housing units in 2022:
This zip code:
2.4% ($3,161)
New York:
1.5% ($6,180)
Median real estate property taxes paid for housing units with mortgages in 2022: $3,312 (2.2%) Median real estate property taxes paid for housing units with no mortgage in 2022: $2,926 (2.8%)
Averages for the 2020 tax year for zip code 14821, filed in 2021:
Average Adjusted Gross Income (AGI) in 2020: $54,227 (Individual Income Tax Returns)
Here:
$54,227
State:
$90,930
Salary/wage: $46,853 (reported on 79.2% of returns)
Here:
$46,853
State:
$72,104
(% of AGI for various income ranges: 988.5% for AGIs below $25k, 3140.6% for AGIs $25k-50k, 5800.5% for AGIs $50k-75k, 8586.7% for AGIs $75k-100k, 16356.4% for AGIs $100k-200k)
Taxable interest for individuals: $573 (reported on 40.3% of returns)
This zip code:
$573
New York:
$3,075
(% of AGI for various income ranges: 10.9% for AGIs below $25k, 16.6% for AGIs $25k-50k, 31.4% for AGIs $50k-75k, 68.9% for AGIs $75k-100k, 94.3% for AGIs $100k-200k)
Ordinary dividends: $2,231 (reported on 16.9% of returns)
Here:
$2,231
State:
$11,095
(% of AGI for various income ranges: 10.3% for AGIs below $25k, 20.9% for AGIs $25k-50k, 63.3% for AGIs $50k-75k, 83.3% for AGIs $75k-100k, 188.6% for AGIs $100k-200k)
Net capital gain/loss in AGI: +$5,132 (reported on 14.3% of returns)
Here:
+$5,132
State:
+$44,925
(% of AGI for various income ranges: 6.2% for AGIs below $25k, 13.1% for AGIs $25k-50k, 104.3% for AGIs $50k-75k, 145.6% for AGIs $75k-100k, 508.6% for AGIs $100k-200k)
Profit/loss from business: +$7,788 (reported on 10.4% of returns)
Here:
+$7,788
State:
+$14,940
(% of AGI for various income ranges: 76.2% for AGIs below $25k, 46.0% for AGIs $25k-50k, 232.9% for AGIs $50k-75k, 240.7% for AGIs $100k-200k)
Taxable individual retirement arrangement distribution: $17,020 (reported on 9.7% of returns)
14821:
$17,020
New York:
$19,609
(% of AGI for various income ranges: 30.9% for AGIs below $25k, 106.6% for AGIs $25k-50k, 147.6% for AGIs $50k-75k, 514.4% for AGIs $75k-100k, 930.0% for AGIs $100k-200k)
Total itemized deductions: $22,025 (reported on 2.6% of returns)
Here:
$22,025
State:
$39,326
(% of AGI for various income ranges: 978.9% for AGIs $75k-100k)
Charity contributions: $6,500 (reported on 1.9% of returns)
Here:
$6,500
State:
$15,420
(% of AGI for various income ranges: 92.9% for AGIs $50k-75k)
Taxes paid: $7,525 (reported on 2.6% of returns)
14821:
$7,525
State:
$9,183
(% of AGI for various income ranges: 334.4% for AGIs $75k-100k)
Earned income credit: $2,125 (reported on 15.6% of returns)
Here:
$2,125
State:
$2,138
(% of AGI for various income ranges: 91.8% for AGIs below $25k, 56.6% for AGIs $25k-50k)
Percentage of individuals using paid preparers for their 2020 taxes: 97.4%
Here:
97%
State:
95%
(% for various income ranges: 95.7% for AGIs below $25k, 97.7% for AGIs $25k-50k, 100.0% for AGIs $50k-75k, 100.0% for AGIs $75k-100k, 95.2% for AGIs $100k-200k, 100.0% for AGIs over 200k)
Averages for the 2012 tax year for zip code 14821, filed in 2013:
Average Adjusted Gross Income (AGI) in 2012: $45,476 (Individual Income Tax Returns)
Here:
$45,476
State:
$77,088
Salary/wage: $40,376 (reported on 82.5% of returns)
Here:
$40,376
State:
$60,593
(% of AGI for various income ranges: 66.8% for AGIs below $25k, 78.1% for AGIs $25k-50k, 78.8% for AGIs $50k-75k, 77.3% for AGIs $75k-100k, 65.7% for AGIs $100k-200k)
Taxable interest for individuals: $592 (reported on 40.0% of returns)
This zip code:
$592
New York:
$3,125
(% of AGI for various income ranges: 1.6% for AGIs below $25k, 0.4% for AGIs $25k-50k, 0.3% for AGIs $50k-75k, 0.2% for AGIs $75k-100k, 0.6% for AGIs $100k-200k)
Ordinary dividends: $1,650 (reported on 18.8% of returns)
Here:
$1,650
State:
$10,299
(% of AGI for various income ranges: 0.7% for AGIs below $25k, 1.0% for AGIs $25k-50k, 0.6% for AGIs $50k-75k, 0.5% for AGIs $75k-100k, 0.7% for AGIs $100k-200k)
Net capital gain/loss in AGI: +$2,656 (reported on 11.2% of returns)
Here:
+$2,656
State:
+$42,474
(% of AGI for various income ranges: 0.3% for AGIs $75k-100k, 2.0% for AGIs $100k-200k)
Profit/loss from business: +$4,419 (reported on 10.0% of returns)
Here:
+$4,419
State:
+$16,168
(% of AGI for various income ranges: 4.6% for AGIs below $25k, 1.1% for AGIs $25k-50k, 0.3% for AGIs $50k-75k, 1.2% for AGIs $75k-100k)
Taxable individual retirement arrangement distribution: $11,705 (reported on 11.9% of returns)
14821:
$11,705
New York:
$17,621
(% of AGI for various income ranges: 3.6% for AGIs below $25k, 3.0% for AGIs $25k-50k, 2.9% for AGIs $50k-75k, 3.4% for AGIs $75k-100k, 2.8% for AGIs $100k-200k)
Total itemized deductions: $17,715 (19% of AGI, reported on 20.6% of returns)
Here:
$17,715
State:
$34,985
Here:
18.6% of AGI
State:
21.3% of AGI
(% of AGI for various income ranges: 4.2% for AGIs below $25k, 5.7% for AGIs $25k-50k, 6.5% for AGIs $50k-75k, 8.6% for AGIs $75k-100k, 11.8% for AGIs $100k-200k)
Charity contributions: $2,933 (reported on 16.9% of returns)
Here:
$2,933
State:
$5,572
(% of AGI for various income ranges: 0.9% for AGIs $25k-50k, 1.0% for AGIs $50k-75k, 1.0% for AGIs $75k-100k, 1.8% for AGIs $100k-200k)
Taxes paid: $8,648 (reported on 20.6% of returns)
14821:
$8,648
State:
$18,656
(% of AGI for various income ranges: 1.3% for AGIs below $25k, 2.2% for AGIs $25k-50k, 2.8% for AGIs $50k-75k, 3.9% for AGIs $75k-100k, 6.9% for AGIs $100k-200k)
Earned income credit: $2,034 (reported on 18.1% of returns)
Here:
$2,034
State:
$2,230
(% of AGI for various income ranges: 5.5% for AGIs below $25k, 1.2% for AGIs $25k-50k)
Percentage of individuals using paid preparers for their 2012 taxes: 50.0%
Here:
50%
State:
66%
(% for various income ranges: 43.1% for AGIs below $25k, 50.0% for AGIs $25k-50k, 57.1% for AGIs $50k-75k, 60.0% for AGIs $75k-100k, 57.1% for AGIs $100k-200k)
Averages for the 2004 tax year for zip code 14821, filed in 2005:
Average Adjusted Gross Income (AGI) in 2004: $36,931 (Individual Income Tax Returns)
Here:
$36,931
State:
$59,519
Salary/wage: $34,763 (reported on 84.1% of returns)
Here:
$34,763
State:
$50,673
(% of AGI for various income ranges: 82.6% for AGIs below $10k, 68.1% for AGIs $10k-25k, 83.3% for AGIs $25k-50k, 79.7% for AGIs $50k-75k, 83.5% for AGIs $75k-100k, 72.6% for AGIs over 100k)
Taxable interest for individuals: $954 (reported on 49.9% of returns)
This zip code:
$954
New York:
$2,377
(% of AGI for various income ranges: 4.1% for AGIs below $10k, 2.2% for AGIs $10k-25k, 1.4% for AGIs $25k-50k, 1.0% for AGIs $50k-75k, 0.5% for AGIs $75k-100k, 1.5% for AGIs over 100k)
Taxable dividends: $1,130 (reported on 19.4% of returns)
Here:
$1,130
State:
$5,394
(% of AGI for various income ranges: 2.7% for AGIs below $10k, 0.6% for AGIs $10k-25k, 0.7% for AGIs $25k-50k, 0.6% for AGIs $50k-75k, 0.2% for AGIs $75k-100k, 0.3% for AGIs over 100k)
Net capital gain/loss: +$2,490 (reported on 16.5% of returns)
Here:
+$2,490
State:
+$23,581
(% of AGI for various income ranges: -2.2% for AGIs below $10k, 0.6% for AGIs $10k-25k, 0.2% for AGIs $25k-50k, 1.4% for AGIs $50k-75k, 1.0% for AGIs $75k-100k, 3.4% for AGIs over 100k)
Profit/loss from business: +$2,073 (reported on 12.1% of returns)
Here:
+$2,073
State:
+$13,809
(% of AGI for various income ranges: -4.0% for AGIs below $10k, 4.6% for AGIs $10k-25k, -0.6% for AGIs $25k-50k, 0.4% for AGIs $50k-75k, 2.0% for AGIs $75k-100k, 0.0% for AGIs over 100k)
IRA payment deduction: $1,706 (reported on 2.3% of returns)
14821:
$1,706
New York:
$3,115
Total itemized deductions: $13,941 (20% of AGI, reported on 21.9% of returns)
Here:
$13,941
State:
$25,864
Here:
20.3% of AGI
State:
21.9% of AGI
(% of AGI for various income ranges: 9.0% for AGIs below $10k, 2.9% for AGIs $10k-25k, 6.9% for AGIs $25k-50k, 7.9% for AGIs $50k-75k, 10.2% for AGIs $75k-100k, 13.0% for AGIs over 100k)
Charity contributions deductions: $2,107 (3% of AGI, reported on 19.1% of returns)
Here:
$2,107
State:
$4,439
Here:
2.9% of AGI
State:
3.6% of AGI
(% of AGI for various income ranges: 0.2% for AGIs $10k-25k, 0.9% for AGIs $25k-50k, 1.0% for AGIs $50k-75k, 1.2% for AGIs $75k-100k, 2.3% for AGIs over 100k)
Total tax: $4,275 (reported on 73.7% of returns)
14821:
$4,275
State:
$11,730
(% of AGI for various income ranges: 2.0% for AGIs below $10k, 3.4% for AGIs $10k-25k, 6.4% for AGIs $25k-50k, 8.2% for AGIs $50k-75k, 10.8% for AGIs $75k-100k, 15.2% for AGIs over 100k)
Earned income credit: $1,637 (reported on 17.8% of returns)
Here:
$1,637
State:
$1,757
Percentage of individuals using paid preparers for their 2004 taxes: 59.1%
Here:
59%
State:
67%
(% for various income ranges: 48.7% for AGIs below $10k, 60.2% for AGIs $10k-25k, 61.8% for AGIs $25k-50k, 62.9% for AGIs $50k-75k, 62.4% for AGIs $75k-100k, 65.0% for AGIs over 100k)
Household received Food Stamps/SNAP in the past 12 months: 126 Household did not receive Food Stamps/SNAP in the past 12 months: 1,130
Women who had a birth in the past 12 months: 2 (0 now married, 2 unmarried) Women who did not have a birth in the past 12 months: 606 (318 now married, 282 unmarried)
Housing units in zip code 14821 with a mortgage: 597 (101 second mortgage, 7 home equity loan, 85 both second mortgage and home equity loan) Houses without a mortgage: 37
Median monthly owner costs for units with a mortgage: $1,314 Median monthly owner costs for units without a mortgage: $569
Residents with income below the poverty level in 2022:
This zip code:
11.7%
Whole state:
14.3%
Residents with income below 50% of the poverty level in 2022:
This zip code:
5.4%
Whole state:
6.8%
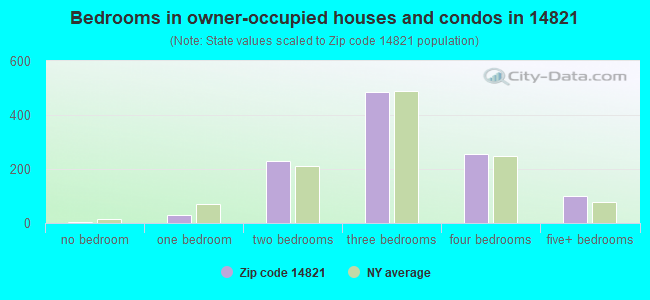
Median number of rooms in houses and condos:
Here:
6.9
State:
6.3
Median number of rooms in apartments:
Here:
5.3
State:
3.8
Notable locations in this zip code not listed on our city pages
Churches in zip code 14821 include: Campbell Alliance Church (A), Campbell United Methodist Church (B), Saint Joseph Church (C), Christian and Missionary Church (D), Curtis Baptist Bible Church (E). Display/hide their locations on the map
Cemeteries: Balcom Cemetery (1), Thurston Cemetery (2), Riverside Cemetery (3), Nute Cemetery (4), Hope Cemetery (5). Display/hide their locations on the map
In group quarters: 52 (-1 institutionalized population)
Size of family households: 458 2-persons, 222 3-persons, 174 4-persons, 68 5-persons, 35 6-persons, 3 7-or-more-persons
Size of nonfamily households: 219 1-person, 77 2-persons
436 married couples with children.
190 single-parent households (83 men, 107 women).
97.3% of residents of 14821 zip code speak English at home.
0.2% of residents speak Spanish at home (57% very well, 43% not well).
1.7% of residents speak other Indo-European language at home (53% very well, 25% well, 23% not well).
0.8% of residents speak Asian or Pacific Island language at home (56% very well, 24% well, 20% not well).
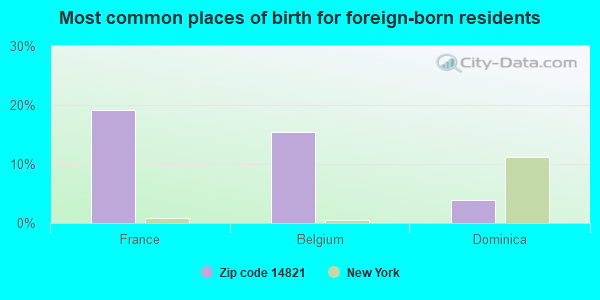
Foreign born population: 26 (0.8%) (75.1% of them are naturalized citizens)
This zip code:
0.8%
Whole state:
22.7%
19%France
15%Belgium
4%Dominica
27%American
17%Italian
15%English
10%Irish
9%German
3%Polish
1%French Canadian
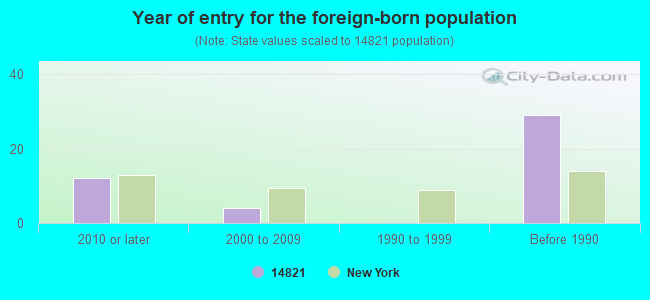
Year of entry for the foreign-born population
122010 or later
42000 to 2009
01990 to 1999
29Before 1990
Facilities with environmental interests located in this zip code:
CAMPBELL BULK PLANT (8537 CLINTON STREET in CAMPBELL, NY)
AIR SYNTHETIC MINOR (AIRS/AFS) STATE MASTER (New York facility tracking) - National Pollutant Discharge Elimination System Permit, AIR PROGRAM, National Pollutant Discharge Elimination System Permit National Pollutant Discharge Elimination System NON-MAJOR (Tracking pollutant discharge elimination systems) - permit Conditionally Exempt Small Quantity Generators, less than 100 kg/month of hazardous waste (Resource Conservation and Recovery Act (tracking hazardous waste)) - notification Business SIC classification: PETROLEUM BULK STATIONS AND TERMINALS; FUEL OIL DEALERS Business NAICS classification: HEATING OIL DEALERS. Organizations: SUBURBAN HEATING OIL PARTNERS LLC (CONTACT/OPERATOR)
, SUBURBAN HEATING OIL PRTN LLC (CONTACT/OWNER)
, AGWAY ENERGY PRODUCTS LLC (LEGALLY RESPONSIBLE PARTY)
, SUBURBAN HEATING OIL PARTNERS LLC (LEGALLY RESPONSIBLE PARTY)
Alternative names: AGWAY - CAMPBELL BULK PLANT, AGWAY ENERGY PRODUCTS, BUCK ENVIRONMENTAL LABS, INC
CAMPBELL-SAVONA MS HS (8455 CNTY RTE 125 in CAMPBELL, NY)
(National Center for Education Statistics) - STATE ID-570603040002 (National Center for Education Statistics) - STATE ID-570603040003 Organizations: CAMPBELL-SAVONA CSD (SCHOOL DISTRICT)
C G T C - COOPERS PLAINS MEASURING STA (VICTORY HWY NY RTE 415 in CAMPBELL, NY)
(Resource Conservation and Recovery Act (tracking hazardous waste))
CAMPBELL CENTRAL SCHOOL (MAINE ST in CAMPBELL, NY)
(Resource Conservation and Recovery Act (tracking hazardous waste))
CAMPBELL SAVONA BUS GARAGE (MAIN ST in CAMPBELL, NY)
Conditionally Exempt Small Quantity Generators, less than 100 kg/month of hazardous waste (Resource Conservation and Recovery Act (tracking hazardous waste)) - notification Organizations: NEW YORK STATE (CONTACT/OWNER)
Housing units lacking complete plumbing facilities: 4.6% Housing units lacking complete kitchen facilities: 1.4%
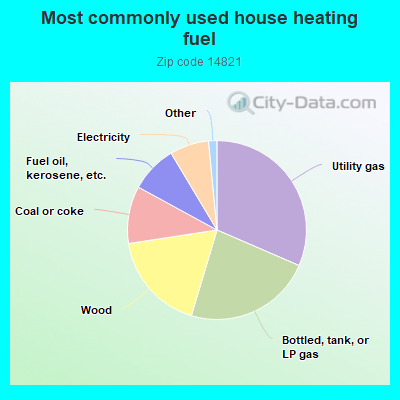
31.6%Utility gas
23.2%Bottled, tank, or LP gas
18.0%Wood
10.4%Coal or coke
8.5%Fuel oil, kerosene, etc.
7.1%Electricity
1.0%Other fuel
0.6%Solar energy
Population in 1990: 2,966. Population change in the 1990s: +537 (+18.1%).
Place of birth for U.S.-born residents:
This state: 2,744
Northeast: 357
Midwest: 28
South: 70
West: 21
64% of the 14821 zip code residents lived in the same house 5 years ago. Out of people who lived in different houses, 79% lived in this county. Out of people who lived in different counties, 50% lived in New York.
95% of the 14821 zip code residents lived in the same house 1 year ago. Out of people who lived in different houses, 83% moved from this county. Out of people who lived in different houses, 3% moved from different county within same state. Out of people who lived in different houses, 1% moved from different state. Out of people who lived in different houses, 8% moved from abroad.
Private vs. public school enrollment:
Students in private schools in grades 1 to 8 (elementary and middle school): 17
Here:
4.2%
New York:
15.6%
Students in private schools in grades 9 to 12 (high school): 28
Here:
16.2%
New York:
15.0%
Students in private undergraduate colleges: 25
Here:
32.8%
New York:
39.2%
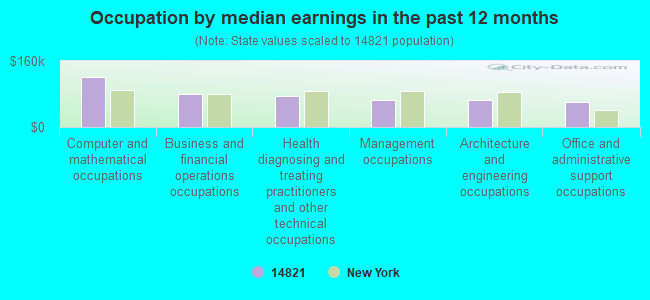
Occupation by median earnings in the past 12 months ($)
120,902Computer and mathematical occupations
79,923Business and financial operations occupations
74,506Health diagnosing and treating practitioners and other technical occupations
66,619Management occupations
65,844Architecture and engineering occupations
59,875Office and administrative support occupations
Top industries in this zip code by the number of employees in 2005:
Professional, Scientific, and Technical Services: Computer Systems Design Services (10-19 employees: 1 establishment)
Construction: Land Subdivision (10-19: 1)
Accommodation and Food Services: Limited-Service Restaurants (5-9: 1, 1-4: 2)
Health Care and Social Assistance: Nursing Care Facilities (5-9: 1)
People in group quarters in 2010:
9 people in group homes intended for adults
People in group quarters in 2000:
7 people in homes for the mentally retarded
Fatal accident statistics in 2014:
Fatal accident count: 1
Vehicles involved in fatal accidents: 1
Fatal accidents caused by drunken drivers: 1
Fatalities: 1
Persons involved in fatal accidents: 1
Pedestrians involved in fatal accidents: 0
Fatal accident statistics in 2013:
Fatal accident count: 1
Vehicles involved in fatal accidents: 1
Fatal accidents caused by drunken drivers: 1
Fatalities: 1
Persons involved in fatal accidents: 1
Pedestrians involved in fatal accidents: 0
2002 - 2018 National Fire Incident Reporting System (NFIRS) incidents
Based on the data from the years 2002 - 2018 the average number of fire incidents per year is 10. The highest number of reported fires - 23 took place in 2002, and the least - 1 in 2011. The data has a constant trend.
When looking into fire subcategories, the most incidents belonged to: Outside Fires (38.2%), and Structure Fires (36.5%).
Fire incident types reported to NFIRS in Zip Code 14821


 Nearest zip codes: 14879, 14827, 14870, 14820, 14801, 14810.


 Based on the data from the years 2002 - 2018 the average number of fire incidents per year is 10. The highest number of reported fires - 23 took place in 2002, and the least - 1 in 2011. The data has a constant trend.
 When looking into fire subcategories, the most incidents belonged to: Outside Fires (38.2%), and Structure Fires (36.5%).