Estimated zip code population in 2022: 720 Zip code population in 2010: 1,090 Zip code population in 2000: 1,083
Houses and condos: 380 Renter-occupied apartments: 89
% of renters here:
29%
State:
31%
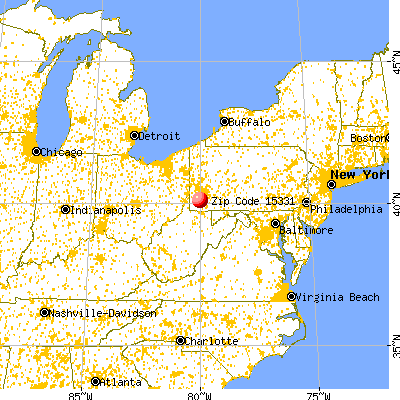
March 2022 cost of living index in zip code 15331: 89.2 (less than average, U.S. average is 100)
Land area: 0.8 sq. mi. Water area: 0.0 sq. mi.
Population density: 945 people per square mile
(low).
OSM Map
General Map
Google Map
MSN Map
OSM Map
General Map
Google Map
MSN Map
OSM Map
General Map
Google Map
MSN Map
OSM Map
General Map
Google Map
MSN Map
Please wait while loading the map...
Real estate property taxes paid for housing units in 2022:
This zip code:
1.0% ($986)
Pennsylvania:
1.3% ($3,094)
Median real estate property taxes paid for housing units with mortgages in 2022: $800 (0.8%) Median real estate property taxes paid for housing units with no mortgage in 2022: $1,130 (1.1%)
Business Search- 14 Million verified businesses
Males: 366
(50.9%)
Females: 353
(49.1%)
For population 25 years and over in 15331:
High school or higher: 84.6%
Bachelor's degree or higher: 12.2%
Graduate or professional degree: 4.3%
Unemployed: 10.7%
Mean travel time to work (commute): 25.8 minutes
For population 15 years and over in 15331:
Never married: 26.8%
Now married: 56.8%
Separated: 1.5%
Widowed: 4.4%
Divorced: 10.5%
Zip code 15331 compared to state average:
Median household income below state average.
Median house value significantly below state average.
Unemployed percentage above state average.
Black race population percentage significantly below state average.
Hispanic race population percentage significantly below state average.
Median age above state average.
Foreign-born population percentage significantly below state average.
Length of stay since moving in significantly above state average.
House age above state average.
Number of college students significantly below state average.
Percentage of population with a bachelor's degree or higher significantly below state average.
Estimated median house/condo value in 2022: $98,547
15331:
$98,547
Pennsylvania:
$245,500
According to our research of Pennsylvania and other state lists, there was 1 registered sex offender living in 15331 zip code as of June 15, 2024. The ratio of all residents to sex offenders in zip code 15331 is 736 to 1. The ratio of registered sex offenders to all residents in this zip code is near the state average.
Median resident age:
This zip code:
45.9 years
Pennsylvania median age:
40.9 years
Average household size:
This zip code:
2.3 people
Pennsylvania:
2.4 people
Averages for the 2004 tax year for zip code 15331, filed in 2005:
Average Adjusted Gross Income (AGI) in 2004: $30,183 (Individual Income Tax Returns)
Here:
$30,183
State:
$48,049
Salary/wage: $29,423 (reported on 79.9% of returns)
Here:
$29,423
State:
$42,646
(% of AGI for various income ranges: 62.8% for AGIs below $10k, 70.9% for AGIs $10k-25k, 82.5% for AGIs $25k-50k, 85.2% for AGIs $50k-75k, 71.5% for AGIs $75k-100k)
Taxable interest for individuals: $1,133 (reported on 37.4% of returns)
This zip code:
$1,133
Pennsylvania:
$1,657
(% of AGI for various income ranges: 4.1% for AGIs below $10k, 3.3% for AGIs $10k-25k, 1.4% for AGIs $25k-50k, 0.3% for AGIs $50k-75k, 0.6% for AGIs $75k-100k)
Taxable dividends: $986 (reported on 14.7% of returns)
Here:
$986
State:
$3,566
(% of AGI for various income ranges: 1.2% for AGIs below $10k, 0.3% for AGIs $10k-25k, 1.1% for AGIs $25k-50k, 0.0% for AGIs $50k-75k)
Profit/loss from business: +$3,268 (reported on 8.2% of returns)
Here:
+$3,268
State:
+$14,267
Total itemized deductions: $11,947 (22% of AGI, reported on 7.6% of returns)
Here:
$11,947
State:
$18,804
Here:
21.9% of AGI
State:
19.5% of AGI
Charity contributions deductions: $1,758 (3% of AGI, reported on 6.6% of returns)
Here:
$1,758
State:
$3,337
Here:
2.9% of AGI
State:
3.3% of AGI
Total tax: $3,416 (reported on 67.8% of returns)
15331:
$3,416
State:
$8,008
(% of AGI for various income ranges: 0.9% for AGIs below $10k, 3.2% for AGIs $10k-25k, 6.8% for AGIs $25k-50k, 8.4% for AGIs $50k-75k, 12.8% for AGIs $75k-100k)
Earned income credit: $1,568 (reported on 18.9% of returns)
Here:
$1,568
State:
$1,643
Percentage of individuals using paid preparers for their 2004 taxes: 61.4%
Here:
61%
State:
56%
(% for various income ranges: 55.7% for AGIs below $10k, 61.7% for AGIs $10k-25k, 66.7% for AGIs $25k-50k, 61.1% for AGIs $50k-75k, 57.6% for AGIs $75k-100k)
Household received Food Stamps/SNAP in the past 12 months: 111 Household did not receive Food Stamps/SNAP in the past 12 months: 204
Women who did not have a birth in the past 12 months: 134 (56 now married, 77 unmarried)
Housing units in zip code 15331 with a mortgage: 113 (6 second mortgage, 6 both second mortgage and home equity loan) Median monthly owner costs for units with a mortgage: $886 Median monthly owner costs for units without a mortgage: $470
Residents with income below the poverty level in 2022:
This zip code:
8.3%
Whole state:
11.8%
Residents with income below 50% of the poverty level in 2022:
This zip code:
7.6%
Whole state:
6.1%
Median number of rooms in houses and condos:
Here:
5.6
State:
6.8
Median number of rooms in apartments:
Here:
4.3
State:
4.3
Notable locations in this zip code not listed on our city pages
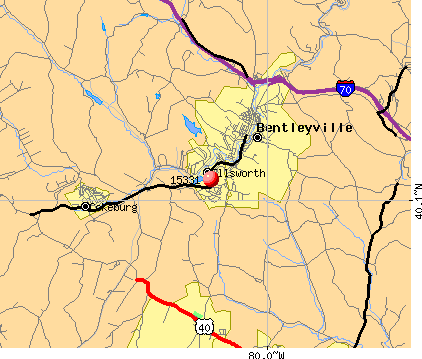
Notable locations in zip code 15331: Ellsworth Borough Building (A), Ellsworth Volunteer Fire Company Station 38 (B). Display/hide their locations on the map
Housing units lacking complete kitchen facilities: 1.9%
76.6%Utility gas
17.4%Electricity
6.2%Fuel oil, kerosene, etc.
Population in 1990: 1,040. Population change in the 1990s: +43 (+4.1%).
Place of birth for U.S.-born residents:
This state: 660
Midwest: 21
South: 31
70% of the 15331 zip code residents lived in the same house 5 years ago. Out of people who lived in different houses, 67% lived in this county. Out of people who lived in different counties, 50% lived in Pennsylvania.
93% of the 15331 zip code residents lived in the same house 1 year ago. Out of people who lived in different houses, 92% moved from this county. Out of people who lived in different houses, 5% moved from different state.
Private vs. public school enrollment:
Students in private schools in grades 1 to 8 (elementary and middle school): 28
Here:
38.6%
Pennsylvania:
15.7%
Students in private schools in grades 9 to 12 (high school):
Here:
0.0%
Pennsylvania:
13.4%
Students in private undergraduate colleges:
Here:
0.0%
Pennsylvania:
39.8%
Occupation by median earnings in the past 12 months ($)
54,365Office and administrative support occupations
38,499Construction and extraction occupations
17,897Food preparation and serving related occupations
Top industries in this zip code by the number of employees in 2005:
Educational Services: Elementary and Secondary Schools (20-49 employees: 1 establishment)
Other Services (except Public Administration): Labor Unions and Similar Labor Organizations (10-19: 1)
Administrative and Support and Waste Management and Remediation Services: Carpet and Upholstery Cleaning Services (10-19: 1)
Construction: Framing Contractors (5-9: 1)
Real Estate and Rental and Leasing: Lessors of Residential Buildings and Dwellings (1-4: 1)
Administrative and Support and Waste Management and Remediation Services: Office Administrative Services (1-4: 1)
Accommodation and Food Services: Food Service Contractors (1-4: 1)
Accommodation and Food Services: Drinking Places (Alcoholic Beverages) (1-4: 1)
People in group quarters in 2010:
8 people in group homes intended for adults
People in group quarters in 2000:
8 people in homes for the mentally retarded
Fatal accident statistics in 2014:
Fatal accident count: 1
Vehicles involved in fatal accidents: 1
Fatal accidents caused by drunken drivers: 1
Fatalities: 1
Persons involved in fatal accidents: 1
Pedestrians involved in fatal accidents: 1
Fatal accident statistics in 2013:
Fatal accident count: 1
Vehicles involved in fatal accidents: 1
Fatal accidents caused by drunken drivers: 0
Fatalities: 1
Persons involved in fatal accidents: 1
Pedestrians involved in fatal accidents: 0
Home Mortgage Disclosure Act Aggregated Statistics For Year 2009 (Based on 2 partial tracts)
A) FHA, FSA/RHS & VA Home Purchase Loans
B) Conventional Home Purchase Loans
C) Refinancings
D) Home Improvement Loans
F) Non-occupant Loans on < 5 Family Dwellings (A B C & D)
G) Loans On Manufactured Home Dwelling (A B C & D)
Number
Average Value
Number
Average Value
Number
Average Value
Number
Average Value
Number
Average Value
Number
Average Value
LOANS ORIGINATED
3
$59,770
5
$57,438
10
$98,230
1
$58,580
1
$36,430
0
$0
APPLICATIONS APPROVED, NOT ACCEPTED
0
$0
0
$0
3
$132,403
0
$0
0
$0
0
$0
APPLICATIONS DENIED
0
$0
0
$0
11
$80,045
5
$42,364
0
$0
1
$56,440
APPLICATIONS WITHDRAWN
0
$0
0
$0
3
$121,567
0
$0
0
$0
0
$0
FILES CLOSED FOR INCOMPLETENESS
0
$0
0
$0
1
$90,370
0
$0
0
$0
0
$0
Aggregated Statistics For Year 2008 (Based on 2 partial tracts)
A) FHA, FSA/RHS & VA Home Purchase Loans
B) Conventional Home Purchase Loans
C) Refinancings
D) Home Improvement Loans
F) Non-occupant Loans on < 5 Family Dwellings (A B C & D)
G) Loans On Manufactured Home Dwelling (A B C & D)
Number
Average Value
Number
Average Value
Number
Average Value
Number
Average Value
Number
Average Value
Number
Average Value
LOANS ORIGINATED
2
$62,690
4
$62,688
10
$77,905
4
$35,630
1
$37,510
1
$20,000
APPLICATIONS APPROVED, NOT ACCEPTED
0
$0
0
$0
4
$76,530
0
$0
0
$0
0
$0
APPLICATIONS DENIED
0
$0
2
$50,365
11
$88,358
5
$38,292
2
$33,400
1
$33,220
APPLICATIONS WITHDRAWN
0
$0
0
$0
3
$84,300
1
$23,220
1
$25,000
0
$0
FILES CLOSED FOR INCOMPLETENESS
0
$0
1
$45,720
1
$78,230
0
$0
0
$0
0
$0
Aggregated Statistics For Year 2007 (Based on 2 partial tracts)
A) FHA, FSA/RHS & VA Home Purchase Loans
B) Conventional Home Purchase Loans
C) Refinancings
D) Home Improvement Loans
F) Non-occupant Loans on < 5 Family Dwellings (A B C & D)
G) Loans On Manufactured Home Dwelling (A B C & D)
Number
Average Value
Number
Average Value
Number
Average Value
Number
Average Value
Number
Average Value
Number
Average Value
LOANS ORIGINATED
1
$76,800
14
$74,553
14
$69,807
8
$30,540
2
$70,725
0
$0
APPLICATIONS APPROVED, NOT ACCEPTED
0
$0
1
$87,160
3
$78,227
1
$17,860
0
$0
0
$0
APPLICATIONS DENIED
0
$0
5
$68,368
24
$69,416
8
$57,554
3
$44,173
1
$25,360
APPLICATIONS WITHDRAWN
0
$0
1
$67,150
6
$84,062
0
$0
0
$0
0
$0
FILES CLOSED FOR INCOMPLETENESS
0
$0
1
$39,290
0
$0
0
$0
0
$0
0
$0
Aggregated Statistics For Year 2006 (Based on 2 partial tracts)
A) FHA, FSA/RHS & VA Home Purchase Loans
B) Conventional Home Purchase Loans
C) Refinancings
D) Home Improvement Loans
F) Non-occupant Loans on < 5 Family Dwellings (A B C & D)
G) Loans On Manufactured Home Dwelling (A B C & D)
Number
Average Value
Number
Average Value
Number
Average Value
Number
Average Value
Number
Average Value
Number
Average Value
LOANS ORIGINATED
1
$125,730
9
$57,231
19
$68,037
6
$30,362
1
$18,930
0
$0
APPLICATIONS APPROVED, NOT ACCEPTED
0
$0
1
$72,510
8
$53,759
2
$34,115
0
$0
1
$47,860
APPLICATIONS DENIED
0
$0
4
$70,725
29
$76,318
6
$25,897
1
$67,870
1
$28,930
APPLICATIONS WITHDRAWN
0
$0
1
$75,730
10
$70,868
1
$25,000
0
$0
0
$0
FILES CLOSED FOR INCOMPLETENESS
0
$0
0
$0
2
$79,475
0
$0
0
$0
0
$0
Aggregated Statistics For Year 2005 (Based on 2 partial tracts)
A) FHA, FSA/RHS & VA Home Purchase Loans
B) Conventional Home Purchase Loans
C) Refinancings
D) Home Improvement Loans
F) Non-occupant Loans on < 5 Family Dwellings (A B C & D)
G) Loans On Manufactured Home Dwelling (A B C & D)
Number
Average Value
Number
Average Value
Number
Average Value
Number
Average Value
Number
Average Value
Number
Average Value
LOANS ORIGINATED
2
$90,550
12
$54,562
21
$66,967
5
$50,436
1
$114,300
0
$0
APPLICATIONS APPROVED, NOT ACCEPTED
1
$30,000
1
$20,720
6
$60,962
1
$45,360
1
$41,080
0
$0
APPLICATIONS DENIED
0
$0
2
$51,435
32
$69,989
7
$39,190
2
$34,290
2
$56,440
APPLICATIONS WITHDRAWN
0
$0
1
$54,290
13
$94,548
3
$89,897
0
$0
0
$0
FILES CLOSED FOR INCOMPLETENESS
0
$0
0
$0
3
$77,393
0
$0
0
$0
0
$0
Aggregated Statistics For Year 2004 (Based on 2 partial tracts)
A) FHA, FSA/RHS & VA Home Purchase Loans
B) Conventional Home Purchase Loans
C) Refinancings
D) Home Improvement Loans
F) Non-occupant Loans on < 5 Family Dwellings (A B C & D)
G) Loans On Manufactured Home Dwelling (A B C & D)
Number
Average Value
Number
Average Value
Number
Average Value
Number
Average Value
Number
Average Value
Number
Average Value
LOANS ORIGINATED
2
$52,510
11
$73,128
24
$77,453
8
$46,838
1
$48,940
1
$72,870
APPLICATIONS APPROVED, NOT ACCEPTED
0
$0
1
$85,370
6
$56,140
2
$30,900
0
$0
1
$64,300
APPLICATIONS DENIED
0
$0
10
$60,581
31
$64,722
7
$13,523
2
$33,935
4
$38,042
APPLICATIONS WITHDRAWN
0
$0
1
$81,800
10
$72,654
0
$0
1
$54,290
0
$0
FILES CLOSED FOR INCOMPLETENESS
0
$0
0
$0
4
$79,835
0
$0
0
$0
0
$0
Aggregated Statistics For Year 2003 (Based on 2 partial tracts)
A) FHA, FSA/RHS & VA Home Purchase Loans
B) Conventional Home Purchase Loans
C) Refinancings
D) Home Improvement Loans
F) Non-occupant Loans on < 5 Family Dwellings (A B C & D)
Number
Average Value
Number
Average Value
Number
Average Value
Number
Average Value
Number
Average Value
LOANS ORIGINATED
2
$49,470
8
$73,584
34
$63,645
8
$30,406
3
$25,600
APPLICATIONS APPROVED, NOT ACCEPTED
0
$0
0
$0
9
$63,621
1
$47,860
0
$0
APPLICATIONS DENIED
1
$34,290
5
$44,650
29
$65,860
5
$26,718
1
$17,860
APPLICATIONS WITHDRAWN
1
$35,360
1
$30,000
13
$65,999
1
$16,430
0
$0
FILES CLOSED FOR INCOMPLETENESS
0
$0
0
$0
1
$132,520
1
$28,930
0
$0
Aggregated Statistics For Year 2002 (Based on 2 partial tracts)
A) FHA, FSA/RHS & VA Home Purchase Loans
B) Conventional Home Purchase Loans
C) Refinancings
D) Home Improvement Loans
F) Non-occupant Loans on < 5 Family Dwellings (A B C & D)
Number
Average Value
Number
Average Value
Number
Average Value
Number
Average Value
Number
Average Value
LOANS ORIGINATED
3
$51,080
11
$60,984
24
$66,484
2
$25,360
1
$58,220
APPLICATIONS APPROVED, NOT ACCEPTED
0
$0
1
$79,300
8
$58,134
1
$43,580
0
$0
APPLICATIONS DENIED
0
$0
2
$32,325
28
$55,647
4
$38,755
1
$57,150
APPLICATIONS WITHDRAWN
0
$0
2
$54,115
12
$73,523
0
$0
0
$0
FILES CLOSED FOR INCOMPLETENESS
0
$0
0
$0
2
$61,795
0
$0
0
$0
Aggregated Statistics For Year 2001 (Based on 2 partial tracts)
A) FHA, FSA/RHS & VA Home Purchase Loans
B) Conventional Home Purchase Loans
C) Refinancings
D) Home Improvement Loans
F) Non-occupant Loans on < 5 Family Dwellings (A B C & D)
Number
Average Value
Number
Average Value
Number
Average Value
Number
Average Value
Number
Average Value
LOANS ORIGINATED
2
$60,545
9
$49,214
24
$51,080
4
$14,198
1
$23,580
APPLICATIONS APPROVED, NOT ACCEPTED
0
$0
2
$51,260
11
$49,294
1
$8,220
0
$0
APPLICATIONS DENIED
1
$42,510
4
$22,325
27
$49,029
4
$11,252
0
$0
APPLICATIONS WITHDRAWN
0
$0
1
$40,360
19
$51,719
2
$16,255
0
$0
FILES CLOSED FOR INCOMPLETENESS
0
$0
0
$0
3
$75,607
0
$0
0
$0
Aggregated Statistics For Year 2000 (Based on 2 partial tracts)
A) FHA, FSA/RHS & VA Home Purchase Loans
B) Conventional Home Purchase Loans
C) Refinancings
D) Home Improvement Loans
F) Non-occupant Loans on < 5 Family Dwellings (A B C & D)
Number
Average Value
Number
Average Value
Number
Average Value
Number
Average Value
Number
Average Value
LOANS ORIGINATED
2
$48,220
10
$59,009
19
$47,733
5
$19,788
1
$36,790
APPLICATIONS APPROVED, NOT ACCEPTED
0
$0
3
$50,007
11
$44,455
3
$20,003
0
$0
APPLICATIONS DENIED
1
$38,930
5
$43,936
27
$50,259
8
$19,110
1
$38,580
APPLICATIONS WITHDRAWN
0
$0
3
$86,800
10
$53,759
1
$13,930
0
$0
FILES CLOSED FOR INCOMPLETENESS
0
$0
0
$0
3
$47,863
0
$0
0
$0
Aggregated Statistics For Year 1999 (Based on 1 partial tract)
A) FHA, FSA/RHS & VA Home Purchase Loans
B) Conventional Home Purchase Loans
C) Refinancings
D) Home Improvement Loans
F) Non-occupant Loans on < 5 Family Dwellings (A B C & D)


 Nearest zip codes: 15313, 15314, 15324, 15358, 15427, 15360.


