Estimated zip code population in 2022: 1,468 Zip code population in 2010: 1,620 Zip code population in 2000: 1,552
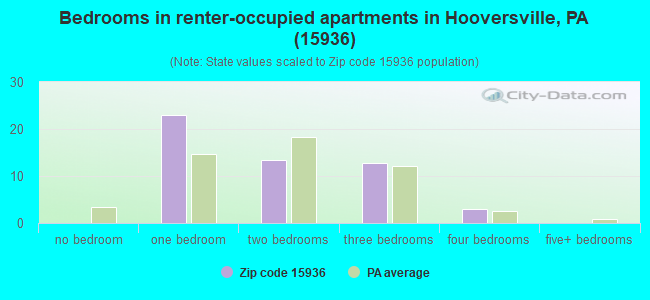
Houses and condos: 736 Renter-occupied apartments: 52
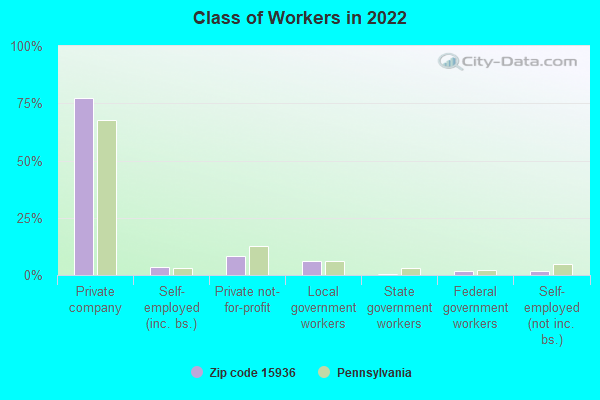
% of renters here:
8%
State:
31%
March 2022 cost of living index in zip code 15936: 90.0 (less than average, U.S. average is 100)
Land area: 24.6 sq. mi. Water area: 0.0 sq. mi.
Population density: 60 people per square mile
(very low).
OSM Map
General Map
Google Map
MSN Map
OSM Map
General Map
Google Map
MSN Map
OSM Map
General Map
Google Map
MSN Map
OSM Map
General Map
Google Map
MSN Map
Please wait while loading the map...
Real estate property taxes paid for housing units in 2022:
This zip code:
1.2% ($1,354)
Pennsylvania:
1.3% ($3,094)
Median real estate property taxes paid for housing units with mortgages in 2022: $1,412 (1.3%) Median real estate property taxes paid for housing units with no mortgage in 2022: $1,301 (1.1%)
Business Search- 14 Million verified businesses
Males: 768
(52.4%)
Females: 699
(47.6%)
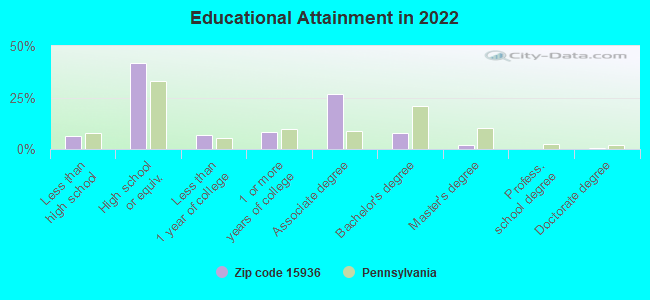
For population 25 years and over in 15936:
High school or higher: 92.6%
Bachelor's degree or higher: 10.0%
Graduate or professional degree: 2.5%
Unemployed: 2.9%
Mean travel time to work (commute): 20.9 minutes
For population 15 years and over in 15936:
Never married: 22.1%
Now married: 63.8%
Separated: 0.8%
Widowed: 8.3%
Divorced: 5.0%
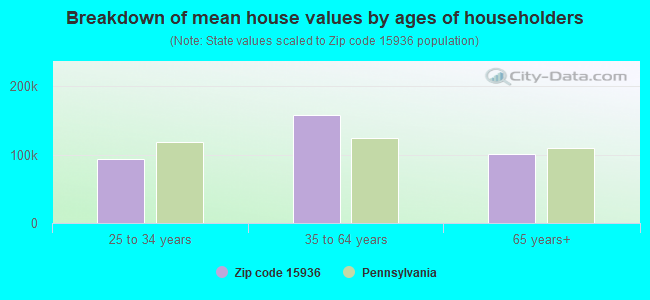
Zip code 15936 compared to state average:
Median house value below state average.
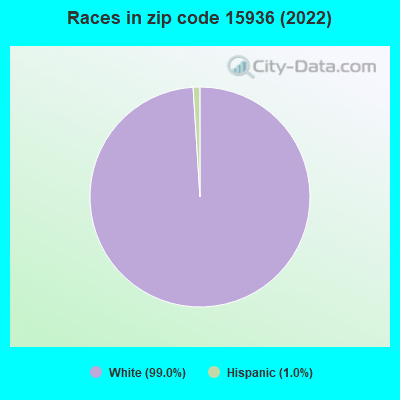
Black race population percentage significantly below state average.
Hispanic race population percentage significantly below state average.
Median age significantly above state average.
Foreign-born population percentage significantly below state average.
Renting percentage significantly below state average.
Length of stay since moving in significantly above state average.
Percentage of population with a bachelor's degree or higher significantly below state average.
Averages for the 2020 tax year for zip code 15936, filed in 2021:
Average Adjusted Gross Income (AGI) in 2020: $46,072 (Individual Income Tax Returns)
Here:
$46,072
State:
$75,707
Salary/wage: $43,455 (reported on 79.7% of returns)
Here:
$43,455
State:
$62,806
(% of AGI for various income ranges: 1116.5% for AGIs below $25k, 3150.6% for AGIs $25k-50k, 5926.2% for AGIs $50k-75k, 9394.0% for AGIs $75k-100k, 15046.0% for AGIs $100k-200k)
Taxable interest for individuals: $813 (reported on 33.3% of returns)
This zip code:
$813
Pennsylvania:
$1,633
(% of AGI for various income ranges: 13.5% for AGIs below $25k, 26.9% for AGIs $25k-50k, 7.5% for AGIs $50k-75k, 14.0% for AGIs $75k-100k, 216.0% for AGIs $100k-200k)
Ordinary dividends: $1,350 (reported on 14.5% of returns)
Here:
$1,350
State:
$7,382
(% of AGI for various income ranges: 14.1% for AGIs below $25k, 38.1% for AGIs $25k-50k, 100.0% for AGIs $100k-200k)
Net capital gain/loss in AGI: +$3,200 (reported on 10.1% of returns)
Here:
+$3,200
State:
+$23,522
(% of AGI for various income ranges: 20.6% for AGIs below $25k, 236.2% for AGIs $50k-75k)
Profit/loss from business: +$3,929 (reported on 10.1% of returns)
Here:
+$3,929
State:
+$16,274
(% of AGI for various income ranges: 121.2% for AGIs below $25k, 86.2% for AGIs $50k-75k)
Taxable individual retirement arrangement distribution: $9,567 (reported on 13.0% of returns)
15936:
$9,567
Pennsylvania:
$18,583
(% of AGI for various income ranges: 99.4% for AGIs below $25k, 101.9% for AGIs $25k-50k, 661.2% for AGIs $50k-75k)
Earned income credit: $2,370 (reported on 14.5% of returns)
Here:
$2,370
State:
$2,100
(% of AGI for various income ranges: 68.2% for AGIs below $25k, 75.6% for AGIs $25k-50k)
Percentage of individuals using paid preparers for their 2020 taxes: 92.8%
Here:
93%
State:
92%
(% for various income ranges: 92.3% for AGIs below $25k, 90.0% for AGIs $25k-50k, 90.0% for AGIs $50k-75k, 100.0% for AGIs $75k-100k, 100.0% for AGIs $100k-200k)
Averages for the 2012 tax year for zip code 15936, filed in 2013:
Average Adjusted Gross Income (AGI) in 2012: $45,013 (Individual Income Tax Returns)
Here:
$45,013
State:
$61,346
Salary/wage: $41,261 (reported on 81.4% of returns)
Here:
$41,261
State:
$51,902
(% of AGI for various income ranges: 67.8% for AGIs below $25k, 74.7% for AGIs $25k-50k, 77.7% for AGIs $50k-75k, 82.7% for AGIs $75k-100k, 70.6% for AGIs $100k-200k)
Taxable interest for individuals: $800 (reported on 40.0% of returns)
This zip code:
$800
Pennsylvania:
$1,588
(% of AGI for various income ranges: 2.2% for AGIs below $25k, 1.4% for AGIs $25k-50k, 0.4% for AGIs $50k-75k, 0.2% for AGIs $75k-100k, 0.2% for AGIs $100k-200k)
Ordinary dividends: $814 (reported on 20.0% of returns)
Here:
$814
State:
$5,827
(% of AGI for various income ranges: 0.6% for AGIs below $25k, 0.8% for AGIs $25k-50k, 0.4% for AGIs $50k-75k)
Net capital gain/loss in AGI: +$414 (reported on 10.0% of returns)
Here:
+$414
State:
+$14,495
(% of AGI for various income ranges: 0.3% for AGIs $25k-50k, 0.4% for AGIs $50k-75k)
Profit/loss from business: +$6,533 (reported on 12.9% of returns)
Here:
+$6,533
State:
+$16,268
(% of AGI for various income ranges: 6.1% for AGIs below $25k, 2.5% for AGIs $25k-50k, 2.9% for AGIs $50k-75k)
Taxable individual retirement arrangement distribution: $6,686 (reported on 10.0% of returns)
15936:
$6,686
Pennsylvania:
$14,550
Total itemized deductions: $16,470 (20% of AGI, reported on 14.3% of returns)
Here:
$16,470
State:
$23,538
Here:
20.2% of AGI
State:
18.4% of AGI
(% of AGI for various income ranges: 13.5% for AGIs below $25k, 7.3% for AGIs $50k-75k, 6.7% for AGIs $100k-200k)
Charity contributions: $3,250 (reported on 8.6% of returns)
Here:
$3,250
State:
$4,025
Taxes paid: $5,440 (reported on 14.3% of returns)
15936:
$5,440
State:
$9,982
(% of AGI for various income ranges: 2.3% for AGIs below $25k, 2.3% for AGIs $50k-75k, 3.1% for AGIs $100k-200k)
Earned income credit: $1,936 (reported on 15.7% of returns)
Here:
$1,936
State:
$2,106
(% of AGI for various income ranges: 4.2% for AGIs below $25k, 1.1% for AGIs $25k-50k)
Percentage of individuals using paid preparers for their 2012 taxes: 57.1%
Here:
57%
State:
53%
(% for various income ranges: 53.6% for AGIs below $25k, 55.6% for AGIs $25k-50k, 58.3% for AGIs $50k-75k, 66.7% for AGIs $75k-100k, 66.7% for AGIs $100k-200k)
Averages for the 2004 tax year for zip code 15936, filed in 2005:
Average Adjusted Gross Income (AGI) in 2004: $32,145 (Individual Income Tax Returns)
Here:
$32,145
State:
$48,049
Salary/wage: $30,432 (reported on 83.6% of returns)
Here:
$30,432
State:
$42,646
(% of AGI for various income ranges: 68.3% for AGIs below $10k, 71.8% for AGIs $10k-25k, 84.5% for AGIs $25k-50k, 82.9% for AGIs $50k-75k, 86.1% for AGIs $75k-100k, 60.8% for AGIs over 100k)
Taxable interest for individuals: $1,328 (reported on 42.0% of returns)
This zip code:
$1,328
Pennsylvania:
$1,657
(% of AGI for various income ranges: 3.2% for AGIs below $10k, 3.3% for AGIs $10k-25k, 1.1% for AGIs $25k-50k, 1.4% for AGIs $50k-75k, 0.3% for AGIs $75k-100k, 3.4% for AGIs over 100k)
Taxable dividends: $564 (reported on 19.7% of returns)
Here:
$564
State:
$3,566
(% of AGI for various income ranges: 1.2% for AGIs below $10k, 0.8% for AGIs $10k-25k, 0.3% for AGIs $25k-50k, 0.2% for AGIs $50k-75k, 0.4% for AGIs $75k-100k)
Net capital gain/loss: +$803 (reported on 8.6% of returns)
Here:
+$803
State:
+$9,716
(% of AGI for various income ranges: -0.1% for AGIs below $10k, 0.3% for AGIs $10k-25k, -0.2% for AGIs $25k-50k, 0.4% for AGIs $50k-75k, 1.1% for AGIs $75k-100k)
Profit/loss from business: +$6,479 (reported on 17.0% of returns)
Here:
+$6,479
State:
+$14,267
(% of AGI for various income ranges: 6.8% for AGIs below $10k, 7.7% for AGIs $10k-25k, 2.0% for AGIs $25k-50k, 3.8% for AGIs $50k-75k, 3.2% for AGIs $75k-100k)
IRA payment deduction: $1,333 (reported on 2.1% of returns)
15936:
$1,333
Pennsylvania:
$2,903
Total itemized deductions: $14,000 (22% of AGI, reported on 12.8% of returns)
Here:
$14,000
State:
$18,804
Here:
22.5% of AGI
State:
19.5% of AGI
(% of AGI for various income ranges: 4.5% for AGIs $10k-25k, 4.5% for AGIs $25k-50k, 5.9% for AGIs $50k-75k, 7.0% for AGIs $75k-100k, 9.2% for AGIs over 100k)
Charity contributions deductions: $2,649 (4% of AGI, reported on 10.8% of returns)
Here:
$2,649
State:
$3,337
Here:
4.0% of AGI
State:
3.3% of AGI
(% of AGI for various income ranges: 0.7% for AGIs $10k-25k, 0.5% for AGIs $25k-50k, 0.8% for AGIs $50k-75k, 0.8% for AGIs $75k-100k, 2.7% for AGIs over 100k)
Total tax: $3,464 (reported on 72.6% of returns)
15936:
$3,464
State:
$8,008
(% of AGI for various income ranges: 3.3% for AGIs below $10k, 3.9% for AGIs $10k-25k, 5.9% for AGIs $25k-50k, 8.0% for AGIs $50k-75k, 10.2% for AGIs $75k-100k, 16.7% for AGIs over 100k)
Earned income credit: $1,548 (reported on 17.4% of returns)
Here:
$1,548
State:
$1,643
Percentage of individuals using paid preparers for their 2004 taxes: 55.6%
Here:
56%
State:
56%
(% for various income ranges: 47.5% for AGIs below $10k, 51.7% for AGIs $10k-25k, 62.4% for AGIs $25k-50k, 59.6% for AGIs $50k-75k, 62.9% for AGIs $75k-100k, 63.2% for AGIs over 100k)
Household received Food Stamps/SNAP in the past 12 months: 78 Household did not receive Food Stamps/SNAP in the past 12 months: 606
Women who had a birth in the past 12 months: 9 (9 now married, 0 unmarried) Women who did not have a birth in the past 12 months: 195 (83 now married, 111 unmarried)
Housing units in zip code 15936 with a mortgage: 224 (33 second mortgage, 33 both second mortgage and home equity loan) Houses without a mortgage: 11
Median monthly owner costs for units with a mortgage: $1,077 Median monthly owner costs for units without a mortgage: $418
Residents with income below the poverty level in 2022:
This zip code:
7.5%
Whole state:
11.8%
Residents with income below 50% of the poverty level in 2022:
This zip code:
5.8%
Whole state:
6.1%
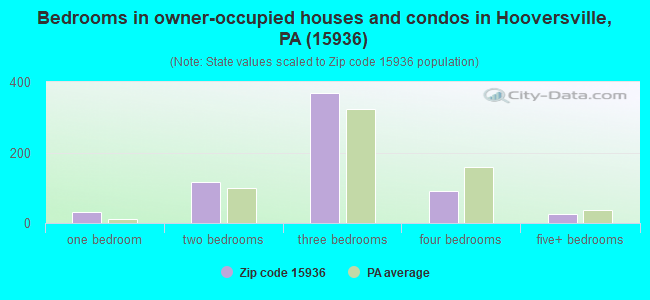
Median number of rooms in houses and condos:
Here:
6.7
State:
6.8
Median number of rooms in apartments:
Here:
4.3
State:
4.3
Notable locations in this zip code not listed on our city pages
Size of family households: 361 2-persons, 69 3-persons, 45 4-persons, 15 5-persons, 2 6-persons, 2 7-or-more-persons
Size of nonfamily households: 181 1-person, 9 2-persons
87 married couples with children.
31 single-parent households (14 men, 17 women).
99.5% of residents of 15936 zip code speak English at home.
0.3% of residents speak Spanish at home (100% very well).
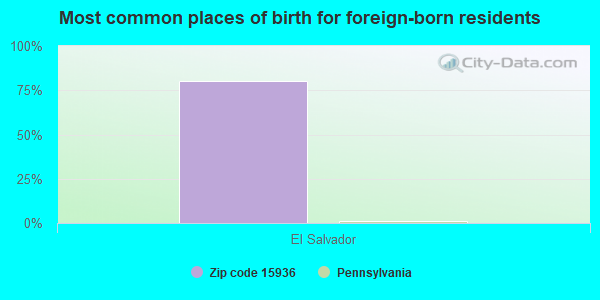
Foreign born population: 5 (0.3%) (0.0% of them are naturalized citizens)
:
0.3%
Whole state:
7.5%
80%El Salvador
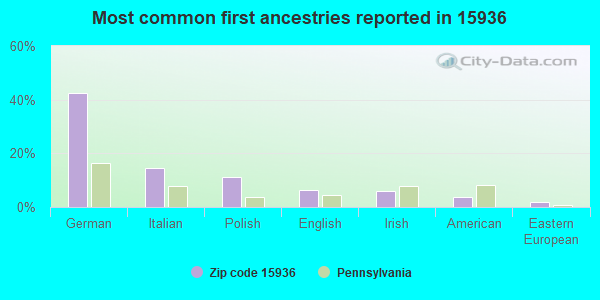
43%German
14%Italian
11%Polish
6%English
6%Irish
4%American
2%Eastern European
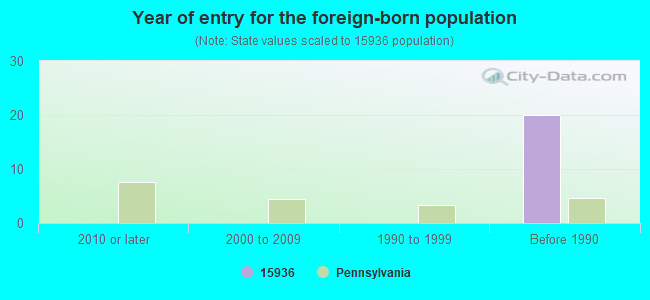
Year of entry for the foreign-born population
02010 or later
02000 to 2009
01990 to 1999
20Before 1990
Facilities with environmental interests located in this zip code:
BENNY J M RES STP (RR 1 BOX 1 in HOOVERSVILLE, PA)
STATE MASTER (Pennsylvania database) - PCS-PA0205435, National Pollutant Discharge Elimination System Permit National Pollutant Discharge Elimination System NON-MAJOR (Tracking pollutant discharge elimination systems) - permit Business SIC classification: SEWERAGE SYSTEMS Alternative names: BENNY J M RESIDENCE STP, BENNY, JOSEPH & MARGARET, JOSEPH & MARGARET BENNY
BARRONS SVC GARAGE (255 WATER ST in HOOVERSVILLE, PA)
STATE MASTER (Pennsylvania database) - RCRIS-PAR000002220, HAZARDOUS WASTE PROGRAM Conditionally Exempt Small Quantity Generators, less than 100 kg/month of hazardous waste (Resource Conservation and Recovery Act (tracking hazardous waste)) - notification Organizations: BARRON BERBERT (CONTACT/OWNER)
Housing units lacking complete plumbing facilities: 0.6% Housing units lacking complete kitchen facilities: 2.0%
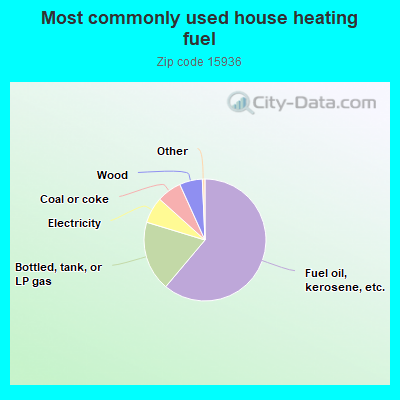
61.5%Fuel oil, kerosene, etc.
18.7%Bottled, tank, or LP gas
7.0%Electricity
6.6%Coal or coke
6.1%Wood
Population in 1990: 731. Population change in the 1990s: +821 (+112.3%).
Place of birth for U.S.-born residents:
This state: 1,270
Northeast: 34
Midwest: 26
South: 55
West: 49
77% of the 15936 zip code residents lived in the same house 5 years ago. Out of people who lived in different houses, 62% lived in this county. Out of people who lived in different counties, 50% lived in Pennsylvania.
96% of the 15936 zip code residents lived in the same house 1 year ago. Out of people who lived in different houses, 69% moved from this county. Out of people who lived in different houses, 24% moved from different county within same state. Out of people who lived in different houses, 9% moved from different state.
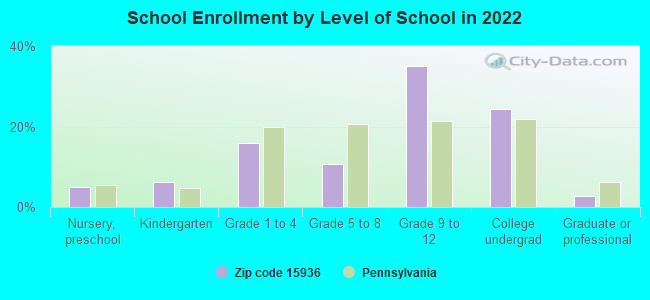
Private vs. public school enrollment:
Students in private schools in grades 1 to 8 (elementary and middle school): 5
Here:
11.2%
Pennsylvania:
15.7%
Students in private schools in grades 9 to 12 (high school): 6
Here:
10.6%
Pennsylvania:
13.4%
Students in private undergraduate colleges: 8
Here:
18.4%
Pennsylvania:
39.8%
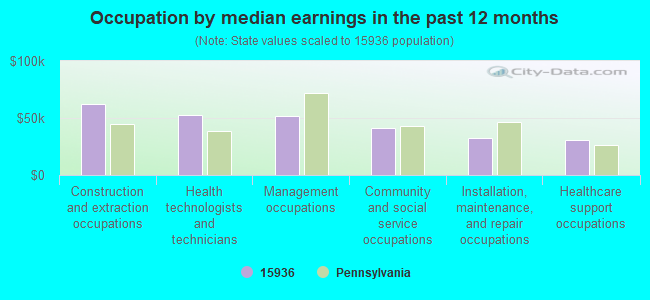
Occupation by median earnings in the past 12 months ($)
62,247Construction and extraction occupations
53,064Health technologists and technicians
51,571Management occupations
41,187Community and social service occupations
32,545Installation, maintenance, and repair occupations
30,354Healthcare support occupations
Top industries in this zip code by the number of employees in 2005:
Finance and Insurance: Real Estate Credit (20-49 employees: 1 establishment)
Accommodation and Food Services: Recreational and Vacation Camps (except Campgrounds) (5-9: 1)
Other Services (except Public Administration): General Automotive Repair (5-9: 1)
Accommodation and Food Services: Drinking Places (Alcoholic Beverages) (1-4: 2)
Other Services (except Public Administration): Religious Organizations (1-4: 2)
Construction: Residential Remodelers (1-4: 2)
Home Mortgage Disclosure Act Aggregated Statistics For Year 2003 (Based on 2 partial tracts)
A) FHA, FSA/RHS & VA Home Purchase Loans
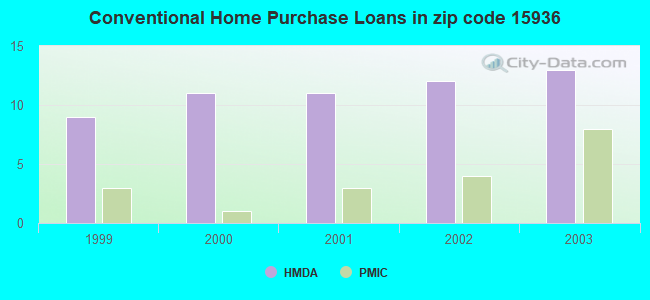
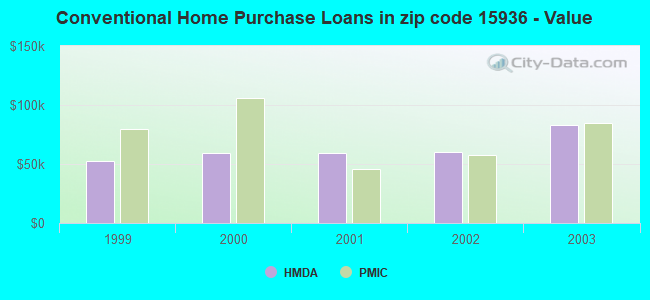
B) Conventional Home Purchase Loans
C) Refinancings
D) Home Improvement Loans
F) Non-occupant Loans on < 5 Family Dwellings (A B C & D)
Number
Average Value
Number
Average Value
Number
Average Value
Number
Average Value
Number
Average Value
LOANS ORIGINATED
1
$95,840
13
$82,893
65
$63,604
30
$19,795
3
$92,390
APPLICATIONS APPROVED, NOT ACCEPTED
0
$0
3
$51,593
11
$58,696
2
$24,935
1
$32,380
APPLICATIONS DENIED
0
$0
9
$42,310
40
$60,275
13
$15,742
3
$42,957
APPLICATIONS WITHDRAWN
0
$0
1
$58,280
17
$81,102
3
$23,313
1
$18,780
FILES CLOSED FOR INCOMPLETENESS
0
$0
1
$47,270
1
$136,640
1
$32,380
0
$0
Aggregated Statistics For Year 2002 (Based on 2 partial tracts)
A) FHA, FSA/RHS & VA Home Purchase Loans
B) Conventional Home Purchase Loans
C) Refinancings
D) Home Improvement Loans
F) Non-occupant Loans on < 5 Family Dwellings (A B C & D)
Number
Average Value
Number
Average Value
Number
Average Value
Number
Average Value
Number
Average Value
LOANS ORIGINATED
1
$96,490
12
$60,172
49
$59,579
19
$22,018
3
$100,593
APPLICATIONS APPROVED, NOT ACCEPTED
0
$0
1
$58,280
16
$48,813
1
$15,540
0
$0
APPLICATIONS DENIED
1
$28,490
5
$47,664
37
$61,435
7
$18,133
1
$73,180
APPLICATIONS WITHDRAWN
0
$0
0
$0
19
$64,828
1
$38,860
0
$0
FILES CLOSED FOR INCOMPLETENESS
0
$0
0
$0
4
$60,712
1
$9,710
0
$0
Aggregated Statistics For Year 2001 (Based on 2 partial tracts)
A) FHA, FSA/RHS & VA Home Purchase Loans
B) Conventional Home Purchase Loans
C) Refinancings
D) Home Improvement Loans
F) Non-occupant Loans on < 5 Family Dwellings (A B C & D)
Number
Average Value
Number
Average Value
Number
Average Value
Number
Average Value
Number
Average Value
LOANS ORIGINATED
3
$62,387
11
$59,697
52
$49,828
21
$20,384
3
$83,110
APPLICATIONS APPROVED, NOT ACCEPTED
0
$0
3
$26,550
14
$49,773
1
$30,440
0
$0
APPLICATIONS DENIED
1
$42,090
3
$39,073
29
$60,964
11
$11,656
3
$61,737
APPLICATIONS WITHDRAWN
0
$0
1
$29,140
20
$60,000
2
$9,390
1
$122,400
FILES CLOSED FOR INCOMPLETENESS
0
$0
0
$0
3
$52,240
0
$0
0
$0
Aggregated Statistics For Year 2000 (Based on 2 partial tracts)
A) FHA, FSA/RHS & VA Home Purchase Loans
B) Conventional Home Purchase Loans
C) Refinancings
D) Home Improvement Loans
F) Non-occupant Loans on < 5 Family Dwellings (A B C & D)
Number
Average Value
Number
Average Value
Number
Average Value
Number
Average Value
Number
Average Value
LOANS ORIGINATED
5
$45,202
11
$59,108
22
$43,389
20
$10,588
3
$88,290
APPLICATIONS APPROVED, NOT ACCEPTED
0
$0
2
$30,435
5
$51,808
5
$23,054
1
$23,310
APPLICATIONS DENIED
1
$22,020
18
$27,595
29
$49,731
12
$23,907
4
$9,390
APPLICATIONS WITHDRAWN
1
$22,020
1
$12,300
14
$38,764
3
$30,437
0
$0
FILES CLOSED FOR INCOMPLETENESS
1
$46,630
0
$0
2
$89,695
0
$0
0
$0
Aggregated Statistics For Year 1999 (Based on 1 partial tract)
A) FHA, FSA/RHS & VA Home Purchase Loans
B) Conventional Home Purchase Loans
C) Refinancings
D) Home Improvement Loans
F) Non-occupant Loans on < 5 Family Dwellings (A B C & D)
Detailed PMIC statistics for the following Tracts:0205.00
2003 - 2018 National Fire Incident Reporting System (NFIRS) incidents
Based on the data from the years 2003 - 2018 the average number of fire incidents per year is 10. The highest number of fire incidents - 19 took place in 2004, and the least - 3 in 2003. The data has an increasing trend.
When looking into fire subcategories, the most reports belonged to: Structure Fires (54.3%), and Other (28.0%).
Fire incident types reported to NFIRS in Zip Code 15936

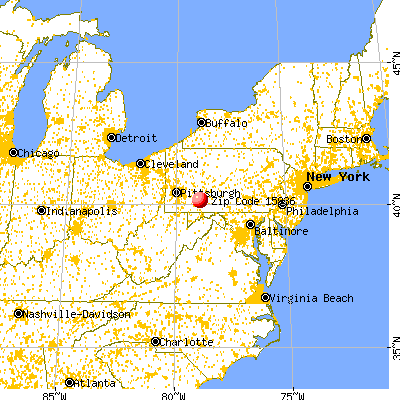


 Nearest zip codes: 15953, 15563, 15928, 15935, 15937, 15541.
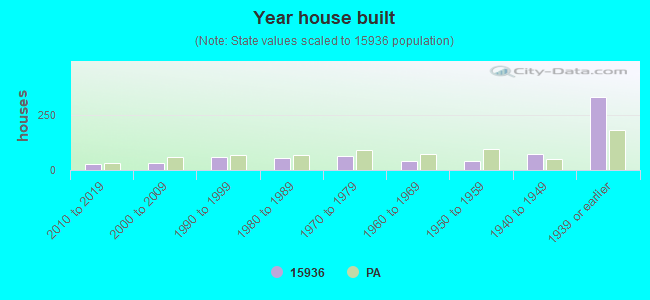


 Based on the data from the years 2003 - 2018 the average number of fire incidents per year is 10. The highest number of fire incidents - 19 took place in 2004, and the least - 3 in 2003. The data has an increasing trend.
 When looking into fire subcategories, the most reports belonged to: Structure Fires (54.3%), and Other (28.0%).