Estimated zip code population in 2022: 1,701 Zip code population in 2010: 2,228 Zip code population in 2000: 2,197
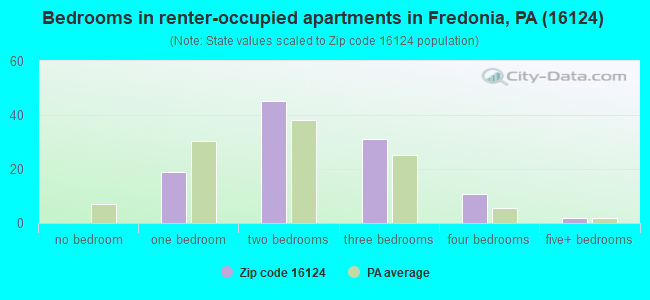
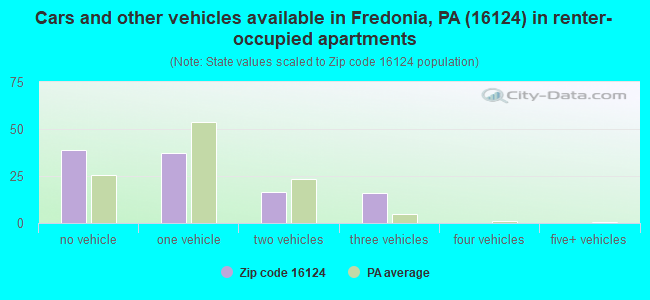
Houses and condos: 750 Renter-occupied apartments: 109
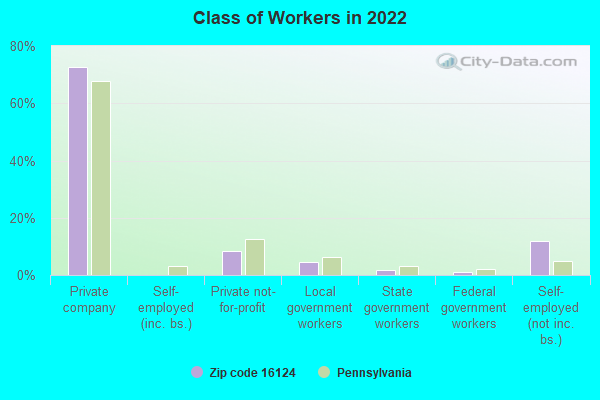
% of renters here:
17%
State:
31%
March 2022 cost of living index in zip code 16124: 91.8 (less than average, U.S. average is 100)
Land area: 28.0 sq. mi. Water area: 0.0 sq. mi.
Population density: 61 people per square mile
(very low).
OSM Map
General Map
Google Map
MSN Map
OSM Map
General Map
Google Map
MSN Map
OSM Map
General Map
Google Map
MSN Map
OSM Map
General Map
Google Map
MSN Map
Please wait while loading the map...
Real estate property taxes paid for housing units in 2022:
This zip code:
0.9% ($1,462)
Pennsylvania:
1.3% ($3,094)
Median real estate property taxes paid for housing units with mortgages in 2022: $1,806 (1.0%) Median real estate property taxes paid for housing units with no mortgage in 2022: $1,331 (0.9%)
Business Search- 14 Million verified businesses
Males: 863
(50.7%)
Females: 838
(49.3%)
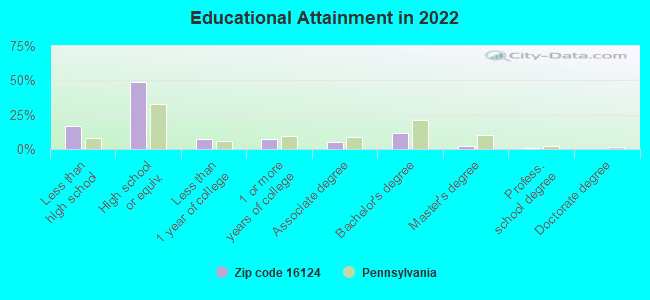
For population 25 years and over in 16124:
High school or higher: 81.0%
Bachelor's degree or higher: 14.8%
Graduate or professional degree: 3.3%
Unemployed: 4.1%
Mean travel time to work (commute): 28.5 minutes
For population 15 years and over in 16124:
Never married: 26.8%
Now married: 54.3%
Separated: 0.3%
Widowed: 7.6%
Divorced: 11.1%
Zip code 16124 compared to state average:
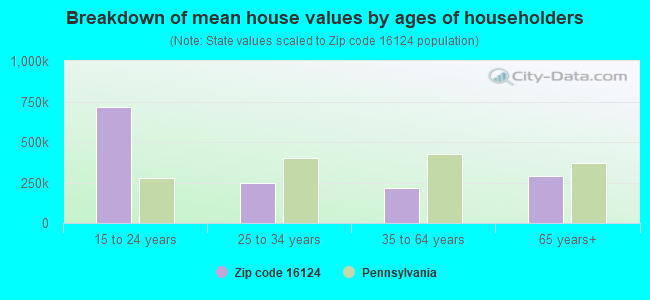
Median house value below state average.
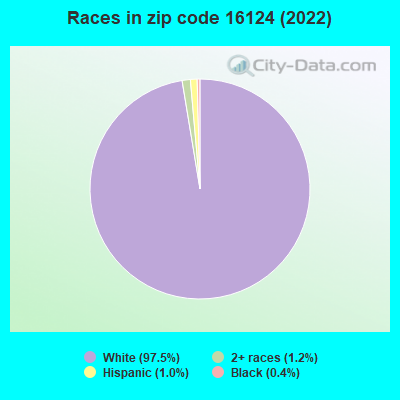
Black race population percentage significantly below state average.
Hispanic race population percentage significantly below state average.
Foreign-born population percentage significantly below state average.
Renting percentage below state average.
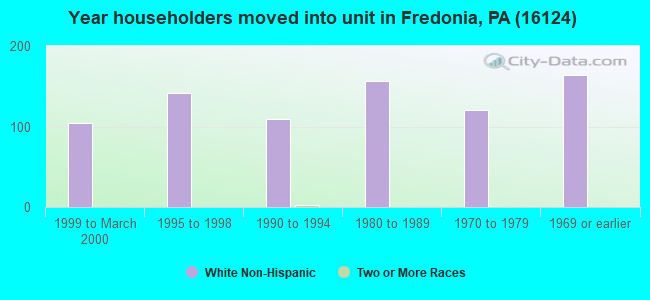
Length of stay since moving in significantly above state average.
Number of college students below state average.
Percentage of population with a bachelor's degree or higher significantly below state average.
Averages for the 2020 tax year for zip code 16124, filed in 2021:
Average Adjusted Gross Income (AGI) in 2020: $49,368 (Individual Income Tax Returns)
Here:
$49,368
State:
$75,707
Salary/wage: $45,519 (reported on 71.1% of returns)
Here:
$45,519
State:
$62,806
(% of AGI for various income ranges: 1060.5% for AGIs below $25k, 3395.3% for AGIs $25k-50k, 6046.0% for AGIs $50k-75k, 8916.7% for AGIs $75k-100k, 16581.7% for AGIs $100k-200k)
Taxable interest for individuals: $769 (reported on 28.9% of returns)
This zip code:
$769
Pennsylvania:
$1,633
(% of AGI for various income ranges: 19.5% for AGIs below $25k, 8.2% for AGIs $25k-50k, 30.0% for AGIs $50k-75k, 23.3% for AGIs $75k-100k, 175.0% for AGIs $100k-200k)
Ordinary dividends: $2,413 (reported on 16.7% of returns)
Here:
$2,413
State:
$7,382
(% of AGI for various income ranges: 26.8% for AGIs below $25k, 11.8% for AGIs $25k-50k, 42.0% for AGIs $50k-75k, 41.7% for AGIs $75k-100k, 373.3% for AGIs $100k-200k)
Net capital gain/loss in AGI: +$5,382 (reported on 12.2% of returns)
Here:
+$5,382
State:
+$23,522
(% of AGI for various income ranges: 13.2% for AGIs below $25k, 50.6% for AGIs $25k-50k, 59.0% for AGIs $50k-75k, 703.3% for AGIs $100k-200k)
Profit/loss from business: +$17,135 (reported on 18.9% of returns)
Here:
+$17,135
State:
+$16,274
(% of AGI for various income ranges: 226.3% for AGIs below $25k, 684.7% for AGIs $25k-50k, 471.0% for AGIs $50k-75k, 1413.3% for AGIs $75k-100k)
Taxable individual retirement arrangement distribution: $12,582 (reported on 12.2% of returns)
16124:
$12,582
Pennsylvania:
$18,583
(% of AGI for various income ranges: 120.0% for AGIs below $25k, 310.6% for AGIs $25k-50k, 1046.7% for AGIs $75k-100k)
Earned income credit: $2,110 (reported on 11.1% of returns)
Here:
$2,110
State:
$2,100
(% of AGI for various income ranges: 58.9% for AGIs below $25k, 58.2% for AGIs $25k-50k)
Percentage of individuals using paid preparers for their 2020 taxes: 85.6%
Here:
86%
State:
92%
(% for various income ranges: 81.2% for AGIs below $25k, 84.0% for AGIs $25k-50k, 86.7% for AGIs $50k-75k, 100.0% for AGIs $75k-100k, 90.0% for AGIs $100k-200k)
Averages for the 2012 tax year for zip code 16124, filed in 2013:
Average Adjusted Gross Income (AGI) in 2012: $55,556 (Individual Income Tax Returns)
Here:
$55,556
State:
$61,346
Salary/wage: $37,893 (reported on 76.3% of returns)
Here:
$37,893
State:
$51,902
(% of AGI for various income ranges: 60.5% for AGIs below $25k, 69.2% for AGIs $25k-50k, 76.0% for AGIs $50k-75k, 67.7% for AGIs $75k-100k, 50.4% for AGIs $100k-200k, 15.3% for AGIs over 200k)
Taxable interest for individuals: $822 (reported on 38.7% of returns)
This zip code:
$822
Pennsylvania:
$1,588
(% of AGI for various income ranges: 1.0% for AGIs below $25k, 0.4% for AGIs $25k-50k, 0.4% for AGIs $50k-75k, 0.5% for AGIs $75k-100k, 0.4% for AGIs $100k-200k, 0.8% for AGIs over 200k)
Ordinary dividends: $1,073 (reported on 16.1% of returns)
Here:
$1,073
State:
$5,827
(% of AGI for various income ranges: 0.6% for AGIs below $25k, 0.3% for AGIs $25k-50k, 0.6% for AGIs $50k-75k, 0.6% for AGIs $100k-200k)
Net capital gain/loss in AGI: +$1,150 (reported on 8.6% of returns)
Here:
+$1,150
State:
+$14,495
Profit/loss from business: +$11,325 (reported on 17.2% of returns)
Here:
+$11,325
State:
+$16,268
(% of AGI for various income ranges: 11.4% for AGIs below $25k, 8.0% for AGIs $25k-50k, 1.8% for AGIs $50k-75k, 6.3% for AGIs $75k-100k)
Taxable individual retirement arrangement distribution: $7,975 (reported on 8.6% of returns)
16124:
$7,975
Pennsylvania:
$14,550
(% of AGI for various income ranges: 2.4% for AGIs below $25k, 2.3% for AGIs $25k-50k, 3.0% for AGIs $100k-200k)
Total itemized deductions: $17,675 (12% of AGI, reported on 12.9% of returns)
Here:
$17,675
State:
$23,538
Here:
12.0% of AGI
State:
18.4% of AGI
(% of AGI for various income ranges: 3.9% for AGIs $25k-50k, 5.9% for AGIs $50k-75k, 12.3% for AGIs $100k-200k)
Charity contributions: $4,688 (reported on 8.6% of returns)
Here:
$4,688
State:
$4,025
Taxes paid: $6,525 (reported on 12.9% of returns)
16124:
$6,525
State:
$9,982
(% of AGI for various income ranges: 0.7% for AGIs $25k-50k, 2.0% for AGIs $50k-75k, 5.2% for AGIs $100k-200k)
Earned income credit: $2,115 (reported on 14.0% of returns)
Here:
$2,115
State:
$2,106
(% of AGI for various income ranges: 4.3% for AGIs below $25k, 0.9% for AGIs $25k-50k)
Percentage of individuals using paid preparers for their 2012 taxes: 54.8%
Here:
55%
State:
53%
(% for various income ranges: 48.6% for AGIs below $25k, 54.2% for AGIs $25k-50k, 53.8% for AGIs $50k-75k, 75.0% for AGIs $75k-100k, 62.5% for AGIs $100k-200k, 66.7% for AGIs over 200k)
Averages for the 2004 tax year for zip code 16124, filed in 2005:
Average Adjusted Gross Income (AGI) in 2004: $32,215 (Individual Income Tax Returns)
Here:
$32,215
State:
$48,049
Salary/wage: $30,913 (reported on 77.2% of returns)
Here:
$30,913
State:
$42,646
(% of AGI for various income ranges: 83.3% for AGIs below $10k, 63.6% for AGIs $10k-25k, 79.3% for AGIs $25k-50k, 82.5% for AGIs $50k-75k, 70.7% for AGIs $75k-100k, 51.1% for AGIs over 100k)
Taxable interest for individuals: $993 (reported on 46.8% of returns)
This zip code:
$993
Pennsylvania:
$1,657
(% of AGI for various income ranges: 6.1% for AGIs below $10k, 3.5% for AGIs $10k-25k, 1.2% for AGIs $25k-50k, 0.7% for AGIs $50k-75k, 1.0% for AGIs $75k-100k, 0.9% for AGIs over 100k)
Taxable dividends: $1,174 (reported on 19.3% of returns)
Here:
$1,174
State:
$3,566
(% of AGI for various income ranges: 3.7% for AGIs below $10k, 0.7% for AGIs $10k-25k, 0.4% for AGIs $25k-50k, 0.2% for AGIs $50k-75k, 1.2% for AGIs $75k-100k, 1.7% for AGIs over 100k)
Net capital gain/loss: +$1,624 (reported on 12.3% of returns)
Here:
+$1,624
State:
+$9,716
(% of AGI for various income ranges: -1.4% for AGIs below $10k, 0.6% for AGIs $10k-25k, 1.0% for AGIs $25k-50k, 0.6% for AGIs $50k-75k, 1.1% for AGIs $75k-100k)
Profit/loss from business: +$8,764 (reported on 19.1% of returns)
Here:
+$8,764
State:
+$14,267
(% of AGI for various income ranges: 16.2% for AGIs below $10k, 12.0% for AGIs $10k-25k, 6.6% for AGIs $25k-50k, 2.9% for AGIs $50k-75k, 2.9% for AGIs $75k-100k)
IRA payment deduction: $2,350 (reported on 2.1% of returns)
16124:
$2,350
Pennsylvania:
$2,903
Total itemized deductions: $12,679 (18% of AGI, reported on 11.5% of returns)
Here:
$12,679
State:
$18,804
Here:
17.9% of AGI
State:
19.5% of AGI
(% of AGI for various income ranges: 11.7% for AGIs below $10k, 3.4% for AGIs $25k-50k, 7.4% for AGIs $50k-75k, 6.8% for AGIs over 100k)
Charity contributions deductions: $2,952 (4% of AGI, reported on 8.7% of returns)
Here:
$2,952
State:
$3,337
Here:
3.9% of AGI
State:
3.3% of AGI
Total tax: $4,234 (reported on 67.4% of returns)
16124:
$4,234
State:
$8,008
(% of AGI for various income ranges: 2.4% for AGIs below $10k, 4.1% for AGIs $10k-25k, 6.4% for AGIs $25k-50k, 8.6% for AGIs $50k-75k, 10.5% for AGIs $75k-100k, 21.0% for AGIs over 100k)
Earned income credit: $1,569 (reported on 12.2% of returns)
Here:
$1,569
State:
$1,643
Percentage of individuals using paid preparers for their 2004 taxes: 62.4%
Here:
62%
State:
56%
(% for various income ranges: 61.3% for AGIs below $10k, 61.0% for AGIs $10k-25k, 64.6% for AGIs $25k-50k, 59.9% for AGIs $50k-75k, 64.1% for AGIs $75k-100k, 84.2% for AGIs over 100k)
Likely homosexual households (counted as self-reported same-sex unmarried-partner households)
Lesbian couples: 1.3% of all households
Gay men: 0.0% of all households
Household received Food Stamps/SNAP in the past 12 months: 90 Household did not receive Food Stamps/SNAP in the past 12 months: 570
Women who had a birth in the past 12 months: 21 (22 now married, 0 unmarried) Women who did not have a birth in the past 12 months: 298 (152 now married, 145 unmarried)
Housing units in zip code 16124 with a mortgage: 230 (29 second mortgage, 23 both second mortgage and home equity loan) Houses without a mortgage: 26
Median monthly owner costs for units with a mortgage: $1,092 Median monthly owner costs for units without a mortgage: $397
Residents with income below the poverty level in 2022:
This zip code:
14.2%
Whole state:
11.8%
Residents with income below 50% of the poverty level in 2022:
This zip code:
9.7%
Whole state:
6.1%
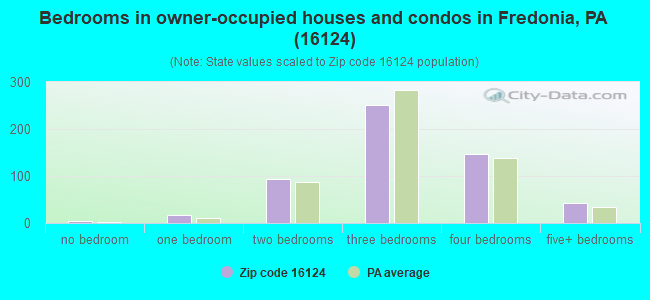
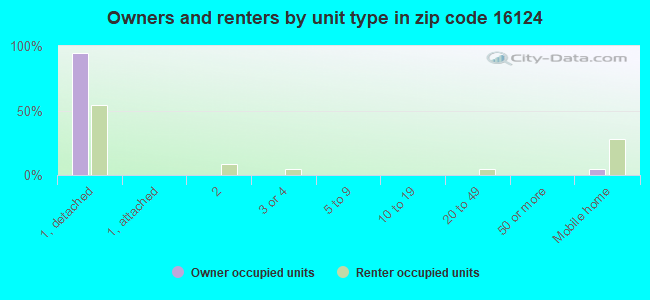
Median number of rooms in houses and condos:
Here:
6.5
State:
6.8
Median number of rooms in apartments:
Here:
5.0
State:
4.3
Notable locations in this zip code not listed on our city pages
In group quarters: 36 (-1 institutionalized population)
Size of family households: 245 2-persons, 78 3-persons, 39 4-persons, 55 5-persons, 9 6-persons, 30 7-or-more-persons
Size of nonfamily households: 166 1-person, 37 2-persons, 1 3-persons
366 married couples with children.
25 single-parent households (7 men, 18 women).
86.1% of residents of 16124 zip code speak English at home.
13.5% of residents speak other Indo-European language at home (59% very well, 31% well, 6% not well, 5% not at all).
Foreign born population: 11 (0.7%) (28.1% of them are naturalized citizens)
This zip code:
0.7%
Whole state:
7.5%
73%Taiwan
18%France
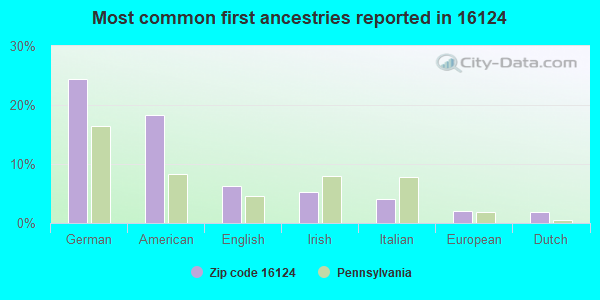
24%German
18%American
6%English
5%Irish
4%Italian
2%European
2%Dutch
Year of entry for the foreign-born population
02010 or later
32000 to 2009
01990 to 1999
10Before 1990
Facilities with environmental interests located in this zip code:
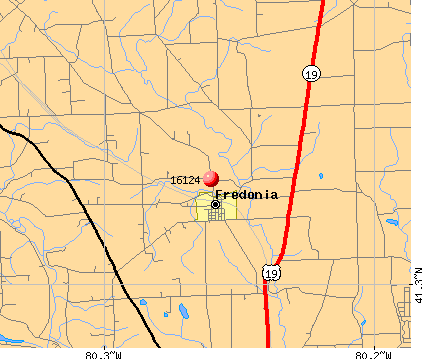
BONSAL AMER FREDONIA PLT (97 MAIN STREET in FREDONIA, PA)
AIR MINOR (AIRS/AFS) STATE MASTER (Pennsylvania database) - AFS-58-2652780-2, AIR PROGRAM TRI REPORTER (Tracking of toxic chemicals releasing facilities) Business SIC classification: CONCRETE PRODUCTS, EXCEPT BLOCK AND BRICK Organizations: OLDCASTLE RETAIL INC. (CONTACT/OWNER)
, OLDCASTLE RETAIL, INC. (CONTACT/OWNER)
, SOUTHDOWN INCORPORATED (CONTACT/OWNER)
, SPECIALITY MINERALS DIVISION OF CEMEX INCORPORATED (CONTACT/OWNER)
, OLDCASTLE RETAIL INC. (OWNER/OPERATOR)
, OLDCASTLE RETAIL, INC. (OWNER/OPERATOR)
, SOUTHDOWN INCORPORATED (OWNER/OPERATOR)
, SPECIALITY MINERALS DIVISION OF CEMEX INCORPORATED (OWNER/OPERATOR)
Alternative names: AMERICAN STONE MIX, AMER STONE MIX INC FREDONIA, AMERICAN STONE-MIX INC., CASTLE RETAIL INC (DBA BONSAL AMERICAN), OLDCASTLE RETAIL INC (DBA BONSAL AMERICAN)
Housing units lacking complete plumbing facilities: 6.9% Housing units lacking complete kitchen facilities: 11.3%
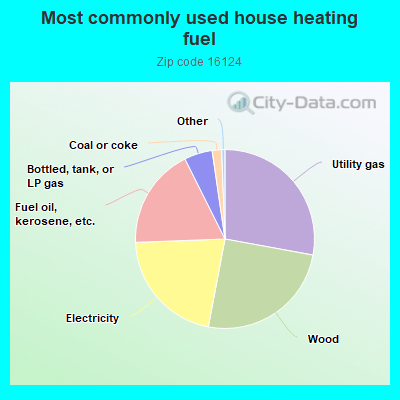
28.0%Utility gas
25.2%Wood
21.5%Electricity
18.3%Fuel oil, kerosene, etc.
5.1%Bottled, tank, or LP gas
1.7%Coal or coke
Population in 1990: 1,772. Population change in the 1990s: +425 (+24.0%).
Place of birth for U.S.-born residents:
This state: 1,442
Northeast: 57
Midwest: 108
South: 63
West: 4
69% of the 16124 zip code residents lived in the same house 5 years ago. Out of people who lived in different houses, 62% lived in this county. Out of people who lived in different counties, 50% lived in Pennsylvania.
92% of the 16124 zip code residents lived in the same house 1 year ago. Out of people who lived in different houses, 81% moved from this county. Out of people who lived in different houses, 8% moved from different county within same state. Out of people who lived in different houses, 9% moved from different state.
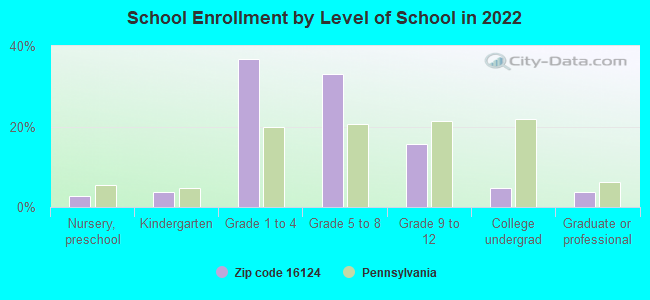
Private vs. public school enrollment:
Students in private schools in grades 1 to 8 (elementary and middle school): 65
Here:
30.3%
Pennsylvania:
15.7%
Students in private schools in grades 9 to 12 (high school):
Here:
0.0%
Pennsylvania:
13.4%
Students in private undergraduate colleges: 10
Here:
73.3%
Pennsylvania:
39.8%
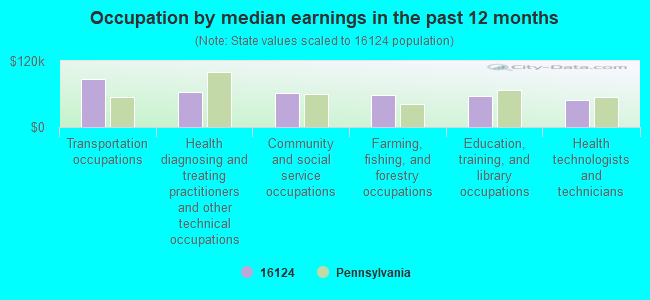
Occupation by median earnings in the past 12 months ($)
87,608Transportation occupations
62,745Health diagnosing and treating practitioners and other technical occupations
62,173Community and social service occupations
57,814Farming, fishing, and forestry occupations
56,600Education, training, and library occupations
49,333Health technologists and technicians
Top industries in this zip code by the number of employees in 2005:
Health Care and Social Assistance: Homes for the Elderly (20-49 employees: 1 establishment)
Construction: Commercial and Institutional Building Construction (5-9: 2)
People in group quarters in 2010:
27 people in nursing facilities/skilled-nursing facilities
2 people in group homes intended for adults
People in group quarters in 2000:
40 people in nursing homes
Fatal accident statistics in 2013:
Fatal accident count: 2
Vehicles involved in fatal accidents: 2
Fatal accidents caused by drunken drivers: 0
Fatalities: 2
Persons involved in fatal accidents: 3
Pedestrians involved in fatal accidents: 0
Home Mortgage Disclosure Act Aggregated Statistics For Year 2009 (Based on 4 partial tracts)
A) FHA, FSA/RHS & VA Home Purchase Loans
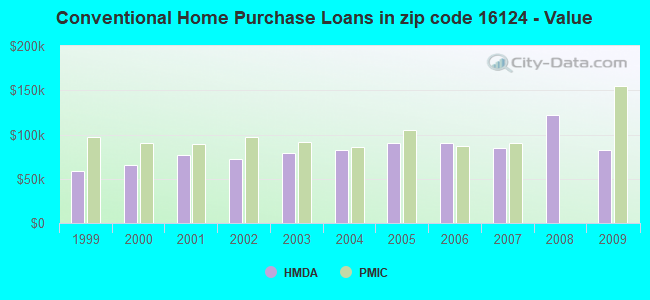
B) Conventional Home Purchase Loans
C) Refinancings
D) Home Improvement Loans
F) Non-occupant Loans on < 5 Family Dwellings (A B C & D)
G) Loans On Manufactured Home Dwelling (A B C & D)
Number
Average Value
Number
Average Value
Number
Average Value
Number
Average Value
Number
Average Value
Number
Average Value
LOANS ORIGINATED
12
$85,058
16
$82,771
73
$102,510
17
$38,331
4
$56,710
7
$36,083
APPLICATIONS APPROVED, NOT ACCEPTED
1
$52,350
0
$0
6
$92,878
3
$37,197
1
$46,240
0
$0
APPLICATIONS DENIED
1
$60,810
4
$62,552
35
$126,123
8
$32,232
1
$222,310
3
$45,457
APPLICATIONS WITHDRAWN
1
$148,780
2
$105,085
15
$135,275
1
$14,770
1
$87,720
0
$0
FILES CLOSED FOR INCOMPLETENESS
0
$0
0
$0
1
$105,600
1
$5,820
0
$0
0
$0
Aggregated Statistics For Year 2008 (Based on 4 partial tracts)
A) FHA, FSA/RHS & VA Home Purchase Loans
B) Conventional Home Purchase Loans
C) Refinancings
D) Home Improvement Loans
F) Non-occupant Loans on < 5 Family Dwellings (A B C & D)
G) Loans On Manufactured Home Dwelling (A B C & D)
Number
Average Value
Number
Average Value
Number
Average Value
Number
Average Value
Number
Average Value
Number
Average Value
LOANS ORIGINATED
9
$73,826
22
$121,995
61
$103,441
30
$28,766
7
$80,114
9
$42,546
APPLICATIONS APPROVED, NOT ACCEPTED
0
$0
2
$156,545
10
$70,266
3
$25,993
0
$0
0
$0
APPLICATIONS DENIED
1
$89,370
7
$85,767
60
$115,527
12
$55,974
2
$89,520
8
$41,584
APPLICATIONS WITHDRAWN
1
$88,840
2
$120,660
12
$121,373
2
$119,750
0
$0
1
$100,470
FILES CLOSED FOR INCOMPLETENESS
0
$0
0
$0
2
$126,660
1
$57,890
0
$0
0
$0
Aggregated Statistics For Year 2007 (Based on 4 partial tracts)
A) FHA, FSA/RHS & VA Home Purchase Loans
B) Conventional Home Purchase Loans
C) Refinancings
D) Home Improvement Loans
F) Non-occupant Loans on < 5 Family Dwellings (A B C & D)
G) Loans On Manufactured Home Dwelling (A B C & D)
Number
Average Value
Number
Average Value
Number
Average Value
Number
Average Value
Number
Average Value
Number
Average Value
LOANS ORIGINATED
5
$73,956
38
$85,092
78
$78,819
34
$40,167
4
$53,778
10
$49,002
APPLICATIONS APPROVED, NOT ACCEPTED
1
$127,070
5
$99,818
14
$81,020
6
$31,278
1
$182,780
2
$53,165
APPLICATIONS DENIED
1
$56,740
14
$78,156
70
$94,496
23
$31,813
1
$39,920
10
$35,599
APPLICATIONS WITHDRAWN
0
$0
4
$89,910
29
$109,428
1
$76,660
1
$18,770
1
$82,370
FILES CLOSED FOR INCOMPLETENESS
0
$0
5
$81,318
4
$118,500
0
$0
0
$0
0
$0
Aggregated Statistics For Year 2006 (Based on 4 partial tracts)
A) FHA, FSA/RHS & VA Home Purchase Loans
B) Conventional Home Purchase Loans
C) Refinancings
D) Home Improvement Loans
F) Non-occupant Loans on < 5 Family Dwellings (A B C & D)
G) Loans On Manufactured Home Dwelling (A B C & D)
Number
Average Value
Number
Average Value
Number
Average Value
Number
Average Value
Number
Average Value
Number
Average Value
LOANS ORIGINATED
6
$82,563
50
$90,256
79
$78,736
43
$30,433
7
$62,949
11
$48,600
APPLICATIONS APPROVED, NOT ACCEPTED
1
$57,330
6
$58,947
16
$87,409
4
$33,968
0
$0
4
$46,395
APPLICATIONS DENIED
2
$66,785
15
$76,110
73
$96,730
21
$32,645
1
$8,200
10
$65,726
APPLICATIONS WITHDRAWN
1
$48,650
5
$75,534
35
$99,861
3
$33,567
0
$0
1
$30,410
FILES CLOSED FOR INCOMPLETENESS
0
$0
1
$52,620
6
$76,493
0
$0
0
$0
0
$0
Aggregated Statistics For Year 2005 (Based on 4 partial tracts)
A) FHA, FSA/RHS & VA Home Purchase Loans
B) Conventional Home Purchase Loans
C) Refinancings
D) Home Improvement Loans
F) Non-occupant Loans on < 5 Family Dwellings (A B C & D)
G) Loans On Manufactured Home Dwelling (A B C & D)
Number
Average Value
Number
Average Value
Number
Average Value
Number
Average Value
Number
Average Value
Number
Average Value
LOANS ORIGINATED
2
$59,800
46
$90,129
88
$75,271
36
$32,866
6
$50,440
8
$50,099
APPLICATIONS APPROVED, NOT ACCEPTED
0
$0
5
$80,740
18
$96,578
4
$32,890
0
$0
1
$35,170
APPLICATIONS DENIED
1
$79,780
17
$65,561
108
$92,470
14
$23,117
3
$39,950
11
$48,386
APPLICATIONS WITHDRAWN
1
$49,180
7
$84,904
52
$102,639
6
$111,273
1
$74,400
2
$107,560
FILES CLOSED FOR INCOMPLETENESS
0
$0
3
$79,873
6
$131,558
1
$31,570
0
$0
0
$0
Aggregated Statistics For Year 2004 (Based on 4 partial tracts)
A) FHA, FSA/RHS & VA Home Purchase Loans
B) Conventional Home Purchase Loans
C) Refinancings
D) Home Improvement Loans
F) Non-occupant Loans on < 5 Family Dwellings (A B C & D)
G) Loans On Manufactured Home Dwelling (A B C & D)
Number
Average Value
Number
Average Value
Number
Average Value
Number
Average Value
Number
Average Value
Number
Average Value
LOANS ORIGINATED
3
$95,640
40
$82,543
98
$77,041
32
$36,869
6
$57,232
10
$51,983
APPLICATIONS APPROVED, NOT ACCEPTED
0
$0
3
$51,350
19
$96,922
3
$24,247
1
$37,860
3
$57,290
APPLICATIONS DENIED
1
$29,080
17
$80,505
80
$75,486
23
$21,394
7
$43,723
17
$38,013
APPLICATIONS WITHDRAWN
0
$0
5
$111,262
44
$90,177
4
$69,695
0
$0
3
$63,767
FILES CLOSED FOR INCOMPLETENESS
0
$0
1
$32,790
17
$91,492
1
$19,830
0
$0
1
$45,340
Aggregated Statistics For Year 2003 (Based on 4 partial tracts)
A) FHA, FSA/RHS & VA Home Purchase Loans
B) Conventional Home Purchase Loans
C) Refinancings
D) Home Improvement Loans
F) Non-occupant Loans on < 5 Family Dwellings (A B C & D)
Number
Average Value
Number
Average Value
Number
Average Value
Number
Average Value
Number
Average Value
LOANS ORIGINATED
4
$85,295
46
$78,814
190
$77,351
41
$40,075
4
$68,312
APPLICATIONS APPROVED, NOT ACCEPTED
0
$0
7
$76,276
32
$74,420
8
$42,358
0
$0
APPLICATIONS DENIED
1
$70,860
17
$46,004
94
$92,217
15
$30,263
4
$31,335
APPLICATIONS WITHDRAWN
0
$0
9
$96,382
35
$100,221
3
$25,357
1
$33,590
FILES CLOSED FOR INCOMPLETENESS
0
$0
1
$45,740
6
$83,433
1
$54,200
0
$0
Aggregated Statistics For Year 2002 (Based on 2 partial tracts)
A) FHA, FSA/RHS & VA Home Purchase Loans
B) Conventional Home Purchase Loans
C) Refinancings
D) Home Improvement Loans
F) Non-occupant Loans on < 5 Family Dwellings (A B C & D)
Number
Average Value
Number
Average Value
Number
Average Value
Number
Average Value
Number
Average Value
LOANS ORIGINATED
5
$72,102
32
$72,158
94
$72,737
18
$20,258
4
$39,005
APPLICATIONS APPROVED, NOT ACCEPTED
0
$0
4
$73,580
21
$64,222
2
$30,730
0
$0
APPLICATIONS DENIED
1
$182,620
17
$42,795
51
$78,638
8
$19,946
1
$183,800
APPLICATIONS WITHDRAWN
0
$0
3
$58,707
18
$73,218
2
$45,505
0
$0
FILES CLOSED FOR INCOMPLETENESS
0
$0
2
$29,550
7
$87,469
0
$0
0
$0
Aggregated Statistics For Year 2001 (Based on 2 partial tracts)
A) FHA, FSA/RHS & VA Home Purchase Loans
B) Conventional Home Purchase Loans
C) Refinancings
D) Home Improvement Loans
F) Non-occupant Loans on < 5 Family Dwellings (A B C & D)
Number
Average Value
Number
Average Value
Number
Average Value
Number
Average Value
Number
Average Value
LOANS ORIGINATED
5
$61,228
37
$76,654
77
$79,440
27
$36,423
5
$65,010
APPLICATIONS APPROVED, NOT ACCEPTED
1
$44,320
5
$38,770
27
$60,786
8
$20,020
1
$9,460
APPLICATIONS DENIED
1
$40,780
17
$25,935
59
$69,818
8
$32,653
0
$0
APPLICATIONS WITHDRAWN
2
$83,035
2
$39,300
15
$61,070
5
$45,152
0
$0
FILES CLOSED FOR INCOMPLETENESS
0
$0
0
$0
8
$65,822
1
$23,640
0
$0
Aggregated Statistics For Year 2000 (Based on 2 partial tracts)
A) FHA, FSA/RHS & VA Home Purchase Loans
B) Conventional Home Purchase Loans
C) Refinancings
D) Home Improvement Loans
F) Non-occupant Loans on < 5 Family Dwellings (A B C & D)
Number
Average Value
Number
Average Value
Number
Average Value
Number
Average Value
Number
Average Value
LOANS ORIGINATED
3
$71,903
24
$66,069
40
$54,978
31
$17,177
2
$89,240
APPLICATIONS APPROVED, NOT ACCEPTED
0
$0
11
$44,916
13
$56,191
4
$5,320
1
$11,820
APPLICATIONS DENIED
1
$58,510
32
$29,107
28
$60,050
8
$14,628
1
$108,150
APPLICATIONS WITHDRAWN
0
$0
2
$30,140
17
$52,182
4
$18,765
0
$0
FILES CLOSED FOR INCOMPLETENESS
0
$0
1
$83,920
2
$53,780
0
$0
0
$0
Aggregated Statistics For Year 1999 (Based on 1 partial tract)
A) FHA, FSA/RHS & VA Home Purchase Loans
B) Conventional Home Purchase Loans
C) Refinancings
D) Home Improvement Loans
F) Non-occupant Loans on < 5 Family Dwellings (A B C & D)

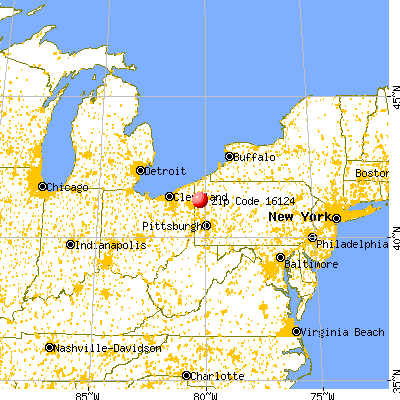


 Nearest zip codes: 16137, 16114, 16125, 16130, 16151, 16154.